Publisher’s version / Version de l'éditeur:
Canadian Journal of Civil Engineering, 11, December 4, pp. 996-1003,
1984-12-01
READ THESE TERMS AND CONDITIONS CAREFULLY BEFORE USING THIS WEBSITE. https://nrc-publications.canada.ca/eng/copyright
Vous avez des questions? Nous pouvons vous aider. Pour communiquer directement avec un auteur, consultez la première page de la revue dans laquelle son article a été publié afin de trouver ses coordonnées. Si vous n’arrivez pas à les repérer, communiquez avec nous à PublicationsArchive-ArchivesPublications@nrc-cnrc.gc.ca.
Questions? Contact the NRC Publications Archive team at
PublicationsArchive-ArchivesPublications@nrc-cnrc.gc.ca. If you wish to email the authors directly, please see the first page of the publication for their contact information.
NRC Publications Archive
Archives des publications du CNRC
This publication could be one of several versions: author’s original, accepted manuscript or the publisher’s version. / La version de cette publication peut être l’une des suivantes : la version prépublication de l’auteur, la version acceptée du manuscrit ou la version de l’éditeur.
Access and use of this website and the material on it are subject to the Terms and Conditions set forth at
Ice action on Nanisivik Wharf, Winter 1979-1980
Frederking, R. M. W.; Nakawo, M.
https://publications-cnrc.canada.ca/fra/droits
L’accès à ce site Web et l’utilisation de son contenu sont assujettis aux conditions présentées dans le site LISEZ CES CONDITIONS ATTENTIVEMENT AVANT D’UTILISER CE SITE WEB.
NRC Publications Record / Notice d'Archives des publications de CNRC:
https://nrc-publications.canada.ca/eng/view/object/?id=d13f6211-e52c-457c-9b18-e0556e82101a https://publications-cnrc.canada.ca/fra/voir/objet/?id=d13f6211-e52c-457c-9b18-e0556e82101aSer
ITH1
,National Research Conseil nationalN216
Council Canada de recherches Canadano.
1244
c .2
BLDe
I
Z
ICE ACTION ON NANlSlVlK WHARF, WINTER 1979-1980
by R.M.W. Frederking and M. Nakawo
I
ANALYZED
Reprinted from Canadian Journal of Vol. 1 1, No. 4, 1984 p. 996- 1 003I
- ' 'Civil Engineering N Y : ~ :
-
CIJTIi
[3
'"T,
l<Es.
!,1-
$1:
&
ip5-
03-
1 P
;
DBR Paper No. 1244
Division of Building Research
CAN. J. CIV. ENG. VOL. l I. 1984
Ice action on Nanisivik wharf, winter 1979-1980
R. FREDERKING
Division of Building Research, National Research Council of Canada, Ottawa, Ont., Canada KIA OR6
AND
M. NAKAWO
Department of Applied Physics, Faculty of Engineering, Hokkaido University, Sapporo, Japan 060 Received October 3, 1983
Revised manuscript accepted May 24, 1984
During the period December 1979 to June 1980, five visits were made to observe and measure ice behaviour around the wharf at Nanisivik, on Baffin Island. The measurements included ice thickness, temperature, salinity, and density, as well as horizontal movements of the ice cover. In March 1980, additional measurements and observations were made of tides, rotations of the ice sheet, and grain structure of the ice. A model for the formation of an active zone of ice between the wharf and the adjacent ice cover has been proposed, based on the observed evolution of ice conditions and internal structure of the active zone. Horizontal growth of the active zone displaces the adjacent ice cover away from the wharf, and in so doing, generates ice pressures estimated at 69 kPa on the wharf.
Key words: ice forces, wharves, ice behaviour, ice properties.
Entre dCcembre 1979 et juin 1980 on a effectue cinq visites au quai de Nanisivik sur I'ile de Baffin afin d'y observer le comportement de la glace et d'en mesurer les dkplacements. On a mesure I'epaisseur, la temperature, la salinite et la densite de la glace ainsi que les dkplacements horizontaux de la couverture de glace. En mars 1980 on a effectut de nouvelles mesures
et observations des markes, des rotations de la couche de glace et de la structure granulaire de la glace. On a proposC un modble de la formation d'une zone active entre le quai et la glace adjacente bask sur I'evolution observCe des conditions de glace et de la structure interne de la zone active. L'agrandissement dans le plan horizontal de la zone active Cloigne du quai la couverture de glace adjacente et engendre ainsi des charges estimCes a 69 kPa sur le quai.
Mots cle's: forces de la glace, appontements, comportement de la glace, propriCtCs de la glace.
Can. J. Civ. Eng. 11. 996- 1003 (1984)
Introduction
The design of marine structures in the Arctic suffers from a lack of knowledge about ice behaviour and design ice loads, as well as a very limited body of experience upon which to base engineering judge- ments. The problem is compounded because the ice and structure interact, i.e., for the same set of ice con- ditions, different types of structures would produce dif- ferent types of ice behaviour and loads. It is important to document whatever experience exists on marine structures in the Arctic, to build up the knowledge base for designers.
The wharf at Nanisivik was one of the first major marine structures to be constructed in the Canadian Arctic (Girgrah and Shah 1978). It has provided an opportunity for studying ice behaviour in relation to a particular structure and to develop and install instru- mentation for measuring ice forces on such a structure (Frederking and Sinha 1978).
Over the winter 1979- 1980 a series of periodic site visits was made (Steltner 1980) to carry out obser- vations and measurements to characterize the processes associated with the evolution of ice conditions around
I
the wharf. This note summarizes these data and ob- servations, describes ice conditions adjacent to the dock, presents an hypothesis for the formation of the active zone, and provides estimates of ice loads. More complete details can be found in Frederking and Nakawo (1 983).Site description
Strathcona Sound (73"N-85"W), on the northern coast of Baffin Island, is one of several fiords branching off Admiralty Inlet. The wharf site is on the south shore of the sound, about 20 km from its outlet. Maximum tidal range is about 2.5 m.
The wharf consists of three sheet-piled cells, each about 20 m in diameter, located about 75 m offshore. Minimum water depth at the outer edge of the cells is
13.5 m.
The sound is usually covered by a land-fast first-year ice cover of 1.6 m average maximum thickness. Freeze- up commences mid- to late September, reaching an ice thickness of 0.4-0.5 m by the beginning of November. The winter ice cover is quite stable; the only visible features are tidal hinges along the shores. No pressure
WEST C E N T B # 0 A P R O N C A U S E W A Y
t
-
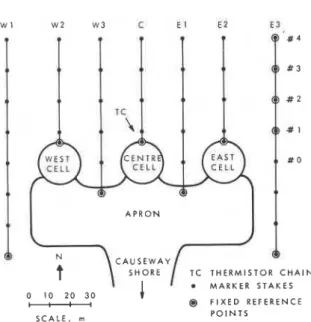
M A R K E R S T A K E S 0 10 20 30 @ F I X E D R E F E R E N C E S C A L E . m P O I N T SFIG. 1. Positions of stake array with respect to wharf for horizontal ice movement and ice thickness measurements.
ridges have been observed in the period 1975 - 1982. The ice cover breaks up around the beginning of July.
Measurements made during site visits Site visits were made in December 1979, and February, March, May, and June 1980, to quantify ice conditions adjacent to the wharf and their changes with time.
Horizontal movements of the ice cover
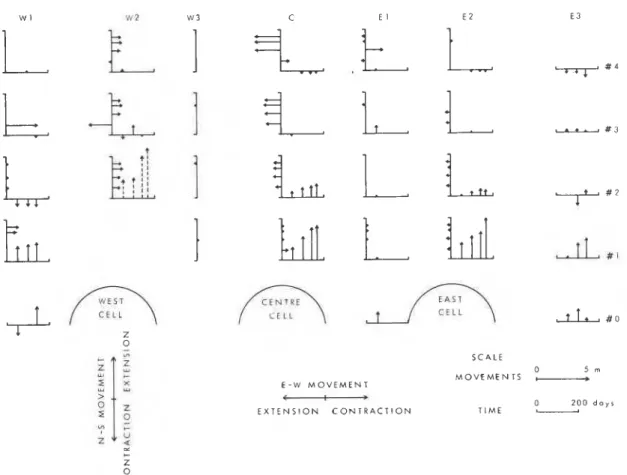
An array of 36 marker stakes was placed on the ice cover on December 16, in the pattern shown in Fig. 1. Movements between adjacent points are presented in Fig. 2. The length of the arrow is proportional to the movement and in the direction indicated. Movements at a point in the north-south direction are relative to the point immediately to the south. Movements in the east-west direction are relative to the point im- mediately to the east. The four arrows represent move- ments on February 13, March 26, May 14, and June 10, 1980, with respect to the initial array laid out December 16, 1979.
Figure 2 shows a movement of the ice cover away from the wharf (northerly direction). The greatest rela- tive movement is an extension (horizontal movement)
998 CAN. J. CIV ENG. VOL. l I. 1984 W 1 W 2 W 3 C E l E 2
L
1
t
i
0 0 S C A L E 0 5 rn M O V E M E N T S ,-. E - W-
M O V E M E N T 0 2 0 0 d a y r E X T E N S I O N C O N T R A C T I O N T I M E-
0 uFIG. 2. Relative horizontal ice movements in north-south and east-west directions as a function of time.
in the 5 m segment between the wharf and line # 1. The between lines # I and #2. Beyond line #2, the ice cover moves as a body away from the wharf with no systematic deformation in the north-south direction.
"
-:z I W ? ~3 c E I E Z t 3 The progressive increase in the lengths of the arrows
corresponds to horizontal growth of an active zone of ice adjacent to the wharf. The active zone is defined as
I the transition from the fixed ice foot and wharf to the
I I
1 --,--- -4- free-floating ice cover. A significant east-west ex-
,
,... -- tension was measured between the C-line and the
E l -line during the period from December to February. In this area a crack was observed extending approxi- mately north-northeast from the centre cell.
The north-south movement of line #4 (50 m north
ICE F O O T
N of whafi relative to its position on December 18, 1979,
t
- - - C R A C K S is plotted in Fig. 3. The progressive movement of theR I D G E ( H I N G E ) ice cover away from the wharf is readily apparent. The
o
-
1 0 20 ... M I N O R R I D G E movement reflects, at least in a qualitative sense, theSCALE, m ////// A C T I V E Z O N E shape of the active zone. Growth of the active zone
M M I S S I N G D A T A directly in front of the wharf apparently causes the
horizontal distortion of the adjacent ice cover. FIG. 3. North-south movement of #4 line with respect to An overview of the ice around the wharf on March wharf and hinge and crack pattern, March 1980. 26, 1980, is shown in the composite photograph in
lo00 CAN. J. CIV. ENG VOL. 1 1 . 1984
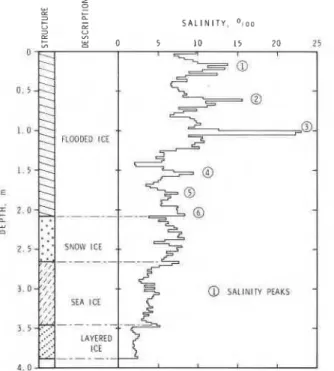
FIG. 7 . Salinity and structure of core in active zone adja-
cent to the west cell, March 26, 1980.
March, the thickness of the first-year sea ice had increased to 1.45 m.
To collect information on vertical ice growth and temperature in the active zone, a thermistor chain was installed adjacent to the centre cell in February (see Fig. I for location). Ice thickness at the time of instal- lation was 1.72 m. A temperature profile measured on February 14 is plotted in Fig. 6 and displays a linear gradient from the ice surface temperature to the sea water temperature of - 1.8"C at the bottom surface of the ice. On March 26, when temperatures were again measured, direct observation indicated that 0.4 m of ice had accumulated on the surface of the active zone at this location. Linear extrapolation of the temperature profile measured on March 26 to a depth corresponding to - 1.8"C implied that about 0.5 m of ice had been added to the bottom of the active zone, so that total thickness had increased to about 2.6 m.
On May 14 the average thickness of the level ice was 1.55 m, little changed from the March 26 thickness. Along line C a thickness of 2.9 m was measured at point C#2. A marker placed in the active zone in front of the centre cell on March 26 indicated that 0.7 m of ice had accumulated on the surface by May. The June I 1 thickness measurements were 1.6 m at point C#4 and greater than 4.5 m at point C#2.
Ice core analysis
During the March field trip, firsthand observations of
D l P A N G L E , d e g r e e
- 1 0 0 10 20 30 40
0
FIG. 8 . Variation of dip angle with depth of layers in
flooded ice of core taken from active zone in front of west
I
cell.
ice processes around the wharf were made, with a view to formulating an hypothesis for the formation of the active zone. This work focussed on measuring tilt of the active zone, nature of motions across cracks, and recovery of a core for detailed analysis.
On March 26 a 3.88 m long ice core was taken from the active zone 6.5 m in front of the west cell along the W2 line. The core was drilled normal to the ice surface. Care was taken to mark the core so its original orien- tation in the horizontal plane was fixed with respect to the cell. Part of the core was used for salinity and density measurements. Thin section analysis was carried out on the remainder of the core. The salinity profile, together with a description of ice types in the core, is presented in Fig. 7. The top 2 m was surface- flooded ice of relatively high salinity, then a section of snow ice, followed by columnar-grained sea ice, and finally a section of layered ice. These descriptions were based on an examination of vertical thin sections of the entire core (Frederking and Nakawo 1983). The average density of the core was 865 kg/m7.
Close examination of the salinity variations in the flooded ice suggests there were six periodic variations (peaks designated by circled numbers). Because the core was taken a few days after the minimum tide range, the high salinity peaks may correspond to high tide ranges, which occur on a 2 week cycle. Each of the top three cycles corresponds to a 0.5 m increase in ice thickness and the lower three, to an approximately 0.3 m increase. The sea ice layer (0.8 m thick) has a salinity variation commonly seen in first-year sea ice. Finally, the layered ice at the bottom of the core had an unusually low salinity.
NOTES 1001 D I S T A N C E F R O M W H A R F , rn CURL-UP I CORE 0 W H A R F ( W E S T C E L L ) F 2 E 4 E a u a _e SEA LEVEL 6 lllll F I R S T YEAR ICE ACTIVE ZONE 8 I TILT STAKE
FIG. 9. Ice thickness profile along line W2, high tide
( 1 loo), March 28, 1980.
The extreme left-hand side of Fig. 7 schematically depicts the structure of the ice. Because the core was originally oriented in the horizontal plane, it was possi- ble to accurately determine the slopes of the ice layers in the flooded zone with respect to the cell. Slopes varied from 0" at the surface to 20" at a depth of 2 m, sloping down towards the cell. The dip angle versus depth is plotted in Fig. 8. This variation in slope suggests a progressive rotation of the active zone with time.
Profile of active zone at west cell
During the March field visit the thickness of the active zone adjacent to the west cell (along line W2) was measured in detail. The profile is plotted in Fig. 9. At this location the active zone is 10 m wide and aver- ages 4 m thick, about 2.5 times the thickness of first- year ice. This is similar to conditions earlier in the winter and also in previous winters. Slope angles of the ice surface were measured at two locations along the W2 line, one on the active zone and another on the first-year ice (see Fig. 9 for locations). The measured behaviour was similar to observations made in the winter of 1978- 1979 (Frederking 1980), i.e., for a tide change of 1.5 m, the slope of the active zone changed 6.5".
Model of active zone formation
Observations made at the wharf over previous win- ters have identified a recurrent pattern of ice conditions. Shortly after freeze-up an ice 'bustle' begins to form on the vertical face of the cells. Sea water freezes and adheres in layers to the sheet piles between the high and low tide levels, forming a parabolic-shaped protu- berance. This feature may extend a metre out from the cell by mid-November. Between the level first-year ice and the bustle is a zone about 2 m wide which is subject to some surface flooding and is marginally thicker than
0
-
5S C A L E , m
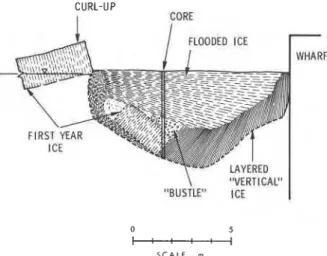
FIG. 10. Conjectured structure of active zone, March
1980.
the first-year ice. By the February-March period, the active zone has evolved to about 2.5 times the thickness of the level ice and about 10 m wide (Fig. 9). The bustle is no longer present and is most likely incorporated in the active zone. The first-year ice is curved up where it reacts with the active zone. This pattern continues until the ice begins to melt in the May-June period.
The probable composition of the active zone in March, based on measurements and analysis, is illus- trated in Fig. 10. The central core and originating piece of the active zone is the section of first-year ice broken off the adjacent ice cover. The snow ice section could
be the part of the bustle that fell off the cell onto the adjacent first-year ice. As this combination of ice re- sponded to tidal motion, it would come into contact with the sheet piles of the cell on one side and the first-year ice o n the other. Each tidal cycle would de- posit a layer of ice on the top surface and on the vertical surface adjacent to the cell. The ice on the vertical surface of the active zone ('vertical' layered ice) would be pressed against the cell and compressed, picking up dirt or rust on the cell. From the thin sections of the lower part of the core, the spacing of these layers was about 2 cm. The active zone expanded in width by 3.0 m in a 90 day period from December to March, for an average rate of 1.8 cm/tidal cycle (Fig. 5). There- fore, the horizontal growth rate of the active zone and the observed layer thickness in the vertical layered ice at the bottom of the core are in approximate agreement. At the same time vertical layered ice was being formed, successive flooding of the ice surface at high tide would build up layers of surface ice. The thickness of these surface layers is about 4 cm near the top of the core. In the 2 week period between maximum tides (26 tidal cycles) a 1.0 m accumulation of ice would be expected; however, the observed buildup was half this
1002 CAN. J. CIV. EN( 3. VOL. 1 1 . 1984
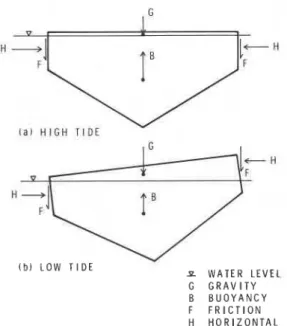
+BH
cal H I G H T I D L I V Y 1 I U L n W A T E R L E V E L G G R A V I T Y B B U O Y A N C Y F F R I C T I O N H H O R I Z O N T A LFIG. 1 I . Schematic of forces acting on active zone. amount. When the tide range is small, there may be no surface flooding at all. During the March 1980 field trip, the tidal range was 1.5 m and no surface flooding of the active zone was observed; however, during previous visits, when the tidal range was 2-2.5 m, flooding was observed. Thus the measured layer spacing and ice buildup over a 2 week period would be consistent with flooding during half the tidal cycles, i.e., those cycles having higher tide ranges. At the lower part of the flooded ice zone, the layer spacing is about 2.5 cm, which is consistent with the observed buildup of 0.3 m for a 2-week tidal period, assuming flooding occurs for half the tidal cycles. The pro- gressive change in slope of ice layers in the flooded zone (as shown in Fig. 8) would imply a long-term rotation of the active zone. This implies a 20" rotation at the west cell over 3 months in the winter of 1979- 1980. Observations of stakes placed in the active zone in a subsequent winter confirmed that such a rotation is common to the active zone of all the cells. The turn-up of the first-year ice edge is also consistent with such a rotation. The composition of the active zone reflects the sequence of events proposed for its formation.
Ice force estimates
From considerations of buoyancy and the movement of the active zone during a tidal cycle, it is possible to estimate ice loads generated on the wharf. The active zone is assumed to have the simplified form shown in Fig. 11. As the tide rises and falls, this piece of ice rotates and translates in a complex fashion. The ef- fective width of the active zone can increase or decrease
TABLE 1. Parameters used in calculating ice forces
A , A h G B F H
(mZ) (mZ) (kN) (kN) (kN) (kN) High tide 1.5 33.5 13 54 21 69 Low tide 7.2 27.8 61 45 8 27
NOTE: p, = 865 kg/m3, p, = 1030 kg/m3, g = 9.8 m/s', p =
0.3. Active zone dimensions (Fig. I I): breadth = 10 m, thickness
(centre) = 5 m, thickness (edges) = 2 m.
with these motions. Freezing of ice on the vertical face of the active zone also increases its effective width, pushing the adjacent level ice away from the wharf. Because of these horizontal forces with associated fric- tion forces, the active zone is not always in hydrostatic equilibrium. It moves up and down in an intermittent fashion as a result of 'stick-slip' behaviour at the ice-cell interface. It is possible to estimate friction forces and corresponding horizontal ice forces from a consideration of hydrostatic disequilibrium of the active zone.
The calculation procedure is based on analyzing the gravity (G), buoyancy (B), and friction ( F ) forces acting on a 1 m thick vertical slice of the active zone (Fig. 11). The sum of these forces, all acting vertically, is zero for equilibrium:
It is assumed that the friction force at each end of the
zone is the same. The gravity force is given by
I
where A, is the area of active zone above the waterline,pi is the density of the ice, and g is gravitational accel- eration. The buoyancy force is given by
131 B = Ab(pw
-
pi)gwhere A b is the area of active zone below the waterline,
p, is the density of sea water, and pi and g are as defined. Friction force is calculated from [ I ] . From the friction force, the horizontal force, H, can be calculated from the following equation:
where p is the coefficient of friction. A value of p =
0.3 was taken as an appropriate value of ice on rusty steel (Schwarz and Weeks 1977). For the geometry illustrated in Fig. 1 1 , the values of variables used to calculate horizontal force at high tide and low tide are given in Table 1. Values for A, and A b at high and low tide were based on observations of freeboard and tilt made in March. Assuming this load is transferred into a level ice cover 1 m thick, average pressures of 69 and 27 kPa are obtained at high and low tide respectively.
NOTES 1003
These are substantially lower than a value of 150 kPa calculated from the average creep rate in the ice cover (Frederking 1980).
Conclusions
A proposed model describes the formation of the active zone, through the action of tidal cycling. Flood- ing and freezing on the top surface and edges of the active zone result in vertical and horizontal growth. The thickness of the active zone is about 2.5 times that of first-year ice; however, this factor is most likely con- trolled by tidal range and time. Horizontal growth of the active zone thrusts the adjacent ice cover away from the wharf and in turn generates horizontal loads on the wharf. An indirect method of calculating ice forces has been proposed; however, the predicted pressures are quite low and subject to some doubt. Direct mea- surement of ice forces, while more complex and costly, is the preferred approach.
Acknowledgements
The authors would like to acknowledge the thorough measurements made under difficult conditions by H. A. R. Steltner, S. Koonark, M. Komangapik, and E. Pewatoalook of the Arctic Research Establishment, Pond Inlet. They would also like to express their appre- ciation to D. Wright, Technical Officer, Division of Building Research, National Research Council Canada, for technical support. Financial support by the Depart- ment of Indian and Northern Affairs in the form of a contract for part of the work carried out by the Arctic
Research Establishment is also acknowledged with thanks. This paper is a contribution of the Division of Building Research, National Research Council Canada, and is published with the approval of the Director of the Division.
FREDERKING, R. M. W. 1980. Ice action on Nanisivik wharf, Strathcona Sound, N.W.T., winter 1978- 1979. Canadian Journal of Civil Engineering, 7(3), pp. 558-563. FREDERKING, R., and NAKAWO, M. 1983. Ice interactions
with Nanisivik Wharf, winter 1979-1980. Proceedings, 6th Canadian Hydrotechnical Conference, Ottawa, Ont., June 2-3, 1983, Vol. 1, pp. 523-541.
FREDERKING, R., and SINHA, N. K . 1978. Ice action on wharf at Strathcona Sound. Proceedings, 4th International Conference on Port and Ocean Engineering under Arctic Conditions (POAC '77), St. John's, Nfld., Vol. 2, pp. 707-717.
GIRGRAH, M . , and SHAH, V . K . 1978. Construction of a deep-sea dock in the Arctic. Proceedings, 4th International Conference on Port and Ocean Engineering under Arctic Conditions (POAC '77). St. John's, Nfld., Vol. 1, pp. 370-381.
NAKAWO, M., and S I N H A , N. K. 1981. Growth rate and salinity profile of first-year sea ice in the high Arctic. Journal of Glaciology, 27(96), pp. 3 15 -330.
SCHWARZ, J., and WEEKS, W. F. 1977. Engineering properties of sea ice. Journal of Glaciology, 19(81), pp. 499-532.
STELTNER, H. A. R. 1980. Ice observations and measure- ments at Nanisivik Marine Terminal, Strathcona Sound, 1979-80. Arctic Research Establishment report to Divi- sion of Building Research, National Research Council of Canada, contracts 079-068 9-4438 and OTT-80-001.