Publisher’s version / Version de l'éditeur:
Lighting Research and Technology, 20, 4, pp. 155-160, 1988
READ THESE TERMS AND CONDITIONS CAREFULLY BEFORE USING THIS WEBSITE.
https://nrc-publications.canada.ca/eng/copyright
Vous avez des questions? Nous pouvons vous aider. Pour communiquer directement avec un auteur, consultez la première page de la revue dans laquelle son article a été publié afin de trouver ses coordonnées. Si vous n’arrivez pas à les repérer, communiquez avec nous à [email protected].
Questions? Contact the NRC Publications Archive team at
[email protected]. If you wish to email the authors directly, please see the first page of the publication for their contact information.
NRC Publications Archive
Archives des publications du CNRC
This publication could be one of several versions: author’s original, accepted manuscript or the publisher’s version. / La version de cette publication peut être l’une des suivantes : la version prépublication de l’auteur, la version acceptée du manuscrit ou la version de l’éditeur.
Access and use of this website and the material on it are subject to the Terms and Conditions set forth at
Exit signs in smoke : design parameters for greater visibility
Ouellette, M. J.
https://publications-cnrc.canada.ca/fra/droits
L’accès à ce site Web et l’utilisation de son contenu sont assujettis aux conditions présentées dans le site
LISEZ CES CONDITIONS ATTENTIVEMENT AVANT D’UTILISER CE SITE WEB.
NRC Publications Record / Notice d'Archives des publications de CNRC:
https://nrc-publications.canada.ca/eng/view/object/?id=2efcf905-20c3-4cb3-a8a2-571125fd0dcb https://publications-cnrc.canada.ca/fra/voir/objet/?id=2efcf905-20c3-4cb3-a8a2-571125fd0dcbRef
I
S e r
TH1
National Research Conseil national
N 2 1 d
1
+
1
Council
Canada
de
recherches
Canada
Institute for
lnstitut de
Research in
recherche en
Construction
construction
Exit Signs in Smoke: Design
Parameters for Greater Visibility
by M.J. Ouellette
A N A L Y Z E D
Reprinted from
Lighting Research and Technology
Vol. 20, No. 4,1988
p. 155-160
(IRC Paper No. 1719)
Lighmg Rer. Technol. 2q4) 155-160 (1988) Printed in Great Britain
Summary A review of regulations and spechcations for internally illuminated exit signs recommended or enforced by various sanctioning bodies in Canada, Great Britain and elsewhere reveals omissions and inconsistencies which may compromise the safety of building occupants in smoke. Since these problems are panly due to lack of conclusive research, a controlled psychophysical experiment was conducted to assess the readability of three common exit sign design features (i.e. the various combinations of opaque and transilluminated text and
backgrounds) under different levels of smoke density and ambient illumination. The sign designs differed greatly in terms of threshold illuminunce at the rear of the signs (analogous to the intensity of the sign's light source), but all were similar in terms of the threshold luminance of the sign's front panel. Based on these findings, recommendations are made for improved building codes.
Exit signs in smoke: Design parameters for greater visibility
MICHAEL J OUELLETTE BSc
National Research Council of Canada, Institute for Research in Construction, Ottawa, Ontario, Canada KIA OR6
Received 26 April 1988, in final form 20 September 19881.
1 Introduction
As technologies advance, so do expectations of the assured maintenance of building services and commodities. For example, the supply oflight and adequate ventilation in public buildings is largely taken for granted, regardless of the possibility of interruptions. It is also assumed that in the unlikely event of a failure sufficient safeguards have been incorporated to ensure occupant safety. In Great Britain the British Standards Institution (BSI) provides recommen- dations for the design, construction and illumination of exit signs. It is generally assumed that adherence to the recommendations will ensure highly visible exit signs which convey sufficient information to guide occupants safely out- doors in the event of a fire or other emergency. The assump- tion, unfortunately, is not necessarily valid.
For many years brightly coloured signals and signs have been considered to be more conspicuous than dimmer ones"). The BSI, however, restricts sign luminance to 80 cd m-' or less"). In Canada there are no specifications for sign luminance(3) although some agencie~(~1~) attempt to specify sign luminance indirectly in terms of the electrical power consumption of the sign. The National Fire Protection A~sociation'~) of the United States is quite restrictive. It recommends luminances ranging between 6.9 and 10.3 cd m-' (2 and 3 fl), depending upon the nature of the sign. For certain signs (those having both letters and background trans-illuminated), the Stan- dards Association of Australia'') specifies a minimum lumin- ance of 8 cd m-', with no imposed maximum limit. Other types of sign (trans-illuminated letters with opaque back- ground) are subject to a minimum of 2 cd m-' and a maxi- mum of 25 cd m-'. Technical foundations, if any, for these diverse requirements do not accompany the published standards.
t
The paper is a revised version of one presented to the 1988 National Lighting Conference, Cambridge, UK.$ This report is available from the National Research Council, Inst. for Research in Construction, Publications Section, Bldg. M-20, Montreal Rd., Ottawa, Canada KIA 0R6. Summaries are also available from other
s0UTCe5(IC16).
The wide range of sign design requirements demonstrates a lack of conclusive research in parameters affecting exit sign visibility, especially for conditions in which exit signs are perhaps needed the most, i.e. when visibility is reduced by smoke. Smoke can severely alter the appearance of objects by both light attenuation and scatter. There have been several attempting to quantify the visibility of particular signs in smoke. These studies cannot, however, provide functional relationships between visibility and any design parameter because:
-
the visual attributes of the signs were not studied systematically;-
visibility was affected by uncontrolled factors such as size, brightness uniformity, colour and the use of down- lighting apertures in the bottom of some signs; or-
the light scattering properties of smoke were notadequately simulated.
One study(L3) identified several factors that likely affected sign visibility in smoke*. One of these was ambient illurni- nation (room lighting) which creates a luminous veil in smoke between the observer and the exit sign, much as 'high beam' automobile lights in fog may obscure the view of the road. As by Jin's theoretical model(12), this veil reduces sign visibility by reducing the contrast of the letters against their background. Signs with trans-illuminated letters and opaque backgrounds (arbitrarily called type A) appeared to perform better in smoke than signs with trans-illuminated back- grounds and opaque letters (type B) or those with both trans- illuminated backgrounds and letters (type C). As with sign brightness, this factor was not varied parametrically. The researchers speculated, however, that signs with large lumi- nous areas (type C) may create a veil in smoke which reduces their own visibility as does ambient illumination (though probably to a lesser degree).
The objective of this study was to delineate more clearly the visibility of each of the three types of exit sign (types A, B and C) in smoke, both in darkness and in simulated emergency lighting. Other variables which could also influence sign visibility were not studied (e.g. font type, intercharacter spacing, colour, luminance uniformity, adaptation level,
0
1988 The Chartered Institution of Building Services EngiMichael J Ouellette
size, viewing distance, and state of flashing). By keeping these variables constant for all experimental conditions, it was possible to attribute observed differences in visibility to the particular aspects of the signs being studied (i.e. the various combinations of opaque and trans-illuminated text and background). It is anticipated that results from this controlled investigation could be extended to a variety of other situations* including those more typical of current practice in the UK.
be required to suppo the many variables
believed that the results reduce the uncertainty about certain exit sign design features which differentially influenced sign visibility in smoke.
2 Experimentation 2.1 ovmerulew
Human subjects viewed, through a smoke-filled cavity, three types of exit sign at low and high levels of smoke density, with and without ambient illumination. At every com- bination of these independently manipulated variables, every subject adjusted the brightness of the signs to the threshold criterion of 'just readable'. The experimenter then deter- mined two indicators
rear of the sign and
2.2 Smoke cavity
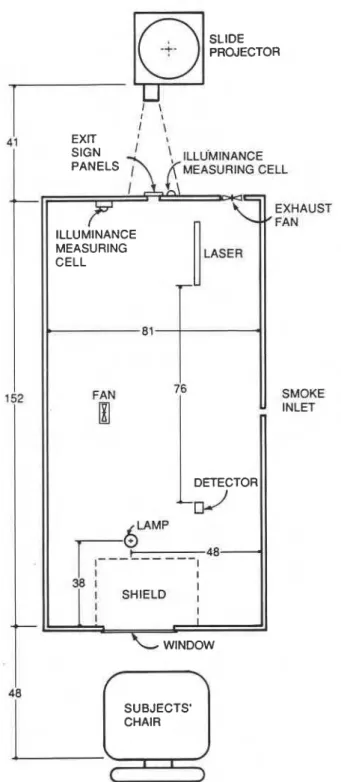
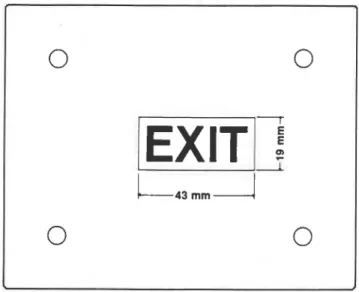
The smoke cavity (Figure 1) was a galvanised steel cylinder 1.52 m in length and 0.8 13 m in diameter. The ends were sealed with plywood and caulking. Exit signs were mounted over a rectangular aperture (43 x 19 mrn) at one end, and a clear acrylic window (optical transmittance = 0.94) was installed at the other end to view the signs through smoke. Smoke was introduced through another aperture in the cylinder and could be exhausted to the outdoors through a port equipped with a fan and duct pipe. The smoke cavity contained:
-
smoke density measuring equipment,-
a small fan to maintain smoke homogeneity,-
an incandescent lamp to simulate low level emergency lighting, and-
a shield to prevent views of the incandescent lamp and laser beam used to measure smoke density.2.3 Exit signs
As discussed, earlier studies have not determined the influ- were uncontrolled. The signs in the present experiment were identical in all respects except for the features being tested ence of specific design types because other influencing effects
Figurr Plan view of experimental set-up. All distances are in cm.
(Table 1). Any observed differences in visibility can therefore the subjects- viewing distance. hi^ angular size exceeds the be attributed to differences in the controlled design features. minimum recommendation of the ~ ~ i t i ~ h standards ti- The signs were miniature reproductions of some currently tutiod2) (0.24" with 75 mm letter height at 18 m viewing used in Canada. They consisted of 102 x 127 x 3 mm acrylic distance or 0.20" with 125 letters at 36 m).
panels (Table 2, Figure 2) with letters 0.36" high at 2.0 m,
Table 1 Features of signs under test .
$ For example, if red signs with opaque backgrounds (type A) required
sigruficantly brighter light sources than red signs with white trans- Sign type L c W s Background illuminated backgrounds (type C) then it would be reasonable to conclude
that green type A signs would require brighter sources than green type C A Red transilluminated Opaque
signs. Similarly, the observed relationship between visibilities of the various B O ~ a q u e Red transilluminated textlbackground configurations would also be expected to apply for
c
Red transilluminated White transilluminated observers at stages of adaptation different from the one studied here.Figure 2 The exit sign panels used in the experiment. The region outside the 19 x 43 mm boundary was not seen by subjects. The three sign types were the same except in terms of the colour and transmittance of the text and background fields (Table 2).
Table 2 Description of signs
Sign Transmittance (nominal colour) Tcxt Background A 0.0273 0.0000 (Red) (Black) B 0.0000 0.0417 (Black) (Red) C 0.0417 0.21% (Red) (White)
2.4 Illumination of exit signs
A Kodak Carousel slide projector, positioned behind the smoke cavity, illuminated the back of the exit sign panels. The slide tray contained 40 different neutral density filters (Kodak, Wratten no. 96) installed in 35 mm slide mounts. The subjects could vary the brightness of the signs by selecting slides with a remote control. Fine adjustments were made by changing lamp voltage with a variable auto- transformer constrained to variations between 100 and 115 V. Using the two adjustment methods, illumination on the back of the sign could rangt from 0.6 to 19000 lx, giving sign luminances as high as 5 200 cd m-*. Uniformity of illumination varied by no more than 4% over the visible surface of the exit signs.
Illumination on the back of each sign was monitored by an illuminance cell near the exit sign. Prior calibrations have shown that readings, Imf, at this location were lower than those at the centre of the exit signs by a factor of 0.54. Illuminance at the centre rear of the signs, I,, is therefore Imf/0.54. Threshold sign illuminance, I,, is the value of Is when the sign is just readable, and is reported in lx.
§ Coloured 6lters differ greatly in transmittance. Luminance readings without the filters do not represent luminance.
Exit signs in smoke
It was possible to relate readings of Imf to smoke-free exit sign luminance, L,, using earlier calibrations with a Pritchard model 1980A photometer placed at the position of the subjects' eyes, in front of the window of the evacuated smoke cavity. Threshold sign luminance L, is the value of
L,
at threshold readability and is reported in cd m-2. Both L, andI, were used in statistical analyses. Luminance measurements were always in terms of the brightest of the text and back- ground fields. They were obtained in accordance with BS2560(2), except that the coloured filter was always in places. There were no problems regarding the application of various luminance sampling techniques since all points within each of the text and background fields had nearly equal luminance.
2.5 Smoke generation and measurement
Smoke was provided by a portable oil smoke generator (Les Enterprises MDG Inc., Quebec, Quebec, Canada, model 3020). The device sprayed mineral oil on a heated element, producing nominally white smoke as the oil vaporised. The experimenter operated a valve which, when opened, caused compressed carbon dioxide gas to force smoke into the cavity.
Following Clark(''), smoke density was measured in terms of the attenuation of the intensity of a 632.8 nm He/Ne laser beam, measured across a 0.76m path inside the smoke cavity, and reported in terms of optical density per meter of path length (OD m-'). Laser intensity was measured with a silicon diode photodetector (Silicon Detector Corp., New- bury Park, CAY USA, model SD-444-12-12-171). The detec- tor was spectrally 'tuned' to the laser by an w-blocking bandpass filter (peak at 632.8 nm, with 5 nm width at half height). The detector was shielded from stray radiation by an opaque tube that blocked all radiation outside a 14" solid angle normal to the detector surface. Thus the detector responded exclusively to the laser and not to ambient illumi- nation from the incandescent source also in the smoke cavity. Voltage readings from the detector were related to optical density by a calibration procedure involving neutral filters (Schott Optical Glass Inc.) of known density inserted in the path of the laser beam in the absence of smoke.
2.6 Ambient lighting inside smoke cavity
Ambient lighting inside the smoke cavity was provided by a .single 10 W incandescent lamp on the floor of the smoke cavity. The lamp was powered by a llOV variable auto- transformer adjusted to provide (in the absence of smoke) 0.55 Ix vertical illuminance on the front surface of the exit signs. This roughly simulates the vertical illuminance on an exit sign under emergency lighting situations. Interior illumination was continuously monitored by an illuminance meter with a remote measuring cell secured near the exit sign aperture inside the smoke cavity.
2.7 Expenenmental design
Data collection was organised by a repeated measures exper- imental design. The independent variables included two levels of smoke density (0.5 and 1.5 O D ~ - ' ) , three sign types (types A, B and C), and two states of ambient illumi- nation inside the smoke cavity (0.0 and 0.55 Ix), giving twelve different treatments. All subjects had every treatment condition once. All performed three consecutive psycho- physical measurements at every treatment condition. To control session effects, the treatment conditions were pre- sented in counterbalanced order across subjects. Every sub- Vol. 20 No. 4 (1988)
ject performed all 36 measurements in about one hour, with no obvious effects of fatigue.
2.8 Subjects
Twelve unpaid volunteers participated. They ranged in age from 22 to 48 years (median = 31 y). All were aware of the purpose of the experiment, but none were informed of the particular factors affecting the visibility of exit signs in smoke. Five subjects had previous experience making threshold visibility measurements.
The eyesight of every observer was assessed with a battery of visual screening tests from a Keystone Ophthamic Telebinocular. Only colour-normal subjects with normal or better visual acuity in at least one eye were accepted. Subjects with prescribed corrective lenses wore them during assess- ment and data collection.
2.9 Procedure
For simplicity, the experimental procedure for every subject is outlined in point form.
1 All equipment was turned on, checked, and warmed up for at least one hour. The smoke density measuring apparatus was calibrated and the illuminance meters were 'zeroed'.
2 The subject underwent visual screening, then was seated facing the window of the smoke cavity, 2 m from the exit signfl.
3 The subject was given oral instructions, then dark adapted for at least 10 min before testing.
4 A condition of smoke density, sign type, and ambient illumination was established by the experimenter. 5 The subject adjusted the brightness of the exit sign until
it was 'just readable'. Meanwhile, the experimenter continuously monitored smoke density, making nec- essary adjustments.
6 After the subject completed the threshold adjustment, the experimenter recorded Id, from which values of I,
and L, were later determined.
7 The experimenter unsystematically changed the sign brightness by rotating the slide carousel and changing each subject's fine dimming control.
8 The subject provided two more threshold deter- minations (steps 5 to 7).
9 All combinations of sign type and ambient lighting were presented at a smoke density between the two experimental treatment levels. Threshold measure- ments from these practice trials were not considered in later data analyses. The purpose of the trials was simply to acquaint the subject with the stimuli and exper- imental procedure.
10 Steps 4 to 8 were repeated for all treatments.
) Head positions were not resuained by any device, but subjects were requested not to lean forward while making threshold determinations. The viewing distance of 2 m is suf6ciently large that small natural changes in posture would not greatly alter the apparent size of the exit signs.
11 Such transforms were used to improve the normality of the I, and L, frequency distributions. All statistical tests using the logarithmic transforms were repeated with the untransformed data. Although lack of normality decreased the sensitivity of the latter tests, the two gave similar results.
11 The subject was dismissed, the smoke was exhausted, and all optical media in contact with the smoke were cleaned.
3 Results and discussion
Both I , and L, were transformed l~~arithmicallyll and used as dependent variables in separate analyses of variance. Smoke density D, sign type T, and ambient illumination L
were treated as fixed variables. Each subject S was treated a
as a random variable, and replication of measurements R was treated as a random variable crossed with all others. For both dependent variables logld, and log1&,, all main effects and all interactions were significant at the p < 0.01 level, with the following exceptions: DL (p < 0.02), TL
1
(p < 0.12), and DTL (p < 0.30). Most of these are discussed below. The significances of the latter two interactions, how- ever, were insufficient to warrant further discussion. Since subjects were treated as a random variable, interactions involving subjects are not discussed.
A Tukey test of multiple comparisons(18) identified those conditions and combinations of conditions which differed sigdcantly (p < 0.01) from each other. These are shown in Table 3.
3.1 Smoke density
Smoke density was the variable most strongly affecting the threshold readability of exit signs. On average, the quantity of back illumination on the exit signs had to be increased by about 1.7 log units (a factor of 50) to compensate for a log unit increase (a factor of 10) in the amount of smoke. A similar relation was observed for the minimum required luminance of exit signs. This is consistent with earlier reports proposing that bright signs are more visible in smoke than dim ones(I3-16). In fact, frompost hoc observations, any of the three signs obscured by smoke could be rendered readable simply by increasing its luminance to values exceeding the
maximum specifications of BS2560. It is therefore quite possible, and foreseeable, that signs meeting existing mini- mum brightness specifications (and even maximum speci-
Table 3 Averaged logarithmic threshold sign illuminance and luminance for the 12 treatments. A Tukey'") t a t reveals that any two values of a dependent variable that differ by less than 0.055 are not signhcantly different ( p < 0.01). Those pairs of means not differing by this criterion are denoted by like symbols (#, &).
Smoke Ambient
density Sign Uumin.
(OD m-I) type
(W
log~d, logl&t0.5 A 0.0 0.899# -1.109
0.5 A 0.5 1.093 -0.915
Exit signs in smoke
A B C
SlGN TYPE
A B C
SlGN TYPE
Figure 3 (a) Threshold sign illuminance and (b) threshold sign luminance for the three types of exit sign (A, B and C). Each bar represents the average of the common logarithm of 144 measurements (12 subjects X 2 smoke densities x 2 states of ambient illumination x 3 repeated measures).
fications) for smoke-free conditions will not be visible in densities of smoke (0.5 to 1.5 OD m-') easily achieved in fires(19).
3.2 Ambient illumination
Ambient illumination also affected threshold readability. On average, the quantity of back illumination on the exit signs had to be increased by about 0.2 log units (a factor of 1.6) to compensate for the effect of increased ambient illumination from zero to 0.55 1x (vertical on face of signs). Similar increases in sign luminance were also required.
These results support the conclusions of Rea, Clark, and Ouellette that ambient illumination as low as 0.55 Ix reduces sign visibility in ~rnoke"~-'~]. It is rcasonab1e to propose, therefore, that lighting along lines of sight to exit signs should be reduced whenever smoke is detected. This may
be a relatively simple, but not necessarily inexpensive, task for buildings operating on automated conml systems. If this is not practical, the task might be performed manually by designated personnel in the building, as should the Closing of doors and windows. Of course, separate and accessible switches would be required for controlling the potentially problematic luminaires. However handled, it is probable that buildings adopting such strategies will have more read- able exit signs in smoke. Buildings without such strategies should therefore require even brighter exit signs to com- pensate for the luminous veils created by uncontrolled ambi- ent lighting.
3.3 Sign type
On the criterion of threshold illuminance, the signs differed greatly (Figure 3(a)). Their rank ordering in terms of I, was A > B
>
C. On average, I, had to be about 0.7 log units greater (a factor of 5) for sign A than for sign C. Thus, for signs at threshold readability, type C signs will tend to be about five times more energy efficient. These distinctions are not recognised in some code^''^) which specify exit signs4
in terms of the wattage of the internal light source. By specifying wattage, signs which just meet the minimum requirements of these codes will consume nearly the same energy but will not necessarily be equally readable. On the criterion of threshold luminance, the signs were approximately the same (Figure 3(b)), differing by no more
than 0.27 log units (a factor of about 2). When expressed in
terms of L,, there is less need to distinguish between different design types, as do some regulatory agencies@>'). Signs meet- ing the minimum requirements of codes expressed in this manner will have approximately the same threshold read- ability but will not necessarily consume the same energy. Although there were only small differences in L, for the three signs studied, it should be' realised that some differences were nevertheless statistically significant (Table 3). On average, signs with white transilluminated backgrounds (type C) required greater luminance than those with darker back- grounds (types A and B). This is consistent with the sup- po~ition('~-'~) that signs with transilluminated backgrounds generate more luminous veil in smoke, thus reducing their own readability. The effect is relatively small, but other features of signs may produce larger effects (e.g. down- lighting apertures designed to illuminate the exit route(I3)). Although not studied in this experiment, it is reasonable to suppose that the illumination produced by such signs would be sufficient to decrease readability in smoke.
3.4 Interaction between ambient illumination and smoke density Turning off the ambient illumination improves sign read- ability in terms of both I, and L,. The effect was slightly stronger, however, at high smoke density. This interaction (p < 0.02), though not significant at the p < 0.01 criterion, merits discussion. The interaction becomes apparent when comparing the slopes of the lines in the top halves of Figure 4(a) and (b) with the slopes of those in the bottom halves. This may be explained by considering that ambient illurni- nation reduces sign visibility by creating a luminous veil scattered from particles of smoke. The magnitude of this veil is expected to increase when either the quantity of airborne smoke particles increases or the level of ambient illumination increases. Thus, at high smoke density the ambient illumination more effectively produces a luminous veil, which in turn more effectively reduces the readability of the signs.
3.5 Interaction bemeen sign type and smoke density
There was a significant (p < 0.01) interaction between sign
type and smoke density. The threshold readability of sign
-
31
LOW SMOKE DENSITY1
,?HlGH SMOKE DENSITY
0
- -sI
-ON OFF ON
AMBENT ILLUMINATION AMBIENT ILLUMINATION
F i4 (a) Threshold sign illuminance I,, and (b) threshold sign luminance L,, for the three types of exit sign (A, B and C ) at all combinations of smoke density and ambient illumination. Each point represents the average of the common logarithm of 36 measurements (12 subjects x 3 repeated measures).
Michael J Ouelhtte
C was slightly less affected than the other signs by changes in smoke density. On average, when smoke density was raised from 0.5 to 1.5 OD m-', I, and L, increased by about 1.7 log units (a factor of 50) for signs A and B, whereas I, and L, increased by only 1.5 log units (a factor of about 30) for sign C. The effect is small and requires further study for adequate explanation.
4 Recommendations
-
Building code guidelines should consider exit sign visi- bility in smoke specifically.-
Limitations on maximum sign luminance should be reconsidered since there is no evidence that sign read- ability in smoke is reduced at luminances exceeding the maximum limit of BSZS60(*).-
To improve the visibility of exit signs, room lighting along all lines of sight to exit signs should be reduced as much as possible whenever smoke is present.-
Exit signs should be specified in terms of their lumin-ance (e.g. BSI")). Specification of the light source alone('5) is less germane to sign readability.
-
When specifying exit signs in terms of their luminance, there is little need to distinguish between sign types A, B and C.-
The coloured filter should not be removed from the sign during photometry, as required by BS2S60(2). Luminance readings without filters are less indicative of sign readability.5 Conclusions
Smoke density and ambient illumination strongly influence the visibility of three types of internally lighted exit signs. The three sign designs differed greatly in terms of threshold
illuminance at the rear of the signs (analogous to intensity of
the sign's light source), but all were similar in terms of threshold luminance. Based on these findings, recom- mendations are made for improved building codes and, it is hoped, safer buildings.
Acknowledgements
Thanks are extended to L Mulvihill, H Jabbour and K Nadon for assistance in constructing the exit signs, and to Drs M S Rea and R Dillon for assistance in planning this study and commenting on earlier drafts. This report is based
upon an undergraduate thesis submitted in September of
1987 to Carleton University, Department of Integrated Sciences, Ottawa, Canada. The support of Dr G Carmody, Chairman of the Department of Integrated Sciences, is appreciated.
References
Luckiesh M and Moss F K The Science of Seeing p 436 (New York: Van Nostrand) (1937)
BS2560:1978 Specfiation for Exit Signs (internally illuminated) (Milton
Keynes: British Standards Institution) (1978)
National Research Council of Canada National Building Code of
Canada 1985 NRCC 23174 Sections 3.4.6 and 9.9.10 (1985)
Canadian General Standards Board, Supply and Services Can- ada Standard for Exit Lighting Fixtures 109-GP-3M (1978) Withdrawn Feb. 1988
Liddy J Personal communication, office of the Fire Commissioner of Canada (1985)
National Fire Protection Association (NFPA) Code for Safety to Life
Fire inBuildings andFiresNFPA 101-1981 Vol. 5 101.21-101.22
(1981)
Standards Association of Australia Emergency Evacuation Lighting in
Buildings Standard AS2293 (1983)
Schwley L C and Reagan J A Visibility and legibility of exit signs Pan 2: Experimental results 3. Ilum. Eng. Soc. 10 29-32 (October
1980)
Quintiere J G Smoke measurements: An assessment of correlations between laboratory and full-scale experiments Fire and Materials 6(3&4) 145-160 (1982)
Underwriters' Laboratories Inc. Report a Supplemental Sey-Lumi-
MUT Exit Signs and Markers File SA6527 Project 75NK7227 (Santa
Barbara, CA) (1976)
Collins B L and Lerner N D An Evaluation of Exit Symbol Visibility National Bureau of Standards (Washington DC) NBSIR 83-2675 (1983)
Jin T Visibility through 6re smoke3. Fire and Flummability 9 135- I55 (April 1978)
Rea M S, Clark F R S and Ouellette M J Phowmenic and Psycho-
physical Measurements of Exit Signs through Smoke National Research
Council of Canada, Div. Bldg. Research, DBR Paper No. 1291, NRCC 24627, Ottawa (1985)
Rea M S, Ouellette M J and Clark F R S Design Considerations for Egress Signs Based upon Visibiity through Smoke Proc. C a f .
American Institute of Architects, Los Angeles, U S A (1985)
Rea M S How good are emergency lighting systems? Lighting Des.
Applic. lS(9) 2 6 2 7 (1985)
Rea M S Exit signs in smoke: A cloudy issue under study Canadiun
Consulting Enginem 27(3) 34-35 (1985)
Clark F R S Assessment of smoke density with a helium-neon laser
Fire and Materials 9(1) 30 (1985)
Neter J and Wassennan W Applied Linear Stacktical Models (Home- wood, Illinois, USA: &chard D Irwin) (1974)
Benjamin I A The challenge of smoke Fire Safety J . 7 3-9 (1984)