HAL Id: hal-02178972
https://hal.archives-ouvertes.fr/hal-02178972v2
Submitted on 3 Jul 2019
HAL is a multi-disciplinary open access
archive for the deposit and dissemination of
sci-entific research documents, whether they are
pub-lished or not. The documents may come from
teaching and research institutions in France or
abroad, or from public or private research centers.
L’archive ouverte pluridisciplinaire HAL, est
destinée au dépôt et à la diffusion de documents
scientifiques de niveau recherche, publiés ou non,
émanant des établissements d’enseignement et de
recherche français ou étrangers, des laboratoires
publics ou privés.
Attached cavitation in laminar separations within a
transition to unsteadiness
Kilian Croci, Florent Ravelet, Amélie Danlos, Jean-Christophe Robinet, Luc
Barast
To cite this version:
Kilian Croci, Florent Ravelet, Amélie Danlos, Jean-Christophe Robinet, Luc Barast. Attached
cavita-tion in laminar separacavita-tions within a transicavita-tion to unsteadiness. Physics of Fluids, American Institute
of Physics, 2019, 31 (6), pp.063605. �10.1063/1.5097924�. �hal-02178972v2�
Attached cavitation in laminar separations
within a transition to unsteadiness
K. Croci, F. Ravelet, A. Danlos, J.-C. Robinet, and L. Barast
AFFILIATIONS
DynFluid Laboratory, ENSAM Paris, 151 Boulevard de l’Hôpital, 75013 Paris, France Electronic mail:[email protected]
Also at: CNAM, Paris, France.
ABSTRACT
Attached sheet cavitation is usually observed in turbulent water flows within small laminar separation bubbles which can provide favorable conditions for inception and attachment of cavities. In the present study, viscous silicone oils are used within a small scale Venturi geom-etry to investigate attached cavitation into laminar separated flows for Reynolds numbers from 346 to 2188. Numerical simulations about single phase flows are performed with steady simulations for a Reynolds number range Re ∈ [50; 1400] and with unsteady simulations for Re ∈ [1000; 2000]. They reveal the emergence of two large laminar boundary layer separations downstream of the Venturi throat in addition to low pressure zones which can possibly induce both degassing or cavitation features. Experiments are performed with high-speed photogra-phy, and several multiphase dynamics are observed in these viscous flows, which are considered as quasisteady flows at low Reynolds numbers Re ≤ 1400. Degassing phenomenon with air bubble recirculation has been first observed at pressures far above liquid vapor pressure whereas typical attached cavities have been identified for low pressure conditions as “band” and “tadpole” cavities into the different separations of the laminar flows. For higher Reynolds numbers, a flow regime transition can be noticed in the wake of well-developed gas structures, character-ized by wake instabilities, causing vortex cavitation above a critical Reynolds number associated with the bubble width Rebc≃ 616. This regime
transition can possibly occur either quasicontinuously in the wake of an attached “band” vapor cavity or intermittently behind a recirculating air bubble generated with degassing. This last phenomenon is associated in our study to classical “patch” cavitation.
I. INTRODUCTION
Attached cavitation is generally defined as the establishment of a stable bubble, or cavity, in a particular location of a flow such as boundary layer separations usually induced by high pressure gradi-ents1with, for instance, laminar separation bubbles2into turbulent flows. Arakeri3and Franc and Michel4introduced this kind of cavi-tation, usually associated with “sheet” cavicavi-tation, in turbulent flows within a laminar separation bubble in which cavities can emerge and develop without being carried away by the incoming flow. Attached cavities have thus been observed on smooth axisymmetric bodies by Parkin and Kermeen5and Arakeri,6on propellers blades by Kuiper,7 on foils by Guennoun,8 and around a sphere by Brandner et al.9 This stable attached sheet cavitation can possibly transition to par-tial “cloud” cavitation10where classical re-entrant jet11and bubbly shock wave phenomena12can occur periodically. Different types of attached cavities can be observed in that sort of flow such as attached
band “finger” cavities,8which are generated in the separation layer when the vapor pressure is reached at some point, or even patch cavitation13which emerges when a large bubble interacts with the laminar separation bubble leading to instabilities that can induce vaporization. These attached cavities are reviewed in detail by Van Rijsbergen.14
Furthermore, another phenomenon can have an important impact in such types of cavitating flows, the degassing. Briançon-Marjollet, Franc, and Michel15 thus investigated the effects of air bubble injection on vapor cavities attached on a hydrofoil. They observed that the air bubbles appeared to deeply change the flow topology, modifying quite frequently the adverse pressure gradi-ents leading to a destabilization of the laminar separation bubble in which stable vapor cavities were initially attached. Consequently, stable attached cavitation transforms with bubble injection into trav-eling bubble cavitation which is characterized by nuclei growth in low pressure regions and collapse within higher pressures.16
Venning et al.17 added that an important population of free gas nuclei can even impact developed partial cloud cavitation shedding mechanisms. More generally, the influence of free stream nuclei18,19 in addition to noncondensable dissolved gas20on cavitation incep-tion has already been evidenced and a hysteresis between incepincep-tion and desinence is classically observed depending on these two param-eters. Dissolved air concentrations and thus air bubbles’ population can be particularly important in oil viscous flows,21 with a typi-cal Bunsen coefficient22from 7 to 12 Vol. %,23 leading to similar cavitation inception hysteresis24 than those classically observed in turbulent water flows. The inception of cavitation is commonly asso-ciated in the literature25 to a nuclei which fills with vapor when it experiences a pressure drop below the liquid vapor pressure. Washio, Takahashi, and Yoshimori,26Washio et al.,27and Washio, Kikui, and Takahashi28observed vaporous cavitation inception in viscous mineral oil separated flows and proposed another incep-tion mechanism which does not depend on the presence of a nuclei. According to their studies, vapor cavities can emerge close to a sep-aration point on the wall where the liquid undergoes high tensions which can, when the threshold is exceeded, induce a microscopic rift between the liquid and the wall leading to the emergence of a cavity.
In summary, a separated viscous flow should present favor-able conditions for the emergence of attached cavitation in addi-tion to an important degassing, which could possibly interact with both vapor cavities and flow separations. In a previous work, Croci et al.29 observed the formation of attached cavities, supposedly filled with air regarding the high pressure measured, generated with the interaction of degassing with a large separated laminar viscous flow.
In the present study, this investigation is extended to cav-itation inception and development of partial cavcav-itation into vis-cous separated laminar flows within a Venturi geometry. In these viscous flows, shedding mechanisms as re-entrant jets or bubbly shock waves, usually observed in turbulent water flows, do not seem to develop contrary to attached cavitation. The viscous sili-con oils used, with a high dissolved air sili-content (the Bunsen coef-ficient was about 19 Vol. % at 25○C for 47 V 50 oil), can also
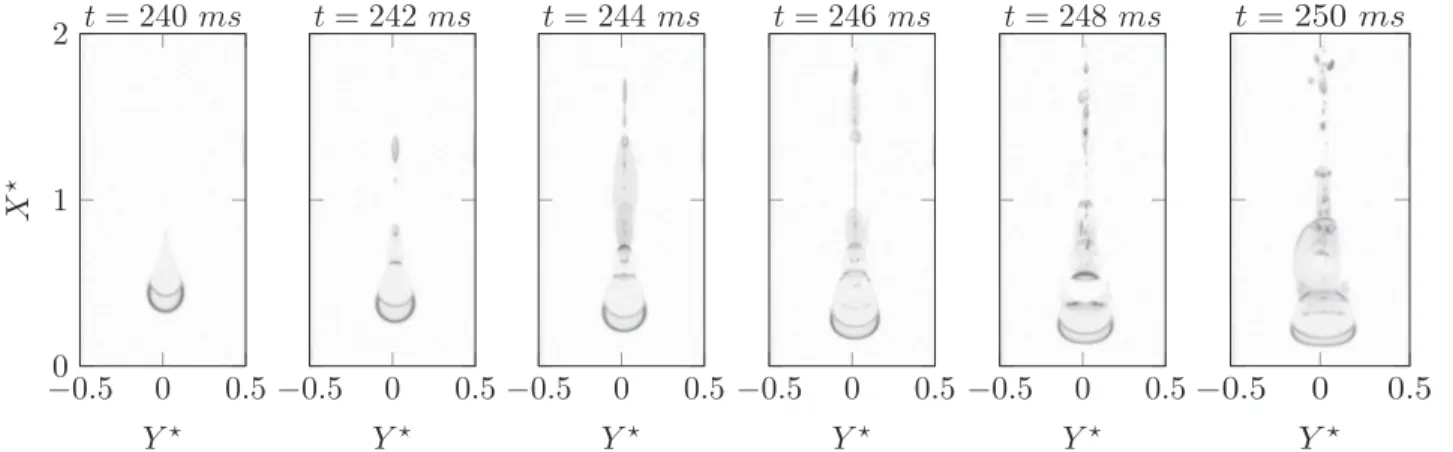
present important degassing dynamics. The attached cavities, both resulting from degassing (air) or cavitation (oil vapor), are inves-tigated experimentally with high speed cameras exploring increas-ing inlet Reynolds numbers from roughly 350 to 2200 as a func-tion of the flow cavitafunc-tion number. A typical map presenting both cavitation and degassing flow conditions is sketched inFig. 1 high-lighting a flow transition to unsteadiness which can occur, for this range of Reynolds numbers, depending on the multiphase dynamics present.
In cavitating flows, instabilities can induce important pres-sure fluctuations which can modify attached cavitation inception and development.30These fluctuations might also impact degassing dynamics as illustrated in Fig. 1. Consequently, the final part of this study will focus on the particular flow dynamics that might be due to instabilities and indicate a flow regime transition to unsteadiness.
After introducing the experimental setup and protocol in Sec. II, the flow topology is highlighted in Sec.III, first numeri-cally with both steady (Re ∈ [50; 1400]) and unsteady (Re ∈ [1000; 2000]) simulations and second with an experimental observation
FIG. 1. Typical multiphase phenomena map (based on the experimental outcomes
developed in Secs.IVandV) that occur in silicon oil flows sketched depending on the cavitation and the Reynolds numbers. Degassing and cavitation dynamics can importantly modify the flow topology and induce a flow transition to unsteadiness.
of bubble recirculation indicating a flow separation (Re ≃ 652 and σ ≃ 17.9 in 47 V 100 silicone oil). 47 V 100 viscous oil flows pre-senting low Reynolds numbers (Re ≤ 1201) are then investigated experimentally. These flows, which are considered as quasisteady flows, present different attached cavities which are fully described in Sec.IV. In a second part, the destabilization of the previous steady laminar flow is investigated using a 47 V 50 less viscous silicon oil in order to explore higher Reynolds number conditions until Re ≃ 2188. In Sec.V, flow unsteadiness is investigated revealing two main unsteady flow dynamics:
● “Patch” cavitation (Sec.V A) which emerges intermittently. ● Wake vortex cavitation (Sec. V B) which occurs at high
frequency.
Finally, the study conclusions are developed in Sec.VI present-ing equally some future works.
II. EXPERIMENTAL OVERVIEW A. Cavitation test-loop and protocol
The experiments were conducted in a test-loop, presented in
Fig. 2, of the DynFluid laboratory facilities especially designed to limit pressure loss and to visualize cavitation. The loop is composed of a Pollard MPLN 142 centrifugal pump (1) which impels silicon oil in a pipe system presenting 40 and 50 mm inner diameters to a 100 l tank (2). The oil tank, which is equipped with a temper-ature sensor ThermoEst PT100 (3), is connected to air supply or to a vacuum pump (4) to set the static pressure in the test section when operating. The oil goes then up to an ultrasonic flowmeter KHRONE Optisonic 3400 (5) placed 1.5 meters upstream of the test section (7) in which the pressure is monitored with two pres-sure sensors (6) located, respectively, at the inlet and the outlet sections.
FIG. 2. Sketch of the test loop with (1) the pump, (2) the oil tank, (3) the
temper-ature sensor, (4) the compressor or vacuum pump, (5) the ultrasonic flowmeter, (6) the pressure sensors, and (6) the operating test section detailed inFig. 3. Reprinted with permission from K. Croci, “Étude expérimentale des écoulements multiphasiques dans une couche limite laminaire decollée,” Ph.D. thesis, Arts et Métiers Paris, France, 2018.
The test section, schematized inFig. 3, consists of a Venturi geometry with convergent/divergent angles of 18○ and 8○,
respec-tively, similarly to a previous study of Danlos et al.31 It presents a 20 × 10 mm2inlet (or outlet) section and a 10 × 10 mm2square section at the throat. The test section is all made of transparent plexiglass in order to permit both side and top visualizations. Two round to rectangle contraction nozzles with an area ratio of 6.3 are placed on each side of the test section to connect to the pipe system.
All experiments are realized following a similar protocol in order to investigate separated viscous flows. The oil in the setup is first kept saturated at the atmospheric pressure, circulating at this pressure at a slow velocity during several hours, and experi-ments are carried out progressively decreasing the pressure in the system in order to always get the oil at supersaturation, allowing the driven diffusion process described by Groß and Pelz.32The mea-surements are operated, for stabilized temperatures taken in a range 15.5 < T < 27.1○C, at least 5 min after modifying the flow
parame-ters to steady the flow. All inception measurements are reproduced three times at fixed velocities, slowly decreasing the pressure in the test section within a waiting time about 10 min between each point to capture the phenomenon emergence in stable flow condi-tions. The inlet and outlet test section pressures, named Pinand Pout,
are measured with pressure taps located at 103 mm upstream and 201 mm downstream from the Venturi throat, respectively (Fig. 3). The pressure loss ∆P, that will be used in Sec. III A, represents the difference between Pinand Pout. The inlet velocity Vinis
esti-mated from flowrate measurements applied to the inlet test sec-tion. In these experiments, the inlet velocity ranges between 1.5 and 5.9 ms−1and the associated inlet Reynolds number, defined as Re = Uinhin/ν (with ν the kinematic viscosity of the liquid), is
explored for 346 < Re < 2188. The cavitation number is equally defined at the inlet section as σ = 2(Pin− Pv)/ρU2in, where ρ and Pv
are the density and the vapor pressure of the liquid, respectively. All lengths are normalized with the test section width w = 10 mm such as X⋆
= X/w.
B. Study parameters and flow visualization
The two viscous oils used in this study are given as follows: ● The 47 V 50 silicon oil (at temperature T = 25○C, density
ρ = 959 kg m−3, kinematic viscosity ν = 49.4 mm2s−1, and surface tension S = 20.7 mN m−1), already studied by Duhar and Colin33to investigate bubble detachment in shear flows.
FIG. 3. Sketch of the Venturi geometry. The width of the test section is w = 10 mm and its height at the inlet section is hin= 20 mm. Thereafter, the axes origin is positioned
at the Venturi throat edge in the middle of test section along the width. Reprinted with permission from K. Croci, “Étude expérimentale des écoulements multiphasiques dans une couche limite laminaire decollée,” Ph.D. thesis, Arts et Métiers Paris, France, 2018.
FIG. 4. Side (a) and top (b) views of typical transitioning flow, with attached cavities and vaporization of a hairpin vortex, captured at Re = 2185 and σ = 4.53. The flow is
from left to right. The two black lines positioned at X⋆= 0 and X⋆= 7.1 indicate the throat and the end of the Venturi slope, respectively. The different attached cavities usually observed in laminar separated flows, namely, the “band” cavity, the “tadpole” cavities, and the secondary “tadpole” bubbles, are associated with symbols (green open triangle, blue open square, and red open circle) and numbered from 1 to 3, respectively. Reprinted with permission from K. Croci, “Étude expérimentale des écoulements multiphasiques dans une couche limite laminaire decollée,” Ph.D. thesis, Arts et Métiers Paris, France, 2018.
● The 47 V 100 silicon oil which at temperature T = 25○
C has a density ρ = 963 kg m−3, a kinematic viscosity ν = 101.2 mm2s−1, and a surface tension S = 20.9 mN m−1. Both silicone oils, which present a good transparency for visu-alization, vaporize at a really low vapor pressure Pv≃ 1 Pa. Oil flow
capillary numbers, defined as Ca = ρνVin/S, present high values over
102revealing the negligibility of capillary forces compared to viscous forces in our flows. The 47 V 100 oil is first used for the measure-ments developed in Sec.IV, whereas the images depicted in Sec.V
are for 47 V 50 oil flows, which is less viscous.
Cavitating flows are captured with two Optronis CR1000 × 3 high-speed cameras placed on the top and the side of the test sec-tion, respectively. The images are captured with a frame rate of 1500 frames/s with a resolution of 1280 × 768 pixels2for 2 s. The resulting photographs are then normalized with a background image (without cavitation). The flow is continuously illuminated from the
backside with a homogeneous white LED backlight Phlox and, con-sequently, the interface between the liquid and vapor appears in black in the images. Typical side and top views of a cavitating flow in a transitioning flow regime (cf. Sec.V) are depicted inFig. 4.
All the main study parameters are presented inTable Iwith their associated uncertainties. In Secs. III–V, two main parame-ters will be used to characterize each flow: the Reynolds and the cavitation numbers.
III. LAMINAR FLOW TOPOLOGY A. Numerical laminar flow
Numerical simulations of the single-phase flow are performed in order to study both the topology of the flow and the order of magnitude of the absolute pressure encountered in the experiment, as a function of the Reynolds number. The computational domain
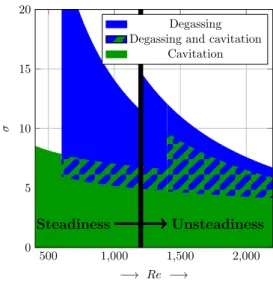
TABLE I. Flow parameters, ranges, and estimated uncertainties for silicone oils 47 V 50 and 47 V 100.
Symbol Parameters Range (47 V 50) Range (47 V 100) Unit Uncertainty (%)
Ca Capillary number [420; 1240] [1041; 2611] . . . ±3
Pin Inlet pressure [355; 1100] [617; 1531] mbar <1
Pout Outlet pressure [117; 753] [155; 1202] mbar <1
Re Inlet Reynolds number [541; 2188] [346; 1201] . . . ±3
T Operating temperature [15.5; 26.1] [18.4; 27.1] ○
C <1
Vin Inlet velocity [1.51; 5.56] [1.95; 5.86] ms−1 <1
σ Inlet cavitation number [4.53; 73.0] [5.73; 60.0] . . . ±2
ρ Oil density [958; 964] [961; 970] kg m−3 <1
reproduces the experimental geometry that is shown inFig. 3. It is extended by extrusion in the X direction on a distance 10w upstream of the inlet of the test section and 20w downstream of the outlet of the test section. The computational domain is meshed with 1.13 × 10⁶parallelepipedic cells with 51 points in the cross-stream directions and a near-wall cell size of 5 × 10⁻³w. A grid convergence test has been performed at Re = 1500. The bound-ary conditions are a uniform inlet velocity and a uniform static pressure outlet. The Computational Fluid Dynamics code that is used is StarCCM+. The equations that are solved are the incom-pressible Navier-Stokes equations with a constant density and vis-cosity. No turbulence model is used. The scheme of the spatial discretization is second order upwind and the velocity pressure coupling uses a co-located variable arrangement and a Rhie-and-Chow-type pressure-velocity coupling combined with a SIMPLE-type algorithm. Steady simulations have been performed in the range Re ∈ [50; 1400], and unsteady simulations with a second-order Euler implicit method have been performed in the range Re ∈ [1000; 2000].
The dimensionless pressure difference across the test section is plotted as a function of the Reynolds number inFig. 5and is com-pared to experiments performed under single-phase flow conditions. The pressure loss coefficient is defined as Kp = 2(Pin− Pout)/ρUin2.
The two curves fairly collapse, which is a clue in favor of the qual-ity of the simulations. Moreover, one can notice that the scaling of the pressure loss coefficient with the Reynolds number roughly corresponds to a Re−1power-law at a very low Reynolds number (Re ∈ [50; 150]) which is consistent with the laminar flow. The local scaling exponent then gradually increases from κ ≃ −0.94 at Re = 200 to κ ≃ −0.48 at Re = 1000 and κ ≃ −0.25 at Re = 1400 (see the inset inFig. 5). There is thus no evidence for a bifurcation in the flow but rather for a smooth and gradual change in the topology of the flow with the increase in the Reynolds number. This corresponds to the development of a separation bubble downstream of the venturi throat as described hereafter.
In the range of Reynolds numbers investigated (Re ∈ [0; 2000]), two distinct flow separations, illustrated in Fig. 6 with velocity isocontours, can emerge:
FIG. 5. Pressure loss coefficient Kp as a function of the Reynolds number
Re. The black bullets stand for experiments in single-phase flow and the blue
squares stand for the numerical simulations. The dashed line is a line of equation
Kp∝Re−1. Inset: local scaling exponentκ such that Kp∝Reκ.
FIG. 6. X-axis velocity isocontours highlighting the flow separations in flows
pre-senting Reynolds numbers (a) Re = 650 (Vin= 3.25 ms−1) and (b) Re = 1200
(Vin = 6 ms−1). Red, green, and blue regions correspond to X-axis velocity
Vx= −10−5, −0.2, and −0.4 ms−1, respectively.
● A main flow separation, which occurs starting from a Reynolds number Re ≃ 350, develops in the wake of the Venturi geometry along the divergent slope corresponding to the position X⋆ > 0 and Z⋆ < 0, first along each lateral wall
(Y⋆≃ ±0.5) and on all along the Venturi width for Re ≥ 650
as depicted inFig. 6(a).
● A secondary laminar boundary layer separation emerges at a Reynolds number Re ≃ 1100 at the upper wall of the test section (X⋆> 0 and Z⋆≃ 1). This flow separation, shown inFig. 6(b)
for the flow Reynolds number Re = 1200, can be associate to that classically observed downstream of a backward-facing step by Armaly et al.34
The different flow separations illustrated in Fig. 6 for (a) Re = 650 and (b) Re = 1200 present counterflow streams inducing a recirculation dynamics that will be developed experimentally in Sec.III B.Figure 7presents the X-axis velocity (b) and pressure (c) profiles that are extracted along a line situated 0.5 mm [i.e., 5hin/100
above the bottom wall and at Y⋆= 0 (a)]. The velocity profiles for
the Reynolds numbers Re = 650 and Re = 1200, normalized with the inlet velocity Vin, reveal the flow acceleration due to the
sec-tion reducsec-tion at the Venturi throat and the flow separasec-tion on the Venturi divergent slope, which increases with the Reynolds number. First, upstream of the venturi throat (for X⋆≤ −3), the
dimension-less velocities are quite low owing to the presence of a boundary layer. They are also different for the two different Reynolds num-bers which illustrates the continuous change in flow topology with the Reynolds number. In both cases, the maximum dimensionless velocity is reached at the throat (X⋆
= 0) and is moreover surpris-ingly large for Re = 1200. The velocity profile then decreases very fast, with Vx≤ 0.2Vinfor X⋆≥ 1. The streamwise velocity along this
line that lays in the plan Y⋆
= 0 becomes negative only very close to the end of the venturi slope (X⋆
FIG. 7. Venturi geometry (a), X-axis velocity Vx (b), and pressure Px (c)
pro-files measured along the Venturi geometry wall at Y⋆= 0 for Reynolds numbers
Re = 650 and 1200. Vxand Pxare normalized with the inlet velocity Vinand the
pressure loss∆P, respectively. The dashed green line in (a) reveals the mea-sure line, located 0.5 mm above the bottom wall at Y⋆= 0, from which pressure and velocity profiles are extracted. The black dashed line plotted in (c) corre-sponds to the condition Px= 1 bar, indicating the air saturating level used in our
experiments.
area with negative streamwise velocities is visible at Re = 1200, for X⋆ ∈ [1.8; 11.8]. This is consistent with the isocontours shown
inFig. 6.
These different laminar flow separations can provide favorable conditions to the attachment of gas cavities resulting, for instance, from cavitation. As illustrated inFig. 7(c)with the pressure pro-file along the Venturi geometry, normalized with the pressure loss ∆P, the flow acceleration at the throat induces a low pressure region located in the vicinity of the Venturi throat (X⋆ = Y⋆ = Z⋆≃ 0).
Note that these profiles depend on both the Reynolds num-ber and the cavitation numnum-ber, with the dimensionless value of the inlet pressure being σ/Kp. These profiles are shown for
two flow conditions that will be investigated experimentally in Secs.III BandIV: Re = 650 and σ = 17.9 on the one hand, and Re = 1201 and σ = 5.87 on the other hand. In the first case (Re = 650; σ = 17.9), we can notice that the absolute pressure is greater than the air saturation pressure upstream of the throat and that down-stream of the throat, at least along this peculiar line, degassing may occur. In the second case (Re = 1201; σ = 5.87), the absolute pres-sure appears to reach negative values close to the Venturi throat, implying the possible vaporization of liquid oil in this part of the flow.
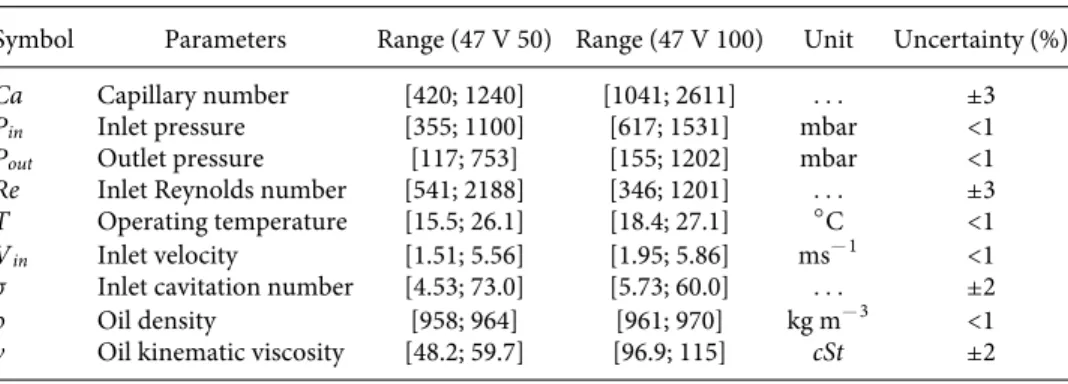
We thus estimate numerically inFig. 8 the value of the crit-ical cavitation number that leads to a minimal absolute pressure of 1.3 Pa at this particular position as a function of the Reynolds number.
FIG. 8. Estimation of cavitation emergence into numerical steady (Re ∈ [0; 1400])
and (Re ∈ [1400; 2000]) unsteady flows depending on Reynolds and cavitation numbers.
For flow conditions located under the curve presented in
Fig. 8, the Venturi geometry would generate enough depression near the throat to induce the oil to vaporize. In Secs.III B–V B, this curve will be used in order to analyze experimental lam-inar flows and more particularly cavitation inception and flow stability.
B. Flow separation and recirculation
In our multiphase experiments, the flow separations are charac-terized by bubbly recirculating processes. This dynamic is illustrated inFig. 9for Re = 652 and σ = 17.9. For this particular flow condi-tions, the one-phase flow topology has been highlighted inFigs. 6(a)
and6(b). In these figures, we can notice that the flow separation, located at the end of the Venturi slope (X⋆= 7.1), is developed on
all the width of the Venturi test section and that a small depression region is located near the throat.
Experimentally, the flow separation is evidenced by a long degassing process, with a characteristic time about 25 s, which leads to the attachment of “tadpole” cavities that will be developed later in Sec.IV A. As we can notice inFigs. 9(a)and9(b), first an incoming bubble grows importantly near a separation point, generally situ-ated in the vicinity of the Venturi throat in our case, due to low pressures and detach from the wall when bubble diameter reaches the separation layer thickness.6A part of the bubble is captured by the separation layer and is driven at the separation laminar bub-ble interface to the reattachment point which is usually located near the trailing edge of the Venturi (X⋆
= 7.1). The bubble sta-bilizes to a stagnation point and, when experiencing a sufficient drag force, finally reaches back the Venturi slope to throat where it settles forming a “tadpole” attached cavity (X⋆ = Z⋆ = 0 and
Y⋆
= 0.5).
The bubble X-axis velocity UXb, normalized with the inlet flow
velocity Vin, is measured with an imaging tracking technique; after
image binarization, the bubble contours are detected and a center of gravity is detected. A finite-difference is then applied on the image sequence to estimate the bubble velocity. The error associated with UXb/Vinis thus estimated to 10−3. This parameter is presented in Fig. 9(c)with its evolution during all the recirculating process. All the steps of this process are highlighted in this figure with first the bubble capture and deceleration into the flow separation, then its long-time stagnation at X⋆= 7.1, and finally the Venturi divergent
slope ascent, characterized by negative velocities, along the lateral wall (Y⋆
FIG. 9. Highlighting of laminar flow separation with bubble recirculation recorded at Re ≃ 652 and σ ≃ 17.9 in 47 V 100 silicone oil. Side (a) and top (b) view superpositions
captured during 25 s within a time step∆t = 100 ms. (c) Evolution of the X-axis bubble traverse speed Ub
X normalized with the inlet flow velocity Vinand presenting
an associated error about ±10−3, as a function of X⋆. Black arrows indicate the direction of the recirculating bubble. Reprinted with permission from K. Croci, “Étude expérimentale des écoulements multiphasiques dans une couche limite laminaire decollée,” Ph.D. thesis, Arts et Métiers Paris, France, 2018.
The recirculating process is sketched inFig. 10with all the dif-ferent steps previously described. Consecutively to several bubble recirculations, two “tadpole” cavities attach to the Venturi throat along each lateral wall (X⋆
= Z⋆
= 0 and Y⋆
= ±0.5). We assume that this recirculating phenomenon is enabled by the flow separation development on the test section width which permits the capture of an incoming bubble.
Cavity attachments in laminar separations are first investigated in Sec.IVwithin 47 V 100 viscous oil, for a Reynolds number gap Re ∈ [346; 1201], for which the flows are considered as steady. The flow unsteadiness, occurring at higher Reynolds numbers, is then developed in Sec.Vusing 47 V 50 oil until Re = 2188.
FIG. 10. Sketch of the bubble recirculation with the capture of an air bubble by
the separation layer causing the attachment of a “tadpole” cavity. Reprinted with permission from K. Croci, “Étude expérimentale des écoulements multiphasiques dans une couche limite laminaire decollée,” Ph.D. thesis, Arts et Métiers Paris, France, 2018.
IV. ATTACHED CAVITATION INTO LAMINAR FLOWS The laminar boundary layer separation presents positive effects for attached cavitation inception. A typical view of separated lami-nar flow, considered as steady, is depicted inFig. 11with the main multiphase dynamics encountered: namely, the air bubble recircula-tion (X⋆≃ 5, Y⋆≃ 0.1, and Z⋆≃ −0.4) leading to attached “tadpole”
cavities (X⋆≃ 0.1, Y⋆≃ ±0.5, and Z⋆≃ 0), the attached “band” cavity
(X⋆∈ [0.1; 0.5], Y⋆= Z⋆≃ 0) and the secondary “tadpole” bubbles
(X⋆∈ [1.5; 3.5], Y⋆± 0.5, and Z⋆≃ 0), which will be developed in
Secs.IV A–IV C.
In our study, these multiphase dynamics, which are associated with the different symbols illustrated in Fig. 11, are investigated with 47 V 100 silicone oil as a function of Reynolds and cavitation numbers. It results in the emergence map of the different multi-phase dynamics, depending on these two flow parameters, which is presented inFig. 12.
The attached “band” cavity inception in the low pressure region near the Venturi throat, occurring for cavitation numbers σ ≃ 7, appears to follow quite nicely the numerical predictions for cavita-tion incepcavita-tion in flows supposed laminar and steady (Fig. 8). As a result, we can assume that, for the low Reynolds numbers encoun-tered in our 47 V 100 oil flows (Re ≤ 1202), the laminar flows can be considered as quasisteady.
The secondary “tadpole” bubbles, which emerge in secondary boundary layer separations along the test section upper wall (Z⋆
= 1), appears to follow a similar evolution than the “band” cav-ity with a cavitation number offset about −1. This offset, which
FIG. 11. Side (a) and top (b) views of a laminar multiphasic flow captured at Re = 1201 and σ = 5.87 with 47 V 100 silicon oil. The flow is from left to right. The two black
lines positioned at X⋆= 0 and X⋆= 7.1 indicate the throat and the end of the Venturi slope, respectively. The different symbols green open triangle, blue open square, and red open circle, numbered from 1 to 3, represent a “band” cavity, a recirculating air bubble, and secondary “tadpole” bubbles, respectively. Reprinted with permission from K. Croci, “Étude expérimentale des écoulements multiphasiques dans une couche limite laminaire decollée,” Ph.D. thesis, Arts et Métiers Paris, France, 2018.
might be due to a dependence of secondary flow separation positions on attached “band” cavity size, will be fully devel-oped in Sec. IV C. Finally, the attachment of “tadpole” cavi-ties, introduced in a previous work29 with similar flow condi-tions, represents an interesting phenomenon which can combine both degassing and cavitation. These particular cavities can result from degassing processes, possibly occurring for a large pressure
FIG. 12. Emergence map of multiphase features in silicon oil 47 V 100. The blue
line indicates the critical Reynolds numberRei
c ≃650 from which bubbles can emerge in the separation layer and form attached cavities. Black crosses indi-cate the flow conditions corresponding to the different flow visualizations depicted in Sec.IV. Reprinted with permission from K. Croci, “Étude expérimentale des écoulements multiphasiques dans une couche limite laminaire decollée,” Ph.D. thesis, Arts et Métiers Paris, France, 2018.
array (Pv < Pin < 1 bar), with air bubble recirculation into the
main laminar flow separation. As noticed in Croci et al.29 work, a critical Reynolds number Reic ≃ 650 from which air
bub-ble recirculation can occur is observed in Fig. 12. This critical number can be explained with the numerical outcomes presented in Sec. III A in addition to the degassing process depicted in Sec.III B.
A. Attached “tadpole” cavities
The “tadpole” cavities usually attach near the Venturi throat along the two test section wall-sides (X⋆ = Z⋆ ≃ 0, Y⋆ = ±0.5).
They result from the interaction of a gas bubble with a sepa-rated flow and can be genesepa-rated both with degassing or cavi-tation. With degassing, the attachment of these cavities follows a long process, with a characteristic time about 30 s, which has been previously developed in Sec. III B. As previously said, this process can only occur above a critical Reynolds number Reic ≃ 650 which correspond to the development of the flow
sepa-ration all along the Venturi width observed numerically in Sec.III. This result is coherent with the degassing process, sketched in
Fig. 10, with the bubble growth which occurs at the middle of the test section (X⋆ ≃ 0) and the capture of a part of this
bub-ble by the separated flow which would be only possibub-ble if the separated flow reach this central position. As depicted inFig. 13, the recirculating process, illustrated with the two bubbles located at 2 < X⋆ < 2.5, remains in the flow even after the attachment
of “tadpole” cavities (X⋆ ≃ 0.2, Y⋆ = ±0.5) inducing a bubbly
recirculation regime.29
Once the “tadpole” cavities (filled with air in that case) attach to the wall, they can remain in the flow despite increas-ing the pressure or lowerincreas-ing the flow velocity whereas, in the meantime, bubble recirculation disappears. An important hystere-sis between inception and desinence of “tadpole” cavities can then be
FIG. 13. Attached “tadpole” cavities top view captured at Re = 968 and
σ = 7.86. Two recirculating bubbles (2 > X⋆>2.5) reach back the Venturi throat. Reprinted with permission from K. Croci, “Étude expérimentale des écoulements multiphasiques dans une couche limite laminaire decollée,” Ph.D. thesis, Arts et Métiers Paris, France, 2018.
observed.29The “tadpole” cavities desinence can be generated in two ways:
● Increasing the pressure in the vicinity of the cavities above the saturating liquid pressure, which is approximately the atmospheric pressure in our experiments. The liquid becomes undersaturated and the driven diffusion32will pro-gressively generate the dissolution of the air contained into the cavities in the liquid.
● Decreasing the Reynolds number under a critical value, esti-mated in a previous work29with the same 47 V 100 oil to Redc ≃ 350. This critical Reynolds number can be associated
with the disappearance of laminar separations, necessary to
cavity attachments, estimated in numerical computations (Sec.III) to Re ≃ 350.
The “tadpole” cavities, initially composed of air, can equally fill with vapor when exposed to pressures near the liquid vapor pres-sure.35 In situations where “tadpole” cavities cannot be generated with degassing, they can emerge on the wall-sides of the test section directly with cavitation due to unsteadiness into flows presenting higher Reynolds numbers. In these types of unsteady flows, detailed in Sec.V, an attached “band” cavity can obstruct the incoming flow and possibly generates a standing, or a “horseshoe” vortex.36For low pressure conditions, this vortex partially vaporizes in a flow separa-tion, generating two attached “tadpole” cavities. As a result, “tad-pole” cavities can emerge at low pressures about the vapor pressure and only disappear at the high saturating liquid pressure generat-ing an important hysteresis. A very similar phenomenon has been observed in the work of Amini et al.37about the tip vortex cavitation on an elliptical hydrofoil.
B. Attached “band” cavity
The attached “band” cavities, illustrated inFig. 14, are char-acterized by their “finger” shapes with classical “divots” structures which are due to the laminar boundary layer local perturbations interacting with the cavity.38The “band” cavities emerge from the Venturi throat center (X⋆= Y⋆= Z⋆≃ 0) and develop progressively
along the test section width forming more and more “divots.” They appear to be mainly composed of vapor, as evidenced by the following:
● The regular condensation of these structures observed experimentally.
● The correlation between the experimental emergence of a “band” cavity near the Venturi throat and the pressures which are estimated numerically in this region, accordingly with the corresponding flow conditions, below the vapor pressure Pv≃ 1 Pa.
Consequently, the emergence of cavitation conditions in a con-tinuous form provides enough vapor to stabilize the cavity despite the high velocities encountered in that flow region. The attached “band” cavities, which can coexist with air bubble recirculation, can constitute an important obstacle in the flow and can gen-erate instabilities (Sec.V) and even influence secondary laminar separations.
FIG. 14. Attached “band” cavity and “tadpole” cavities top view captured at
Re = 1204 and σ = 6.04. Reprinted with permission from K. Croci, “Étude
expérimentale des écoulements multiphasiques dans une couche limite laminaire decollée,” Ph.D. thesis, Arts et Métiers Paris, France, 2018.
C. Secondary attached “tadpole” bubbles
In addition to the “band” cavity and the “tadpole” cavities attachment in the main laminar flow separation, we can observe in Fig. 11 several recirculating bubbles on the upper wall of the test section (X⋆ ∈ [1.5; 3.5] and Z⋆ = 1) along each
wall-side (Y⋆
= ±0.5). These bubbles appear to follow a recirculating dynamic, similar to that presented for “tadpole” cavities, which should indicate the presence of a secondary flow separation pre-viously noticed numerically in Sec. III for Re ≥ 1100. These bubbles, called secondary “tadpole” bubbles for coherency, can emerge in our experiments for much lower Reynolds numbers (Re ≃ 871). This difference can be due to the effects of attached cavities, such as the attached “band” cavity, on the flow topol-ogy whereas gas structures are not taken into account in the simulations.
Regarding the pressures encountered in this flow region and the recirculating dynamic, we can assume that these sec-ondary “tadpole” bubbles might be mainly filled, at first, with air resulting from previous degassing features. Similar secondary flow separations have been observed by Armaly et al.34 down-stream of a backward-facing step into laminar and transitioning laminar/turbulent monophase flows. They noticed that in these flows the separation point location of secondary flow separations appears to mainly depend on the reattachment point position of the main flow separation. However, in multiphase flows, the main flow separation might be importantly impacted by the develop-ment of attached cavities, such as attached “band” cavities, which can deeply change the flow topology in its wake and thus the main separated flow reattachment point position. The develop-ment of partial cavitation, as attached “band” cavities, can clas-sically be associated with the cavitation number which charac-terizes how close the pressure in the liquid flow is to the vapor pressure.25
To resume, a secondary flow separation is linked in multi-phase flows to the main flow separation reattachment which might depend on attached “band” cavities’ development, characterized by the flow cavitation number. Consequently, secondary “tadpole” bubbles’ emergence should occur in the secondary separation con-secutively to the “band” cavity inception, when the pressure is progressively decreased, and be characterized by a critical cavita-tion number σc. In our experiments, this inception evolution is
observed in Fig. 12 and a critical cavitation number σc ≃ 6.1 is
estimated.
V. TRANSITION TO UNSTEADINESS AND VORTEX CAVITATION
In Sec.IV, different attached cavities have been introduced in laminar separated flows considered as steady for Reynolds num-bers Re ≤ 1201. According to the numerical computations pre-sented in Sec.III, the flow separation appears to be fully developed for higher Reynolds numbers (Re ≥ [1300; 1400]) which can pos-sibly lead to more bubbly dynamics. The attached cavities previ-ously introduced, and more generally the bubbles observed in our experiments within their deformations, can influence the topology of the flow and possibly induce wake instabilities39 characterized by vortex cavitation at low pressures.
In the present section, we propose to extend our study to unsteady flows using a less viscous 47 V 50 silicone oil which permits to access to a larger range of Reynolds numbers Re ∈ [541; 2185].
The emergence map of the multiphase dynamic in the 47 V 50 silicone oil is depicted inFig. 15. As previously noticed in Sec.IVfor 47 V 100 oil, degassing seems to emerge above a critical Reynolds number Reic≃ 700 which is consistent with the value of Reic ≃ 650
estimated in 47 V 100 silicone oil by Croci et al.29Moreover, the evolution of the bubbly recirculation emergence seems to follow a similar path with the previous outcomes until Re ≃ 1200 where the slope of the curve completely changes and bubbly recirculation appears for higher pressure conditions. We assume that this change might be due to the instability processes which develop into the separated laminar boundary layer close to the transition to turbu-lence inducing pressure fluctuations.30These fluctuations can then induce bubble growth and recirculation for higher pressure system conditions.
The inception of attached “band” cavity seems to follow a linear evolution which differs with the numerical prediction of cavitation inception, except for the lower Reynolds number point measured at Re = 1305 and σ = 7.04. We assume that for this particular point, the flow can still be considered as steady whereas for higher Reynolds numbers, unsteadiness might hasten the emergence of “band” cav-ity for higher pressure conditions. Finally, the secondary “tadpole” bubbles appear to still emerge in the secondary flow separation for a critical cavitation number σc≃ 6.1.
Otherwise, transition to unsteady flows is characterized in these oil flows by vortex cavitation due to wake instabilities which can occur at relatively high Reynolds numbers. Two vortex cavitation features can be distinguished depending on the continuity of vortex vaporization:
FIG. 15. Emergence map of multiphase features in 47 V 50 silicone oil. Black
crosses indicate the flow conditions corresponding to the different flow visual-izations depicted in Sec.V. Reprinted with permission from K. Croci, “Étude expérimentale des écoulements multiphasiques dans une couche limite laminaire decollée,” Ph.D. thesis, Arts et Métiers Paris, France, 2018.
FIG. 16. Air bubble reaching back the Venturi slope to the throat at Re = 1701 and σ = 11.1 in 47 V 50 oil. The sequence is captured between a time t0= 0 ms (right) and
t1= 240 ms (left) with a sampling period∆t = 10 ms. The flow is from left to right. The two black lines positioned at X⋆= 0 and X⋆= 7.1 indicate the throat and the end of the Venturi slope, respectively. Reprinted with permission from K. Croci, “Étude expérimentale des écoulements multiphasiques dans une couche limite laminaire decollée,” Ph.D. thesis, Arts et Métiers Paris, France, 2018.
● “Patch” cavitation which occur transiently in the wake of recirculating air bubbles or “band” cavities which interact with a recirculating bubble.
● The very frequent vaporization of vortices in the transition-ing wake of a developed attached “band” cavity. We refer to this phenomenon as continuous vortex cavitation.
Both phenomena, inducing very quick vaporization and con-densation of cavitating vortical structures, might possibly generate shock waves40 into the test section with potential erosions41 and interactions with attached cavities. To illustrate the “patch” cavita-tion and the continuous vortex cavitacavita-tion, we focus on two 47 V 50 silicone oil flows presenting Reynolds numbers over 1400 and considered nearly unsteady.
A. Intermittent “patch” cavitation
Li and Ceccio13observed the inception of attached “patch” cav-itation in a turbulent flow due to the interaction of an incoming traveling bubble with the laminar boundary layer on a hydrofoil. The patch cavity is generated in an unstable laminar boundary layer with first the transition to turbulence of two regions from the span-wise edges of the bubble. These regions, presenting low pressure spots, are able to generate liquid vaporization with so-called cavi-tating “tails” which develop in the wake of the bubble to attached
patches as the bubble travels. The bubble finally continues to travel on the flow direction whereas the patch cavity, detached from the bubble, remains in the flow.
1. Experimental highlights
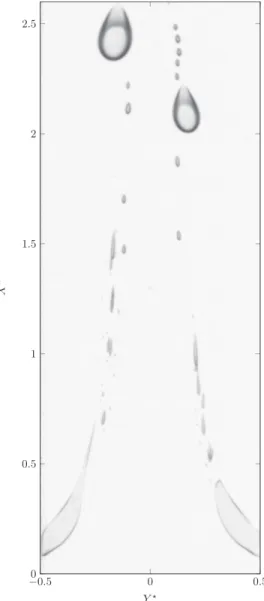
In our study, a similar patch cavitation dynamic is first observed for Re ≃ 1400, within the frequent recirculation of air bubbles into the separated laminar flow to the Venturi throat. This phenomenon, such as those observed by Li and Ceccio13into a laminar boundary layer, might indicate the early stages of transitioning mechanisms to turbulence of the viscous laminar flow. The different steps of this patch cavitation development are depicted for Re = 1701 and σ = 11.1 inFigs. 16–20.
At Re = 1701 and σ = 11.1, the flow all around the Venturi geometry remains laminar and only degassing, with air recirculating bubbles, can be noticed. An air bubble is captured by the separa-tion layer, stabilizes to the Venturi trailing edge (X⋆ ≃ 7.1), and
finally reaches back the Venturi slope when the bubble is sufficiently large to be carried by the recirculating flow. All this process lasts about 30 s.Figure 16illustrates the ascent of the recirculating bub-ble, which lasts 240 ms, starting from a time t0corresponding to
the moment when the bubble begins the ascent. When approaching the Venturi throat, the bubble, which presents an elongated shape in a first time, slows down and became more spherical to finally
FIG. 17. Bubble deformation in the vicinity of the Venturi throat (X∗= 0) at Re = 1701 andσ = 11.1 in 47 V 50 oil. The sequence is depicted from left to right for a time range 242 < t < 250 ms within a time step∆t = 2 ms. The incoming flow go from bottom to top. Reprinted with permission from K. Croci, “Étude expérimentale des écoulements multiphasiques dans une couche limite laminaire decollée,” Ph.D. thesis, Arts et Métiers Paris, France, 2018.
FIG. 18. Vaporization of a vortical structure in the wake of the bubble captured at Re = 1701 and σ = 11.1 in 47 V 50 oil. The sequence is depicted from left to right for a time
range 251.3 < t < 254 ms within a time step∆t = 2/3 ms. Reprinted with permission from K. Croci, “Étude expérimentale des écoulements multiphasiques dans une couche limite laminaire decollée,” Ph.D. thesis, Arts et Métiers Paris, France, 2018.
experience a rapid deformation near the throat, within a few mil-liseconds (242 < t < 250 ms), called a “hemispherical cap” by Li and Ceccio.13 According to their study, this bubble deformation, illustrated in our experiments inFig. 17, occurs when the distance between the bubble and the wall surface becomes similar to the boundary layer thickness. In our viscous flow, we can notice that, during this deformation, microbubble air shedding takes place in the rear of the bubble in addition to oil vaporization (located at Y⋆= 0
and for X⋆> 0.5 inFig. 17). We can then assume that the air bubble,
acting as an obstacle in the flow in the vicinity of the throat, can cause
a pressure drop in its wake favorable for bubble vapor filling and can induce instabilities in the laminar boundary layer which might lead to the transition to turbulence.
In our example, these instabilities are revealed by the vapor-ization of a vortical structure in a small time range 251.3 < t < 254 ms depicted inFig. 18. The side view of the structure captured at t = 253.3 ms is depicted inFig. 19. Besides, similar structure can be observed in the wake of a rising bubble experiencing the zigzagging regime at the transition to path instability.42 This well-developed cavitating structure condenses rapidly at higher pressure conditions,
FIG. 19. Side view of the cavitating vortical structure observed at t = 253.3 for Re = 1701 and σ = 11.1 in 47 V 50 oil. The flow is from left to right. The corresponding top
view is visible inFig. 18. Reprinted with permission from K. Croci, “Étude expérimentale des écoulements multiphasiques dans une couche limite laminaire decollée,” Ph.D. thesis, Arts et Métiers Paris, France, 2018.
FIG. 20. Condensation of the bubble, filled with vapor, captured at Re = 1701 and σ = 11.1 in 47 V 50 oil. The sequence is depicted from left to right for a time range
258.7 < t < 266.7 ms within a time step∆t = 2 ms. Reprinted with permission from K. Croci, “Étude expérimentale des écoulements multiphasiques dans une couche limite laminaire decollée,” Ph.D. thesis, Arts et Métiers Paris, France, 2018.
and consecutively, the cap shape bubble established near the Venturi throat vanishes progressively between t = 258.7 ms and t = 266.7 ms as shown inFig. 20. The rapid condensation of the vaporized vortical structure, which completely disappears in the flow after 20 ms, might lead to the generation of pressure waves propagating throughout the test section. As the pressure increases in the bubble, the center part of the bubble, which might be mainly composed of vapor, con-denses leading to two separated bubbles. These two bubbles finally vanish with the combination of air shedding and oil vapor conden-sation. All the patch cavitation process depicted fromFigs. 16–20is sketched intoFig. 21.
To conclude, the phenomenon described differs a little bit from the patch cavitation described by Li and Ceccio,13who observed the patch cavity emergence due to a traveling bubble passing through
FIG. 21. Sketch of the patch cavitation process with the bubble ascent (a) with
the deformation to “hemispherical cap” and transition to turbulence (b) in the bub-ble wake with a vortical structure vaporization. Reprinted with permission from K. Croci, “Étude expérimentale des écoulements multiphasiques dans une couche limite laminaire decollée,” Ph.D. thesis, Arts et Métiers Paris, France, 2018.
a laminar boundary layer into a turbulent flow and not a recircu-lating bubble in a laminar separated flow as in our experiments. However, the similarities evidenced, with the cap deformation of the bubble or the local transitions to turbulence, allow us to asso-ciate the phenomenon previously described to patch cavitation. This patch cavitation description can also highlight the progressive filling of the initial air bubble with oil vapor which is usually complicated to visualize.
2. Instability transition analysis
In the process of “patch” cavitation, we just presented, a regime transition appears to occur after an important deformation of the bubble which can be considered as an obstacle in the oil stream. We propose to compare the transition conditions encountered in our experiment in the wake of the deformed bubble to the litera-ture about rising bubble wake transition. Ormière and Provansal43 measured the transition to turbulence in the wake of a sphere with a critical Reynolds number Rec= Utd/ν ≃ 280 with d the sphere
diam-eter. However, real bubbles are usually not spherical and present a deformation. In the wake of a rising bubble, with an aspect ratio about γ ≃ 1.85, Duineveld44found a critical bubble Reynolds num-ber Rebc = Utdeq/ν ≃ 660, with deq the equivalent spherical
bub-ble diameter, for the transition to unsteadiness. Magnaudet and Mougin39added that the transition is highly related to a critical bub-ble aspect ratio γc≃ 2.21 for which the wake instabilities are able to
occur.
In our experiment, we observe the emergence of a cavitating structure, which might result from a vortex vaporization, after a very quick bubble deformation within a few milliseconds. When the vortical structure begin to vaporize at t = 250 ms (Fig. 17), the bubble present a width wb ≃ 3.6 ± 0.1 mm and an aspect ratio
γb ≃ 7.2 ± 0.3. Assimilating the bubble width in our experiment
to the equivalent rising bubble diameter calculated in Duineveld’s44 work, we obtain a similar critical bubble Reynolds number about Rebc ≃ 616 ± 5% to characterize the emergence of wake
instabili-ties and, in our case, vortex cavitation. Moreover, with the aspect ratio we measured being much higher than the critical aspect ratio proposed by Magnaudet and Mougin,39we can assume that all the
FIG. 22. Vaporization of a hairpin vortex in the wake of an attached band cavity captured at Re = 2185 and σ = 4.53 in 47 V 50 oil. The sequence is observed from top to
bottom with a period∆t = 2/3 ms. The flow is from left to right. Reprinted with permission from K. Croci, “Étude expérimentale des écoulements multiphasiques dans une couche limite laminaire decollée,” Ph.D. thesis, Arts et Métiers Paris, France, 2018.
conditions for bubble wake transition to instabilities are met. More generally, “patch” cavitation is experimentally observed in almost all the multiphase flows presenting Reynolds numbers over 1400 and attached “band” cavities not fully developed along the Venturi throat (σ > 4.6). In these conditions, the wake instabilities cannot occur continuously and “patch” cavitation would emerge intermittently depending on bubbly recirculation which brings gas to the Venturi throat.
B. Continuous vortex cavitation
A continuous flow regime transition can occur in the wake of developed attached “band” cavities for high Reynolds numbers. An example of cavitating flow in a laminar/turbulent transition regime with Re = 2185 and σ = 4.53 is depicted inFig. 22. This transitioning flow is characterized by the frequent vaporization of vortex struc-tures, identified as a hairpin vortex, (X⋆∈ [3; 4] at t = 1.33 ms) in the
wake of a “band” cavity which condenses downstream with higher pressure conditions. This vortex cavitation appears to occur at high-frequency, requiring more efficient high speed cameras. The study of such dynamics, within the impact of vapor structures’ collapse on the flow topology, will be focused in a future work. However, the frequency of occurrence of such phenomenon can be estimated with a method similar to the one used by Croci et al.:45with a wavelet method applied on the top view image sequence depicted inFig. 22. A wavelet analysis is applied on the gray level signal extracted from a square region (1.8 < X⋆< 2.3; −0.25 < Y⋆< 0.25), located at the
maximum of standard deviation of the image sequence. As a result, vapor structures, which we assimilate to vaporizing hairpin vortices, emerge with an estimated frequency f ≃ 350 Hz ± 4%, corresponding to a Strouhal number St = f × w/Uin≃ 0.6.
The separated steady laminar flows, which presented large main boundary layer separations with reattaching point usually located over the Venturi trailing edge (X⋆> 7.1), reduce importantly with
FIG. 23. Sketch of the emergence of a hairpin votex in
the wake of a hemisphere protuberance. Reproduced with permission from M. S. Acarlar and C. R. Smith, “A study of hairpin vortices in a laminar boundary layer. Part 1. Hairpin vortices generated by a hemisphere protuberance,” J. Fluid Mech. 175, 1–41 (1987). Copyright 1987 Cambridge University Press.
transition to laminar/turbulent transitioning regime forming a lam-inar separation bubble.2We thus estimate that the reattaching point along the Venturi slope in the transitioning flow presented inFig. 22
is located at X⋆≃ 1.
The vortex formation in our experiments can be compared to those observed by Acarlar and Smith36about a hemisphere protu-berance. In their experiments, as shown inFig. 23, the protuberance induces a flow regime transition characterized by hairpin vortices which developed frequently in its wake in addition to a standing or horseshoe vortex around the protuberance. In our experiments, the protuberance can be assimilated to the attached “band” cavity and we can assume that hairpin vortices are generated similarly with, in our case, the possible vaporization of a part of the backflow region which might quite modify the flow inducing other vortex vapor-izations. We also suppose that a horseshoe vortex might eventually vaporize at low pressures around a “band” cavity generating the vapor “tadpole” cavities on the flow separation located on the wall sides (Y⋆± 0.5).
VI. CONCLUSIONS AND FUTURE WORKS
In the present study, multiphase separated flows have been investigated experimentally focusing on attached cavities and their influence on the flow stability. One-phase numerical simulations have been performed additionally to illustrate the flow topology depending on the two main flow parameters: the Reynolds and the cavitation numbers.
As a result, flow separations have been highlighted both numer-ically and experimentally with bubbly recirculation. A separated laminar flow can experience both degassing and cavitation possibly generating different attached cavities: “band” and “tadpole” cavities in the main flow separation along the Venturi geometry and sec-ondary “tadpole” bubbles in a secsec-ondary flow separation located on the upper wall of the test section. Both “tadpole” cavities and secondary “tadpole” bubbles appear to be mainly associated with degassing and bubble recirculation which cause their attachment into flow separations. On the other hand, the attached “band” can be associated with cavitation inception into the low pressure region induced by the Venturi geometry and located at the throat. The ini-tial steady laminar flow can become unstable due to bubble wake instabilities for flow Reynolds numbers Re ≥ 1400, corresponding to a critical bubble Reynolds number Rebc ≃ 616. Above these values,
a transition to unsteadiness can take place in the wake of devel-oped cavities or bubbles intermittently. The vortex cavitation occurs with a frequency estimated to f ≃ 350 Hz in the present study. A future work will consist in investigating the development of attached “band” cavities into degassed separated flows focusing on wake vor-tex cavitation, with relevant frequency analyses, until the transition to supercavitation.
Otherwise, future progress in the comprehension of multiphase viscous flows requires adapted measurement devices to control and estimate precisely bubble gas composition and dissolved gas con-tent in the flow. Velocity measurements into the separated boundary layer might be also appreciated to validate the numerical outcomes. The development of partial cavitation at low Reynolds numbers should also be considered regarding the evolution of attached cav-itation in a large range of Reynolds numbers going from 2000 to 105, the characteristic value encountered in turbulent water flows,31
with a focus on the emergence of the classical re-entrant jet shedding mechanism in the flow.
ACKNOWLEDGMENTS
This research is part of the Ph.D. thesis realized by Croci46 about the “Experimental study of multiphase flows within a sepa-rated laminar boundary layer.”
REFERENCES
1
A. Dovgal, V. Kozlov, and A. Michalke, “Laminar boundary layer separation: Instability and associated phenomena,”Prog. Aeronaut. Sci.30, 61–94 (1994).
2M. Gaster, “The structure and behaviour of laminar separation bubbles,” NPL
Aero Report No. 1181, 1992, revised.
3
V. H. Arakeri, “Viscous effects on the position of cavitation separation from smooth bodies,”J. Fluid Mech.68, 779–799 (1975).
4J.-P. Franc and J.-M. Michel, “Attached cavitation and the boundary layer:
Exper-imental investigation and numerical treatment,”J. Fluid Mech.154, 63–90 (1985).
5
B. R. Parkin and R. W. Kermeen, “Incipient cavitation and boundary layer interaction on a streamlined body,” California Institute of Technology Hydraulic Laboratory, Report No. E-35.2, 1953.
6
V. H. Arakeri, “Viscous effects in inception and development of cavitation on axi-symmetric bodies,” Ph.D. thesis, California Institute of Technology, USA, 1973.
7
G. Kuiper, “Cavitation inception on ship propeller models,” Ph.D. thesis, Delft University of Technology, The Netherlands, 1981.
8M. F. Guennoun, “Étude physique de l’apparition et du développement de la
cavitation sur une aube isolée,” Ph.D. thesis, EPFL Lausanne, Switzerland, 2006.
9
P. Brandner, G. J. Walker, P. N. Niekamp, and B. Anderson, “An experimen-tal investigation of cloud cavitation about a sphere,”J. Fluid Mech.656, 147–176 (2010).
10
P. F. Pelz, T. Keil, and T. F. Groß, “The transition from sheet to cloud cavitation,”J. Fluid Mech.817, 439–454 (2017).
11
M. Callenaere, J.-P. Franc, J.-M. Michel, and M. Riondet, “The cavitation insta-bility induced by the development of a re-entrant jet,”J. Fluid Mech.444, 223–256 (2001).
12
H. Ganesh, S. A. Mäkiharju, and S. L. Ceccio, “Bubbly shock propagation as a mechanism for sheet-to-cloud transition of partial cavities,”Phys. Fluids802, 37–78 (2016).
13
C. Y. Li and S. L. Ceccio, “Interaction of single travelling bubbles with the boundary layer and attached cavitation,”J. Fluid Mech.322, 329–353 (1996).
14
M. van Rijsbergen, “A review of sheet cavitation inception mechanisms,” in ISROMAC2016–International Symposium on Transport Phenomena and Dynamics of Rotating Machinery, Hawaii, Honolulu, USA, 2016.
15
M. Briançon-Marjollet, J.-P. Franc, and J.-M. Michel, “Transient bubbles inter-acting with an attached cavity and the boundary layer,”J. Fluid Mech.218, 355–376 (1990).
16
J.-P. Franc and J.-M. Michel, Fundamentals of Cavitation (Kluwer Academic Publishers, Dordrecht, Boston, 2006).
17
J. A. Venning, M. T. Khoo, B. W. Pearce, and P. A. Brandner, “Background nuclei measurements and implications for cavitation inception in hydrodynamic test facilities,”Exp. Fluids59, 71 (2018).
18
J. W. Holl and A. L. Treaster, “Cavitation hysteresis,”J. Basic Eng.88, 199–212 (1966).
19
Y. Kodama, N. Take, S. Tamiya, and H. Kato, “The effect of nuclei on the incep-tion of bubble and sheet cavitaincep-tion on axisymmetric bodies,”J. Fluids Eng.103, 557–563 (1981).
20
B. Li, Y. Gu, and M. Chen, “An experimental study on the cavitation of water with dissolved gases,”Exp. Fluids58, 164 (2017).
21
F. Peters and R. Honza, “A benchmark experiment on gas cavitation,”Exp. Fluids55, 1786 (2014).
22
C. Ding and Y. Fan, “Measurement of diffusion coefficients of air in silicone oil and in hydraulic oil,”Chin. J. Chem. Eng.19, 205–211 (2011).
23
H.-A. Freudigmann, A. Dörr, U. Iben, and P. F. Pelz, “Modeling of cavitation-induced air release phenomena in micro-orifice flows,”J. Fluids Eng.139, 111301 (2017).
24
T. Ishihara, M. Ouchi, T. Kobayashi, and N. Tamura, “An experimental study on cavitation in unsteady oil flow,”Bull. JSME22, 1099–1106 (1979).
25
C. E. Brennen, Fundamentals of Multiphase Flows (Cambridge University Press, 2005).
26
S. Washio, S. Takahashi, and S. Yoshimori, “Study on cavitation starting at the point of separation on a smooth wall in hydraulic oil flow,”Proc. Inst. Mech. Eng., Part C217, 619–630 (2003).
27
S. Washio, S. Takahashi, K. Uemura, T. Iwamoto, and T. Ogata, “Singular prop-erties of flow separation as a real cause of cavitation inception,”Proc. Inst. Mech. Eng., Part C222, 667–678 (2008).
28
S. Washio, S. Kikui, and S. Takahashi, “Nucleation and subsequent cavitation in a hydraulic oil poppet valve,”Proc. Inst. Mech. Eng., Part C224, 947–958 (2009).
29K. Croci, F. Ravelet, J.-C. Robinet, and A. Danlos, “Experimental study of
cavi-tation in laminar flow,” in 10th Symposium on Cavicavi-tation, Baltimore, USA, May 2018.
30J. Katz, “Cavitation phenomena within regions of flow separation,”J. Fluid Mech.140, 397–436 (1984).
31
A. Danlos, F. Ravelet, O. Coutier-Delgosha, and F. Bakir, “Cavitation regime detection through proper orthogonal decomposition: Dynamics analysis of the sheet cavity on a grooved convergent divergent nozzle,”Int. J. Heat Fluid Flow 47, 9–20 (2014).
32
T. F. Groß and P. F. Pelz, “Diffusion-driven nucleation from surface nuclei in hydrodynamic cavitation,”J. Fluid Mech.830, 138–164 (2017).
33G. Duhar and C. Colin, “Dynamics of bubble growth and detachment in a
viscous shear flow,”Phys. Fluids18, 077101 (2006).
34
B. F. Armaly, F. Durst, J. C. F. Pereira, and B. Schönung, “Experimental and theoretical investigation of backward-facing step flow,”J. Fluid Mech.127, 473–496 (1983).
35
T. Koivula, “On cavitation in fluid power,” in Proceedings of the 1st FPNI-Ph.D. Symposium, Hamburg 2000 (Slovak University of Technology Press, 2000), pp. 371–382.
36
M. S. Acarlar and C. R. Smith, “A study of hairpin vortices in a laminar bound-ary layer. Part 1. Hairpin vortices generated by a hemisphere protuberance,”
J. Fluid Mech.175, 1–41 (1987).
37
A. Amini, M. Reclari, T. Sano, and M. Farhat, “Effect of gas content on tip vortex cavitation,” in Symposium on Cavitation, 2018.
38
A. Tassin Leger, L. P. Bernal, and S. L. Ceccio, “Examination of the flow near the leading edge of attached cavitation. Part 2. Incipient breakdown of two-dimensional and axisymmetric cavities,”J. Fluid Mech.376, 91–113 (1998).
39
J. Magnaudet and G. Mougin, “Wake instability of a fixed spheroidal bubble,”
J. Fluid Mech.572, 311–337 (2007).
40
W. Garen, F. Hegedus, Y. Kai, S. Koch, B. Meyerer, W. Neu, and U. Teubner, “Shock wave emission during the collapse of cavitation bubbles,”Shock Waves26, 385–394 (2016).
41
M. Dular and M. Petkovšek, “On the mechanisms of cavitation erosion– coupling high speed videos to damage patterns,”Exp. Therm. Fluid Sci.68, 359–370 (2015).
42
J. C. Cano-Lozano, C. Martinez-Bazan, J. Magnaudet, and J. Tchoufag, “Paths and wakes of deformable nearly spheroidal rising bubbles close to the transition to path instability,”Phys. Rev. Fluids1, 053604 (2016).
43
D. Ormière and M. Provansal, “Transition to turbulence in the wake of a sphere,”Phys. Rev. Lett.83, 80 (1999).
44P. C. Duineveld, “The rise velocity and shape of bubbles in pure water at high
Reynolds number,”J. Fluid Mech.292, 325–332 (1995).
45
K. Croci, P. Tomov, F. Ravelet, A. Danlos, S. Khelladi, and J.-C. Robinet, “Investigation of two mechanisms governing cloud cavitation shedding: Experi-mental study and numerical highlight,” in ASME 2018 International Mechanical Engineering Congress and Exposition, Fluids Engineering (ASME, 2016), Vol. 7.
46K. Croci, “Étude expérimentale des écoulements multiphasiques dans une


![FIG. 8. Estimation of cavitation emergence into numerical steady (Re ∈ [0; 1400]) and (Re ∈ [1400; 2000]) unsteady flows depending on Reynolds and cavitation numbers.](https://thumb-eu.123doks.com/thumbv2/123doknet/13318536.399598/7.891.102.398.126.467/estimation-cavitation-emergence-numerical-unsteady-depending-reynolds-cavitation.webp)