Publisher’s version / Version de l'éditeur:
Journal of Geophysical Research: Atmospheres, 123, 11, pp. 6175-6195,
2018-05-11
READ THESE TERMS AND CONDITIONS CAREFULLY BEFORE USING THIS WEBSITE. https://nrc-publications.canada.ca/eng/copyright
Vous avez des questions? Nous pouvons vous aider. Pour communiquer directement avec un auteur, consultez la première page de la revue dans laquelle son article a été publié afin de trouver ses coordonnées. Si vous n’arrivez pas à les repérer, communiquez avec nous à PublicationsArchive-ArchivesPublications@nrc-cnrc.gc.ca.
Questions? Contact the NRC Publications Archive team at
PublicationsArchive-ArchivesPublications@nrc-cnrc.gc.ca. If you wish to email the authors directly, please see the first page of the publication for their contact information.
This publication could be one of several versions: author’s original, accepted manuscript or the publisher’s version. / La version de cette publication peut être l’une des suivantes : la version prépublication de l’auteur, la version acceptée du manuscrit ou la version de l’éditeur.
For the publisher’s version, please access the DOI link below./ Pour consulter la version de l’éditeur, utilisez le lien DOI ci-dessous.
https://doi.org/10.1029/2017JD027818
Access and use of this website and the material on it are subject to the Terms and Conditions set forth at
Brown and black carbon emitted by a marine engine operated on heavy
fuel oil and distillate fuels: optical properties, size distributions, and
emission factors
Corbin, J. C.; Pieber, S. M.; Czech, H.; Zanatta, M.; Jakobi, G.; Massabò, D.;
Orasche, J.; El haddad, I.; Mensah, A. A.; Stengel, B.; Drinovec, L.; Mocnik,
G.; Zimmermann, R.; Prévôt, A. S. H.; Gysel, M.
https://publications-cnrc.canada.ca/fra/droits
L’accès à ce site Web et l’utilisation de son contenu sont assujettis aux conditions présentées dans le site LISEZ CES CONDITIONS ATTENTIVEMENT AVANT D’UTILISER CE SITE WEB.
NRC Publications Record / Notice d'Archives des publications de CNRC:
https://nrc-publications.canada.ca/eng/view/object/?id=47328b6c-3fd3-4e67-82e3-aadb4ba6a84d
https://publications-cnrc.canada.ca/fra/voir/objet/?id=47328b6c-3fd3-4e67-82e3-aadb4ba6a84d
Brown and Black Carbon Emitted by a Marine Engine Operated
on Heavy Fuel Oil and Distillate Fuels: Optical Properties, Size
Distributions, and Emission Factors
J. C. Corbin1,2 , S. M. Pieber1 , H. Czech3 , M. Zanatta1,4, G. Jakobi5,6, D. Massabò7,8 ,
J. Orasche3,5,6, I. El Haddad1, A. A. Mensah9 , B. Stengel6,10, L. Drinovec11,12 , G. Mocnik11,12 ,
R. Zimmermann3,5,6, A. S. H. Prévôt1, and M. Gysel1
1Laboratory of Atmospheric Chemistry, Paul Scherrer Institute, Villigen, Switzerland,2Now at National Research Council
Canada, Ottawa, Canada,3Joint Mass Spectrometry Centre, Chair of Analytical Chemistry, Institute of Chemistry,
University of Rostock, Rostock, Germany,4Now at Alfred Wegener Institute, Bremerhaven, Germany,5Joint Mass
Spectrometry Centre, Cooperation Group Comprehensive Molecular Analytics, Helmholtz Zentrum München, Neuherberg, Germany,6Helmholtz Virtual Institute for Complex Molecular Systems in Environmental Health,
Neuherberg, Germany,7Department of Physics, University of Genoa, Genova, Italy,8INFN, Sezione di Genova,
Genova, Italy,9Institute for Atmospheric and Climate Science, ETH Zurich, Zurich, Switzerland,10Department of Piston
Machines and Internal Combustion Engines, University of Rostock, Rostock, Germany,11Aerosol d.o.o., Ljubljana, Slovenia, 12Now at Condensed Matter Physics Department, Jožef Stefan Institute, Ljubljana, Slovenia
Abstract
We characterized the chemical composition and optical properties of particulate matter (PM) emitted by a marine diesel engine operated on heavy fuel oil (HFO), marine gas oil (MGO), and diesel fuel (DF). For all three fuels, ∼80% of submicron PM was organic (and sulfate, for HFO at higher engine loads). Emission factors varied only slightly with engine load. Refractory black carbon (rBC) particles were not thickly coated for any fuel; rBC was therefore externally mixed from organic and sulfate PM. For MGO and DF PM, rBC particles were lognormally distributed in size (mode at drBC≈120 nm). For HFO, much larger rBCparticles were present. Combining the rBC mass concentrations with in situ absorption measurements yielded an rBC mass absorption coefficient MACBC,780 nmof 7.8 ± 1.8 m2/g at 780 nm for all three fuels.
Using positive deviations of the absorption Ångström exponent (AAE) from unity to define brown carbon (brC), we found that brC absorption was negligible for MGO or DF PM (AAE(370,880 nm) ≈ 1.0 ± 0.1) but typically 50% of total 370-nm absorption for HFO PM. Even at 590 nm, ∼20 of the total absorption was due to brC. Using absorption at 880 nm as a reference for BC absorption and normalizing to organic PM mass, we obtained a MACOM,370 nmof 0.4 m2/g at typical operating conditions. Furthermore, we calculated an
imaginary refractive index of (0.045 ± 0.025)(�∕370 nm)−3for HFO PM at 370 nm> � > 660 nm, more than
twofold greater than previous recommendations. Climate models should account for this substantial brC absorption in HFO PM.
Plain Language Summary
We characterized the fundamental properties of marine engine exhaust that are relevant to its aerosol-radiation interactions in climate models. In particular, we focussed on “brown carbon” light absorption (i.e., absorption in excess of that expected for the black carbon in canonical soot). We found that brown carbon can increase the direct radiative forcing of heavy-fuel-oil ship exhaust by 18% over snow.1. Introduction
Ship engines are the major source of combustion aerosols in the marine environment, where almost no other anthropogenic pollution sources exist. Understanding the climate-relevant optical properties of this particu-late matter (PM) is therefore essential to the accurate determination of anthropogenic radiative effects on the marine atmosphere (Endresen, 2003; Lauer et al., 2007; Lindstad et al., 2015; Marelle et al., 2016; Unger et al., 2010). In addition, a large fraction of ship PM is emitted near shore (Eyring et al., 2010), which has a strong potential to negatively impact human health (Corbett et al., 2007; Oeder et al., 2015) as well as visibility. Ship engine PM contains significant amounts of organic PM (OM) as well as black carbon (BC; Buffaloe et al., 2014; Lack et al., 2009; Mueller et al., 2015; Price et al., 2016). When heavy fuel oil (HFO) is used, sulfates
RESEARCH ARTICLE
10.1029/2017JD027818 Key Points:
• Even at 590-nm wavelength, brC in the exhaust of an engine operated on heavy fuel oil (HFO) was responsible for 20% of total PM absorption • HFO contains very large rBC particles
(mode at 640-nm volume-equivalent diameter)
• We report wavelength-dependent imaginary refractive indices and mass absorption cross sections for brown carbon
Supporting Information:
• Supporting Information S1
Correspondence to:
J. C. Corbin and M. Gysel, Joel.Corbin@nrc-cnrc.gc.ca; martin.gysel@psi.ch
Citation:
Corbin, J. C., Pieber, S. M., Czech, H., Zanatta, M., Jakobi, G., Massabò, D., et al. (2018). Brown and black carbon emitted by a marine engine operated on heavy fuel oil and distillate fuels: Optical properties, size distributions, and emission factors. Journal of
Geophysical Research: Atmospheres, 123, 6175–6195.
https://doi.org/10.1029/2017JD027818 Received 1 NOV 2017
Accepted 1 MAY 2018
Accepted article online 11 MAY 2018 Published online 15 JUN 2018
©2018. The Authors.
This is an open access article under the terms of the Creative Commons Attribution-NonCommercial-NoDerivs License, which permits use and distribution in any medium, provided the original work is properly cited, the use is non-commercial and no modifications or adaptations are made.
also contribute significantly to PM mass (Lack et al., 2009; Mueller et al., 2015; Popovicheva et al., 2009). Typically, BC contributes a relatively small fraction to the mass of HFO PM. The overall single-scattering albedo (SSA) of HFO PM aerosols is therefore relatively high, such that ship-engine PM may result in an overall cool-ing over the (low-albedo) ocean surface (Lauer et al., 2007; Unger et al., 2010), but a localized warmcool-ing over high-albedo surfaces or on snow and ice (Lack & Corbett, 2012). The accurate quantification of these radiative effects requires an accurate measurement of the light absorption properties of both BC and OM.
Light-absorbing OM has previously been inferred to contribute significantly to total HFO PM absorp-tion at shorter visible wavelengths �, based on the observaabsorp-tion of 2-� absorpabsorp-tion Ångström exponents (AAEs(370, 880 nm), equation (1), much greater than unity (Mueller et al., 2015). Accounting for this light-absorbing OM in radiative models of the Earth’s atmosphere requires knowledge of intensive optical properties, such as imaginary refractive index (kOM) and mass absorption cross section (MACOM), which have
not previously been reported.
A major goal of the present work was to quantify kOMand MACOMfor use in climate models. This quantification
was achieved by applying the popular (Bahadur et al., 2012; Cazorla et al., 2013; Favez et al., 2009; Fialho et al., 2005; Grenfell et al., 2011; Lack & Langridge, 2013; Pokhrel et al., 2017; Sandradewi et al., 2008; Yuan et al., 2016; Zotter et al., 2017) two-component “BC + brC” model: (i) light absorption in the near infrared (e.g., � > 780 nm) is attributed to BC only, (ii) BC absorption is assumed to depend inversely on � (AAEBC= 1), and (iii) when
mea-sured visible light absorption exceeds predicted absorption by BC, the excess is attributed to light-absorbing OM (so-called brown carbon or brC). In this context, we define BC as refractory, light-absorbing carbon with an AAE of unity between 370 nm < � < 950 nm (Petzold et al., 2013). We consider BC as the sole light-absorbing species at � ≥ 780 nm and, when the aerosol AAE exceeds unity, attribute the excess absorption to brC. While brC is therefore defined purely from the optical properties of the aerosol, we also calculate intensive brC properties by normalizing brC absorption to total organic PM mass.
For HFO PM, the two-component BC + brC absorption approach may not fully describe the aerosol. First, HFO exhaust may contain asphaltenes, large polyaromatic molecules that may contribute to PM light absorption in the near infrared, besides BC (Mullins, 2010). Second, light-absorbing char particles may also be present in HFO PM (Chen et al., 2005; Lyyränen et al., 1999; Popovicheva et al., 2009). These char particles are formed when fuel droplets graphitize rather than vaporize at the high flame temperatures (Linak et al., 2000) and are therefore a subcategory of BC, with typical physical diameters of ∼1 μm. Their large physical diameter places char particles outside of the Rayleigh regime, potentially invalidating the AAEBC = 1 assumption of
the BC + brC approach. Unfortunately, our present measurements do not provide sufficient information to address these char particles explicitly. To the extent that AAEchar ≠ 1, our approach may overestimate or
underestimate the absorption properties of brC. However, even if this was the case, our two-species (BC + brC) approach would still provide the optical parameters required for climate models to correctly represent the wavelength-dependent light absorption of HFO PM which we have observed; the inaccuracy would be in the relative attribution of absorption to the different light-absorbing species. Moreover, as demonstrated by Saleh et al. (2016), climate models which employ Mie theory in radiative transfer calculations produce more accurate estimates of radiative forcing when Mie-theory-retrieved parameters are used, compared to more-complex retrievals.
In the following, we determine the optical properties of brC from a ship engine operating on three different fuels: HFO, marine gas oil (MGO), and EN 590 diesel fuel (DF). The upcoming sections discuss (1) speciated PM emission factors and the PM mixing state, (2) the PM SSA and MACBC at 780 nm obtained by the
extinction-minus-scattering technique combined with refractory BC (rBC) mass concentrations measured by a single-particle soot photometer (SP2), and (3) brC absorption using the BC + brC conceptual model in terms of MACOMand kOMby using OM concentrations measured by an aerosol mass spectrometer (AMS). Note that
the analysis in part (3) does not incorporate the SP2 measurements.
2. Methods
2.1. ExperimentalThe engine used in this study was a single-cylinder research engine installed at the Institute of Piston Machines and Internal Combustion Engines at the University of Rostock in Germany. The size of the combustion chamber and layout of the engine is typical of engines used on smaller ships as a main power supply, on large ships for ancillary power, or as a backup power supply on land, for example, in hospitals. The engine is
Figure 1. Experimental setup. Filter samples were measured after a factor∼12 dilution; other measurements after a further factor 100 dilution. FMPS=Fast Mobility Particle Sizer; SP2=single particle soot photometer; CAPS PMssa=Cavity Attenuation Phase Shift PM SSA monitor; AMS=Aerosol Mass Spectrometer; SMPS=Scanning Mobility Particle Sizer; APM=Aerosol Particle Mass analyzer.
of a four-stroke, single-cylinder design, with a 150-mm bore and 180-mm stroke and operates at a nominal 1,500 rpm with a maximum power of 80 kW. Previous publications have provided further details on the engine (Oeder et al., 2015; Streibel et al., 2017) and reported detailed characterizations of its emissions (Mueller et al., 2015); however, we emphasize that the engine was reconfigured between these two studies. During this study, certain engine operating parameters were varied to investigate their influence on the emissions; none of these parameters were identified as having influenced the properties discussed herein. The measurements took place between 10 November and 9 December 2014.
The sampling system was similar to that used by Streibel et al. (2017) and is shown in Figure 1. Emissions (sampled 1.5 m from the engine at > 500 ∘C) were first passed through 300 ∘C heated lines to a precyclone with a nominal cutoff aerodynamic diameter of 2.5 μm and then diluted by a factor of roughly 12 in a two-stage dilutor. The two-stage dilutor combined a porous-tube stage, where compressed air flowed through pores in a cylinder to provide a sheath flow and minimize wall losses, with an ejector dilutor, at a flow rate of 150 L/min. The exact dilution ratio was measured by real-time CO2monitors. After this dilution stage, filter
sam-ples for thermal/optical reflectance analysis (resulting in NIOSH 5040 EC/OC data) and elemental analysis (discussed elsewhere; Corbin et al., 2018) were taken. Subsequently, two tenfold ejector dilutors (Dekati Ltd., Finland) were employed to reduce PM concentrations to atmospheric levels and ambient temperatures. The steel sampling line (10 mm i.d.) to the aethalometer was approximately 5 m long with a total flow of 4.5 L/min, while the other online instruments sampled at a total of 13 L/min through first ∼ 7-m section of tubing and then at 3 L/min through a second 3-m section of tubing. This flow was then divided between similar lengths of line for the instruments.
The majority of the instruments sampled at high time resolution (1 min or faster), with the exception of the particle-filter samples. For the data presented below, the 30-min filter samples were generally used to define periods of interest (after manual inspection) and data were averaged over these periods.
Particle size distributions were obtained by a Scanning Mobility Particle Sizer (SMPS;85Kr bipolar charger;
Paul-Scherrer-Institute constructed differential mobility analyzer equivalent to the model 3081 of TSI Inc., United States; TSI CPC 3022A) and Fast Mobility Particle Sizer (FMPS, model 3091, TSI Inc.). The SMPS mea-surements are considered more reliable as data-inversion issues (influencing both sizing and counting) have been reported for the FMPS (Zimmerman et al., 2015). We therefore used the SMPS data to obtain geomet-ric standard deviations (GSDs) of the size distribution for the Mie model. However, due to limited coverage of these SMPS data, the FMPS data were used to obtain geometric mean particle diameters (GMDs). These were retrieved from the FMPS data by fitting a bimodal lognormal function to the data using custom code written in Igor Pro (version 6.32, WaveMetrics, OR, United States). The FMPS data were first corrected using the routine
published by Zimmerman et al. (2015), which uses a separate CPC 3022A as a reference for the overall number concentration. The GMD obtained from the corrected FMPS data is considered more reliable than the FMPS GSD (Zimmerman et al., 2015).
For some samples, aerosol particle mass was measured for mobility-size-selected particles using a home-built DMA and a CPC (Model 3022A, TSI Inc. United States) sampling behind an Aerosol Particle Mass analyzer (APM Model 3601, Kanomax Japan). The DMA-APM-CPC data were analyzed as described in Zieger et al. (2017) to yield particle effective density measurements for the ultrafine mode, which was dominated by organics and sulfate. Considering that the organic-sulfate ultrafine particles were liquid and therefore spherical, these effec-tive densities correspond directly to particle densities. Effeceffec-tive density measurements of rBC were attempted but were not feasible as the rBC number concentrations were much lower.
2.2. Single-Particle Soot Photometer
A Single-Particle Soot Photometer (SP2; Droplet Measurement Technologies, CO, United States) was employed to measure black carbon concentrations by laser-induced incandescence (Schwarz et al., 2006; Stephens et al., 2003). Data were analyzed using the PSI SP2 Toolkit, version 4.112. The SP2 brings BC-containing par-ticles to incandescence during their passage through a continuous-wave, intracavity, 1,064-nm laser. The instrument detects rBC cores with mass (or volume-equivalent size, drBC, considering a void-free material
density of 1,800 kg m3) from ∼0.7 (∼80 nm) to ∼200 fg (∼600 nm). For particles in this size range, the total
rBC mass reported by SP2 has been validated as accurate by multiple independent studies (Kondo et al., 2011; Laborde, Schnaiter, et al., 2012; Slowik et al. 2007). The total mass concentration reported below is cor-rected for the mass fraction outside of this range (section 3.1.1). We use the term “rBC” as recommended by Petzold et al. (2013) whenever reporting SP2 data in a quantitative manner, for example, CrBCfor BC mass
concentrations and drBCfor mass-equivalent diameters. We use the term rBC core to clarify that any
nonre-fractory, internally mixed material is not measured by incandescence as it vaporizes well below the ∼4000 K sublimation point of BC.
The SP2 also collects light-scattering signals, acting as an optical sizer for BC-free particles (dminimum≈ 160 nm).
For BC-containing particles, the scattering signal requires careful data processing because laser heating causes coatings to evaporate during measurement. This evaporation is observable in the time-resolved scat-tering signals. For uncoated or moderately coated particles, peak scatscat-tering signals occur when particles are relatively closer to the center of the Gaussian profile of the SP2 laser (since incident light intensity is highest closer to the center) and simultaneously with particle incandescence. For thickly coated particles, this peak is observed substantially earlier and prior to particle incandescence, corresponding to the substantial reduc-tion in particle volume when coating material evaporates. This binary mixing-state classificareduc-tion is commonly referred to as “delay-time analysis” (Moteki & Kondo, 2007). On this basis, particles can be classified as either “thickly coated” (significant difference between peak scattering and incandescence signals) or “moderately or uncoated” (no significant difference). The lower detection limit for this classification is higher than that for rBC quantification, since the SP2 scattering measurement is less sensitive than the incandescence measure-ment. The upper limit for this classification is imposed by saturation of the scattering signal detector, which occurs for large overall particle sizes. We present data only for particles within these limits. Note that a parti-cle consisting of an rBC partiparti-cle coagulated with other material may appear to be thickly coated in the SP2, resulting in an overestimated fraction of thickly coated particles. Note also that a precise distinction between “moderate or no coating” and “thick coating,” for example in terms of BC volume fraction, cannot be given without knowledge of the thermochemical properties of the coating (Sedlacek et al., 2015). Based on our pre-vious comparisons of coating thickness to delay-time data for atmospheric BC particles (unpublished work), we estimate that moderate or no coating describe particles containing 70–100% rBC volume.
A more complex data analysis approach allows the coating thickness of BC-containing particles to be retrieved quantitatively, as follows. By retrieving the scattering signal at 3% of the maximum laser intensity, at which point no coating material has yet evaporated, the scattering cross section of the total, possibly coated, par-ticle can be determined (Gao et al., 2007; Taylor et al., 2015). Conversely, by retrieving the scattering signal after coatings have evaporated but before the onset of incandescence, the scattering cross section of uncoated rBC can be determined (Laborde, Mertes, et al., 2012). The latter value can be used to calculate the rBC-mass-equivalent volume of the rBC core, given a complex refractive index of the core mcore= (n, k). The
precise value of mcoreis not well constrained and may vary between BC materials, but the empirical
Employing this constraint, we determined mcoreas 1.9 + 0.8i by fitting the rBC-core volume determined
by scattering to that determined by incandescence. Our approach of adjusting mcoreonly serves as an
inter-nal calibration of the coating-thickness retrieval and must not be misinterpreted as a measurement of the BC refractive index, which would require additional independent measurements. Our value of mcoreis smaller
than that typically used in SP2 analysis (2.26 + 1.26i) but is consistent with that used by Laborde, Schnaiter, et al. (2012) for propane-flame soot. Using the typical mcorevalue of 2.26 + 1.26i corresponds to smaller rather
than larger coating thicknesses in the analysis presented below. We note that it is typical to observe some negative coating thicknesses in this analysis due to random noise on the single-particle level. Investigations in our laboratory have found that this noise is due mainly to the variability of particle velocity through the laser beam and uncertainty in determining the scattering signal at 3% of the maximum laser intensity. The retrieval of the scattering signal at 3% of the maximum laser intensity means that the lower detection limit for coating-thickness analysis is substantially higher than for delay-time analysis.
The SP2 was operated and calibrated as described in (Laborde, Schnaiter, et al., 2012). Briefly, mass-selected rBC particles representative of atmospheric or diesel rBC (Alfa Aeser Inc., FS, Lot #FS12S011) were used to calibrate the peak incandescence signal and polystyrene latex sphere standards of diameter 269 nm were used to calibrate the partial scattering cross-section measurements.
2.3. Aerosol Mass Spectrometer
Particles are introduced into the High-Resolution Aerosol Mass Spectrometer (AMS) by an aerodynamic lens (Liu et al., 2007), which has its maximum transmission efficiency between about 100 to 600 nm in free-molecular aerodynamic diameter (dfm,a). Note that this aerodynamic diameter is weighted by particle
density (Kulkarni et al., 2011), so that dfm,a= 100 nm corresponds to a volume-equivalent diameter of 69 nm
for the HFO PM density reported below. Nonrefractory material in these particles is then vaporized by an 873 K porous-tungsten cone before electron ionization. The resulting ions are analyzed in a high-resolution time-of-flight mass spectrometer (DeCarlo et al., 2006). Note that we have used the term “sulfate” below rather than “sulfuric acid” (the likely form of sulfate, as discussed below) because sulfate and nitrate are the chemical components measured by AMS after electron ionization. For a more detailed discussion of the AMS results of this study, see Corbin et al. (2018).
2.4. Optical Measurements
The aerosol absorption coefficient was measured by the extinction-minus-scattering technique, using a Cav-ity Attenuation Phase Shift PM SSA monitor (CAPS PMssa, Onasch et al., 2015) operating at 780 nm. This instrument provides a calibration-free measure of extinction (manufacturer-estimated accuracy: 5%). The extinction measurement occurs in an optical cell which incorporates an integrating-sphere nephelometer. This nephelometer was calibrated using the extinction measurement, as described in Onasch et al. (2015), using 269-nm-diameter polystyrene latex spheres and size-selected NH4NO3. We also performed a calibration
at the Paul Scherrer Institute using pure N2and CO2. Overall, eight calibrations over 13 months using all of
these approaches showed a relative standard deviation of only 10%, indicating very stable instrument perfor-mance. Data were manually inspected to ensure that baseline values of extinction and scattering (obtained periodically on filtered samples) were stable. Note that during engine measurements, the CAPS PMssa was occasionally diluted by a factor of 5.1 owing to flow limitations in some experiments (not presented here), which was tested and found to have no effect on the resulting data.
Some data were also acquired using CAPS PMssa instruments operating at 450 and 630 nm. These data are not presented here due to issues with data quality, possibly due to the difficulty of obtaining a valid base-line measurement when variable amounts of absorbing gases with strong surface interactions, such as NO2,
are present.
An aethalometer (model AE33, Aerosol d.o.o., Slovenia) was also deployed during these experiments. The AE33 measures the light attenuation through a PM deposit on a filter at seven wavelengths �. The AE33 converts filter-deposit attenuation coefficients to aerosol light absorption coefficients by applying a conver-sion factor (known as the “C value”) as detailed in Drinovec et al. (2015) and discussed further in section S3, where the calibration factor is evaluated for our samples at 780 nm. To avoid issues due to pressure changes in the sampling lines due to changes in engine conditions, our AE33 data were reanalyzed with a constant compensation parameter (defined in Drinovec et al., 2015).
Three filter samples were also measured with the Multiwavelength Absorbance Analyzer (MWAA; Massabò et al., 2015) with the goal of evaluating the performance of the CAPS PMssa. In particular, the wavelength dependence of the aethalometer calibration could be confirmed as negligible using the MWAA data. This is evident in Figure 6, as discussed further in the supporting information.
2.5. Optical Calculations
Using the AE33 data, the AAE was calculated as the two-wavelength AAE:
AAE(�1, �2) = −
ln (bATN,�1∕bATN,�2
) ln (�1∕�2
) (1)
where the subscripts 1 and 2 indicate two different measurement wavelengths, � is a measurement wave-length, and bATN,�is an AE33-measured attenuation coefficient.
Using the CAPS PMssa data, babn,�was calculated at � = 780 nm by subtracting the measured scattering from
the measured extinction coefficient. By combining the CAPS PMssa babn,780with the measured AAEs, we also
calculated babn,�at � = (370, 470, 520, 590, 660, 880, 950) nm. This calculation is numerically equivalent to
calibrating the aethalometer using the CAPS PMssa (full details are given in the supporting information). For some samples, CAPS PMssa data were not available for this calibration, and the median C value from the other calibrations was applied.
The MAC of a species X at a wavelength �, MACX,�, was calculated as
MACX,�= babn,X,�∕CX, (2)
where babn,X,�is the aerosol absorption coefficient corresponding to absorption by species X. In general, brC is
considered to absorb negligibly at longer wavelengths (Laskin et al., 2015), so that we attribute all absorption at � ≥ 780 nm to BC (babn,BC,�≈ babn,�) and the equation becomes
MACrBC,780= babn,BC,780∕CrBC≈ babn,780∕CrBC, (3)
for BC, with CrBCmeasured by the SP2, corrected for the mass fraction outside of the SP2 sensitivity range
(section 3.1.1).
Light absorption was attributed to brC when the measured absorption exceeded that predicted by extrapo-lating measurements at longer wavelengths (� ≥ 780 nm) to shorter ones (� ≤ 660 nm) using an AAE = 1. That is, brC absorption was defined by
babn,brC,�= babn,�− babn,BC,880
( � 880nm
)−AAE,BC
, (4)
where � and 880 nm represent two measurement wavelengths in nanometer nanometers (missing s) and the subtracted quantity is the AAE-based estimate of BC absorption at �, using AAEBC= 1 except during
sensitiv-ity tests (see below). Equation (4) results in a positive value of babn,brC,�when AAEPM>1and zero babn,brC,�when
AAEPM = 1. In no case was AAEPM<1. While both babn,�and the AAE may be affected by substantial internal
mixing (Lack & Cappa, 2010), we expect this effect to be negligible in our data because substantial internal mixing of brC and BC was ruled out by our measurements (section 3.1.2). Equation (4) was employed to calcu-late babn,brC,�at � = {370, 470, 520, 590, 660} nm, corresponding to each measured wavelength shorter than
the reference (CAPS PMssa) � = 780 nm.
As shown in equation (4), we generally used �2 = 880 nm as the reference wavelength. A sensitivity test
using �2 = 950 nm changed the calculated brC absorption by HFO by only <2% on average. (HFO was the
only fuel with AAEPMsubstantially higher than unity.) Uncertainties in the use of equation (4) are discussed
in section 2.7.
The MAC of brC was calculated using equation (2) with babn,brC,�and COMsubstituted for babn,X,�and CX,
respectively:
MACOM,�= babn,brC,�∕COM, (5)
Figure 2. Schematic of the BC+brC analysis and Mie model fit performed herein. Symbols and abbreviations are defined in Table 1.
2.6. Mie Model
A Mie model was constructed and fitted to the brC absorption and OM mass concentration measurements to obtain imaginary refractive indices of OM, kOM. The model structure, inputs, and outputs are depicted in
Figure 2 and described in the following.
As described below, our measurements indicated that these ship-engine emissions can be appropriately modeled as an external mixture of two modes, a larger rBC mode and a smaller nucleation mode (internally mixed OM and sulfate). In estimating babn,brC,�from equation (4), we have already subtracted light absorption
by BC from the total and must only model the brC absorption when fitting the Mie model.
The model therefore consisted of a single lognormal distribution of internally mixed sulfates and OM; the reported kOMvalues were obtained by minimizing the difference between the measured absorption and the
Mie-predicted absorption of this distribution (each reported kOM was fitted independently of the others).
The Mie calculations required several additional pieces of information, which were constrained as follows. The GMD was obtained from bimodal lognormal fits to the FMPS measurements, and a GSD of 1.65 was obtained from the SMPS data as described in section 2.1. The respective fractions of OM and sulfate in the particles were obtained from the AMS data. The particle material density was obtained from the DMA-APM measurements described above. For HFO and MGO PM, the respectively measured material densities were 1,460 ± 50 and 900 ± 40 kg/m3. The higher density for HFO PM is due to the presence of sulfate. The
den-sity measurements of MGO PM were also used to estimate the denden-sity of DF PM, which was not measured. The measured densities are in good agreement with the density estimated from the mass spectra of these samples (Kuwata et al., 2012), as described in the supporting information.
The real refractive index of OM, nOM, was taken as n = 1.5 (Lu et al., 2015); the fitted results did not change
when varying this value as nOM ± 0.1. The corresponding nSO2−
4 was taken as 1.35 (sulfuric acid). The overall
refractive index of the particles was obtained by combining nOMand nSO2−4 according to their AMS-measured
volume ratios, following the volume-weighted linear mixing rule validated by Abo Riziq et al. (2007). Sensitivity tests indicated that the most sensitive input parameter in this model was the GMD: a large change in GMD of 20 nm corresponded to a change of only ± 0.001 in kOM(kOMwas greater than 0.01 for all HFO
samples, as shown in Figure 8 below). Varying other parameters by large amounts (relative to their anticipated uncertainties) generally led to <10% change in kOM. We note that the PM density used here was well
Table 1
Common Abbreviations and Symbols Used in the Text
Abbreviation Definition
AAE Absorption Ångström exponent
AAE(�1,�2) AAE calculated from two specified�
AE33 Model AE33 Aethalometer
BC Black carbon
rBC refractory BC, measured by SP2
brC Brown carbon, operationally defined by light absorption in excess of that predicted for BC CAPS PMssa Cavity Attenuation Phase Shift
PM SSA monitor
AMS Aerosol Mass Spectrometer
APM Aerosol Particle Mass analyzer
DF Diesel fuel (a distillate fuel) MAC Mass absorption cross section of PM MGO Marine Gas Oil (a distillate fuel) MWAA Multiwavelength Absorption Analysis HFO Heavy fuel oil (residual fuel)
OM The nonrefractory organic component of PM, operationally defined by vaporization at 600∘C
PM Particulate matter
SSA Single-scattering albedo
SP2 Single-Particle Soot Photometer
babn Aerosol absorption coefficient
Cx Mass concentration ofx
n Real part of the refractive index
k Imaginary part of the refractive index
� Wavelength
drBC Volume-equivalent diameter of rBC core
dmob Mobility diameter
Note. Rarely used abbreviations have been omitted for brevity.
Overall uncertainties in kOMwere calculated by propagating the numerical uncertainties given below in a
Monte Carlo calculation.
2.7. Statistical Uncertainties
Unless specified otherwise in this section, uncertainties are statistical imprecisions and are reported as the standard error of the mean (�x̄= SD∕
√
(N), SD, standard deviation) with the averaging periods defined by the 30-min filter periods mentioned above. For derived quantities, uncertainties were propagated from these �x̄.
In the special cases where uncertainties other than statistical noise were known to be significant, those uncertainties were added in quadrature (i.e., possible covariance between these different uncertainties was not addressed):
1. For the CAPS PMssa, uncertainties in babn were propagated from an estimated 5% accuracy in bext
(as estimated by Onasch et al., 2015), 10% accuracy in scattering calibration (based on the SD of multiple calibrations), ±1 Mm−1baselining accuracy and 5% accuracy in dilution correction. The fraction of scattered
light not collected by the CAPS PMssa integrating sphere (the truncation error) must be corrected for if the phase function of measured particles is substantially different to that of the calibration particles. This is not the case if both measured and calibration particles are small relative to the 780-nm wavelength of the CAPS Onasch et al. (2015), which was generally true. Any potential complications introduced by the larger BC
mode in HFO PM are unlikely, considering the fact that the HFO data were not outliers in the optical analy-ses described below. We note that the calculated absorption is not highly sensitive to truncation errors at low SSA values (∼0.7).
2. For the SP2, the relatively low number of rBC particles measured in each sampling period yielded substantial statistical imprecision, which is the major source of reported uncertainty. Calibration-related uncertainties were not propagated into the reported uncertainties; the precision of our calibration data was much less than the just-mentioned statistical imprecision. An unknown source of uncertainty is calibration bias related to differences between calibrant and sample. To the extent that marine engine rBC is similar to road-vehicle rBC, the latter bias is estimated as <14% (Laborde, Mertes et al., 2012).
3. For the AMS, a measurement precision of 0.3 μg/m3was estimated from measurements of filtered air and
combined with the statistical imprecision of the mean. Measured concentrations may have been biased low by ∼10% to 35%, for smaller particles, due to the small measured particle sizes (e.g., ∼60-nm mode diameter of volume distributions). This size-dependent bias was discussed by Liu et al. (2007). Other known biases (Jimenez et al., 2016) include variability in the electron ionization efficiency of different organic molecules and the partial loss of particles to bounce off of the heated vaporizer. The former effect was treated as negligible and the latter estimated as negligible since these particles contained a substantial amount of lubrication oil (Eichler et al., 2017), which as a liquid is unlikely to bounce (Jimenez et al., 2016).
4. An estimated inaccuracy of �AAE(BC)= 0.1 was propagated into the calculated uncertainties of babn,brC,�.
5. In calculating kOM, estimated imprecisions of 5 nm in GMD, 0.1 in GSD, and 4% in density (from the SD of
multiple measurements) were considered as Gaussian and propagated by Monte Carlo calculation.
3. Results and Discussion
3.1. Engine EmissionsThe emission factors relative to engine power (in units of mg/kWh) for OM, sulfates, rBC, and nitrates from this engine were similar to those reported by Mueller et al. (2015) for this engine. For all three fuels, OM emissions dominated the total PM mass with little sensitivity to engine load. For HFO, OM contributed 58% of the PM2.5
mass at 50% load (because sulfate contributed 25%) and >82% of the PM2.5mass below 50% load. Notably,
when normalized to CO2rather than engine power, the variability in emission factors for rBC was substantially
reduced. Section S1 provides more detail on these emission factors.
3.1.1. Total and BC Size Distributions
Particle number and volume size distributions, as measured by SMPS as a function of mobility diameter dmob,
are shown in Figure 3. Also shown in these figures are the number and volume distributions of rBC cores, as measured by SP2 as a function of drBC. These size distributions are representative averages of selected
measurement periods, where both SMPS and SP2 data were available.
The size distributions of the DF and marine gas oil (MGO) PM, shown in Figure 3, were comparable to that of typical diesel engines (Burtscher, 2005), in that two separate modes are identifiable, a volatile ultrafine mode (at about 60 nm dmobin the total-volume distribution) and a soot mode (lognormal at about 120 nm drBCin
the rBC volume distribution) were observed. AMS measurements of the fresh and thermodenuded aerosol indicated that the ultrafine mode for these distillate fuels consisted mainly of organics and, for MGO, sulfates. The rBC volume distribution indicated that a fraction of the MGO and DF particles was above or below the quantification range of the SP2, corresponding to an unmeasured mass fraction of <3% (above) and <23% (below), respectively. The rBC mass concentrations reported from these SP2 data have been corrected for this missing fraction, as discussed further at the end of this subsection.
In considering Figure 3 relative to previous studies (Mueller et al., 2015; Oeder et al., 2015; Streibel et al., 2017), it is important to realize that the SP2-measured drBCis a volume-equivalent diameter, which is by definition smaller than dmobfor soot particles of both open and compact morphologies (Kulkarni et al., 2011). For the
two size distributions in Figure 3 to overlap, a size-independent shape factor of ∼2.2 is required. This value is within the range of values (1.5–3) recommended by Sorensen (2011) for uncoated, fractal-like BC aggregates and corresponds to ∼50 primary particles in a typical BC aggregate, if the monomer diameter is 30 nm (this monomer diameter is from Oeder et al., 2015). Thus, our measured size distributions are consistent with the evidence presented in section 3.1.2 to demonstrate that rBC was externally mixed.
The size distribution of the residual fuel, HFO, also showed an ultrafine mode consisting of sulfates and organ-ics with a mode mobility diameter of about 90 nm. This mode dominated the overall particle number and had a mean (±SD) effective density of 1,460 ± 50 kg/m3. The effective density was considerably lower for MGO,
Figure 3. Size distributions of PM from the marine engine operated on (a) HFO and (b) MGO and diesel. Inset are the DMA-APM effective density data. The upper tails of the total (red; SMPS) distributions do not overlap the rBC distributions (black and blue) because of significant uncertainties in volume calculation for large, irregular particles, and because the latter is plotted against volume-equivalent rBC diameters, which are smaller than mobility diameters for coated or aspherical particles (see text). SMPS measurements for diesel are not available. SMPS=Scanning Mobility Particle Sizer; HFO=heavy fuel oil; rBC=refractory black carbon; MGO=marine gas oil; APM=Aerosol Particle Mass.
at 890 ± 30 kg/m3(data shown in Figure 3). The effective densities for DF PM were not measured. Since the
particles consisted of organics and sulfate (see also section 3.1.2) they were liquid (Seinfeld & Pandis, 2012), and these effective densities correspond directly to the material density of this PM mode. We could not obtain effective density measurements of rBC-containing particles due to their relatively low number concentrations. The rBC-core distribution showed a much broader volume distribution than is expected for vehicular (Burtscher, 2005; Laborde, Crippa et al., 2012), biomass burning (Laborde, Crippa, et al., 2012; Schwarz et al., 2008; Wang et al., 2016), or aircraft (Lobo et al., 2015) emissions. Two studies of Chinese air pollution have also reported large rBC modes of 690 (Huang et al., 2011) and 610 nm (Wu et al., 2017), which may be linked to HFO-combustion pollution. In HFO exhaust from a marine diesel engine, Kasper et al. (2007) also observed a large, nonvolatile (at 400 ∘C) mode but did not measure its chemical composition. Our measurements show that at least part of this mode likely consisted of rBC. It likely comprised the char particles defined in section 1. Future studies should further explore the properties of this large rBC mode.
The SP2 did not measure the tail of the hypothesized char mode (larger rBC mode). In the laboratory, Linak et al. (2000) found that char particles produced from HFO had a typical diameter of 1 μm, which may correspond to the significant mass fraction of PM that has been identified in the coarse mode of marine engines (Fridell et al., 2008). Therefore, we initially hypothesized that the SP2 may not have measured all BC mass in the aerosol. However, we did not find supporting evidence for this hypothesis, as discussed in the following paragraphs.
A simple test of this hypothesis may be performed using the SP2 data directly. At the upper limit of single-particle mass, single particles are measured as saturated signals in the SP2. For the HFO size distribu-tion presented in Figure 3 only 5 of 350,000 particles caused saturated signals. Therefore, the majority of the PM passing through our sampling system (which included a PM2.5cyclone) and reaching the SP2 was
mea-sured. This conclusion is corroborated by the excellent correlation between CAPS PMssa and SP2 (Figures S1 and S2), for which data were available only for selected experiments.
Another test of this hypothesis was performed using Mie calculations of the AAE(880,950) for BC and for cenospheres. We chose this wavelength pair so that absorption by canonical brC would be negligible (Laskin et al., 2015). Cenospheres are core-shell BC particles with air cores and have been observed in HFO PM
Figure 4. (a) Number fractions of particles with thick coatings versus moderate or no coatings, as determined by SP2 delay-time analysis, for BC-containing particles withdrBC100 to 200 nm. (b) SP2 coating thicknesses of BC-containing particles withdrBC= 240 ± 20nm. Negative coating thicknesses are due to noise, as discussed in the text. Note that the histogram for HFO represents an order of magnitude more data than the other fuels, due to practical constraints. Note also that differentdrBCranges size range are shown in (a) and (b) due to the fundamental difference of the two analyses (see text). The upper axis in (b) shows the predicted core-shell-Mie absorption enhancement for these coating thicknesses at the 780-nm wavelength of the CAPS PMssa. CAPS PMssa=Cavity Attenuation Phase Shift PM SSA monitor; BC=black carbon; rBC=refractory black carbon; HFO=heavy fuel oil. SP2=single particle soot photometer.
(e.g., Chen et al., 2005). They may be modeled accurately with core-shell Mie theory (Huang et al., 2012), which we have done in Figure S3. The cenospheres were modeled with a ratio of inner to outer diameters of 0.8 (the abscissa of Figure S3 is the outer diameter).
The Mie calculations (Figure S3) show that in the Rayleigh regime (diameter d < 30 nm) the predicted AAEBC ≈ 1 does not depend on the model, as expected. Outside of the Rayleigh regime (d > 400 nm), the
model becomes important; in our calculations the AAEBC ≈ 0. The calculated AAEBC ≈ 0 is much smaller than
our observed AAE(880,950) ≥ 1 (also shown in the figure), suggesting that the majority of BC absorption and therefore BC mass did not reside in unmeasured char particles.
Overall, the HFO rBC size distribution could be described by a bimodal lognormal fit with geometric mean
drBCand standard deviations (GMD and GSD) of 150 and 640 nm, and 1.0 and 0.56, for the two modes. These
lognormal fits imply that 44% of the total mass was likely above (versus 2% below) the particle size range detectable by the SP2 and were used to correct the total reported rBC mass. The corresponding SP2-mass correction factor was 1.46 ± 0.15. This uncertainty represents interexperiment variability and was propagated into the overall uncertainty. For unimodal lognormal fits to the diesel and MGO data, the correction factors were 1.247 ± 0.05 and 1.228 ± 0.05, respectively. These latter correction factors account for particles that were too small to be measured by the SP2.
3.1.2. External Mixing of rBC and OM/Sulfate
Figures 4a and 4b investigate the coating thickness on BC particles by analyzing the time-resolved SP2 scat-tering signals in two different ways. Figure 4a shows that the number fraction of particles with evidence of “thick coatings” (where the peak scattering signal occurs before particle incandescence, indicating the loss of a large volume of coating material due to heating) was negligible except for smaller DF particles. (Since no brC absorption was observed for DF, this exception does not influence any of the conclusions made in this study.) The remainder, “moderate or no coating,” describes particles where peak scattering occurred simulta-neously with incandescence. This delay-time analysis provides a relatively coarse picture of the mixing state of BC; more quantitative information is provided by the coating-thickness analysis.
Figure 4b shows the results of the SP2 coating-thickness analysis. For this analysis, only BC particles with spherical-equivalent diameter 240 ±20 nm were included, due to the need to optimize both counting
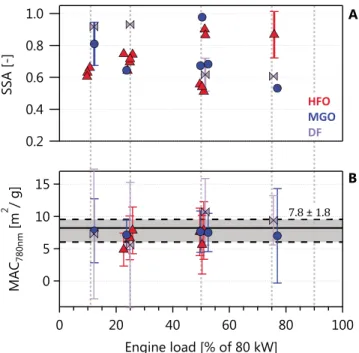
Figure 5. MAC and SSA for the three fuels as a function of engine load. No trend with engine power or fuel is apparent. Only three error bars are shown in (a) for clarity. The shaded area in (b) reflects a MACrBC,780nmof 7.8±1.8 m2/g (fit±standard error). SSA=single-scattering albedo; HFO=heavy fuel oil; MGO=marine gas oil; DF=diesel fuel; MAC =mass absorption cross section; rBC=refractory black carbon.
statistics and signal-to-noise in the SP2 detectors. Consistent with the delay-time analysis, the coating-thickness results show that the mean coating coating-thickness for HFO particles was negligible, whereas small amounts of coatings may have been present for MGO and DF. Negative coating thicknesses reflect particle-to-particle errors (biases) in the scattering measurements, which average to zero. Note that an order of magnitude more data were available for the HFO analysis than for the other fuels analysis. In all cases, the analysis indicates that the coatings were not thick enough to influence the optical properties of the BC (Liu et al., 2017).
Further analysis of independent size-resolved composition measurements for HFO (Corbin et al., 2018) support this picture. Ash (metal oxides and/or sulfates) is also expected in the HFO PM, as discussed in Corbin et al. (2018). However, with the measurements presented here, we can only infer that ash particles did not make up the majority of the total particle mass for either rBC or OM/sulfate particles.
The effective density measurements for the mobility size range 60–120 nm shown in Figure 3 also support our conclusion that the smaller mode in that figure consisted of externally mixed OM (and sulfate, in the case of HFO) . The effective densities (calculated as 6mp∕[�d3mobility], where mpis the APM-measured single-particle
mass and dmobilityis the DMA-selected diameter, as further described in the supporting information) are shown
by the inset circles in Figure 3. For MGO and DF, these densities should correspond to the material density of the OM in those fuels. Indeed, the measurements are in close agreement with the densities predicted from a published empirical relationship between the elemental composition and the density of OM (Kuwata et al., 2012). That parameterization showed a low bias of just 5% (standard deviation 2%) relative to the DMA-APM-CPC measurements.
3.1.3. Relationship of BC Light Absorption With SSA780 nmand Engine Load
BC light absorption was characterized according to the aerosol light absorption coefficient measured at 780 nm, babn,780nm, which was measured by the CAPS PMssa using the extinction-minus-scattering technique.
The measured extinction and scattering coefficients also provided the aerosol SSA (780 nm; Figure 5a). All three
fuels showed a range of SSA780 nm (from 0.5 to 0.9). The lower SSAs correspond to conditions where the
extinction-minus-scattering method results in a more accurate calculation of babn,780nm.
The ratio of CAPS babn,780nmto SP2 CrBCgives the MACBC,780nm(equation (3), as shown in Figure 5b. The observed
MACBC,780nmdid not vary substantially between engine loads and fuel types. The SSA780 nmdid vary
Figure 6. Measured absorption spectra for all engine test points, normalized to 880 nm. The black lines and shading indicate power laws (AAEs) and uncertainties of 2.2,1.7 ± 0.2, and1.0 ± 0.1, as labeled. All data are from the AE33 except the orange squares, which are MWAA measurements of filter samples (using a normalization factor of 0.96 to adjust from 850 to 880 nm based on an AAE=1.7; simultaneous AE33 measurements are highlighted with red squares). MWAA=Multiwavelength Absorbance Analyzer; HFO=heavy fuel oil; MGO=marine gas oil; DF=diesel fuel; AAE= Ångström exponent.
including the GMD (geometric mean diameter of the FMPS) and the ratio BC:nonrefractory PM. These quan-tities were explored because it was expected that the MACBC,780nmand SSA780 nmwould vary as a function of
aerosol composition (e.g., the mass fraction of BC), size (since scattering depends strongly on particle size), or mixing state (since internal mixing of BC with other material may result in absorption enhancements). Note that although the accuracy of the CAPS-estimated babn,780nmis expected to decrease with increasing SSA,
our data indicate that this accuracy was not a limiting factor: there was no statistically significant dependence of the MACBC,780nmon the SSA.
The lack of any such observed relationship indicates that the corresponding phenomena were not the main cause of variations in the SSA780 nm. Moreover, the fact that variations in SSA780 nmdid not correspond to
vari-ations in MACBC,780 nmis consistent with the aerosol containing a variable fraction of externally mixed BC.
We therefore hypothesize that variable amounts of externally mixed ash particles were the main cause of the variability in the SSA780 nm. Such ash particles were identified by electron microscopy in these samples
(Corbin et al., 2018), but more data would be needed to quantitatively evaluate this hypothesis.
The shading in Figure 5b shows the result of an uncertainty-weighted orthogonal-distance regression fit to a plot of babn,780nmversus CrBC(the shading shows the fit ±95% confidence interval; Figure S1). As there
was no apparent difference in MACBC,780 nmbetween different fuels, all data were fit simultaneously to yield
MACBC,780 nm = 7.8 ± 1.8 m2/g. Assuming an AAEBCof 1, this corresponds to a MACrBC,550 nmof 11.1 ± 2.6, a
factor 1.48 larger than the widely accepted MACBC,550 nm = 7.5 m2/g recommended by Bond and Bergstrom
(2006) for uncoated BC.
An increase in MAC due to so-called lensing effects may occur if rBC is internally mixed with substan-tial amounts of nonabsorbing material (Liu et al., 2017). However, our SP2 measurements indicate that much more internal mixing than observed would be necessary to explain a 48% lensing enhancement (Figure 4). The calculated absorption enhancement for a 240-nm rBC core is shown on the upper axis of Figure 4, using a Mie approximation. For HFO, a negligible enhancement is predicted. For MGO and DF, a maximum absorption enhancement of 10–20% is predicted. Further calculations verified that these enhance-ments change negligibly when the soot aggregates are represented as noninteracting monomer spheres, instead of volume-equivalent spheres (Liu et al., 2015). Considering the uncertainties associated with the coating-thickness and MAC data, we consider that the discrepancy between the calculated and apparent absorption enhancements is probably negligible for MGO and DF. For HFO, where our confidence is enhanced by a larger number of analyzed particles, we find that lensing does not explain the why the MACrBC,780 nmwas
Figure 7. (a) AAEs between 370 and 880 nm, (b) OM emission factors, and (c) brC MAC (referencing total OM) plotted against engine load for the three fuels. In (c), open symbols indicate the use of the median rather than the CAPS-PMssa-measured AE33 C value. Fewer MACOMdata points thanbabndata points are reported due to some missing
COMmeasurements. Note that the increase of the MAC at 11% engine load does not correspond to an increase of the OM emission factor. Note also the log scales. AAE=Ångström exponent; HFO=heavy fuel oil; MGO=marine gas oil; DF=diesel fuel; MAC=mass absorption cross section; CAPS PMssa=Cavity Attenuation Phase Shift PM SSA monitor; OM=organic PM; brC=brown carbon.
higher than expected. Further work is needed to clarify why this HFO MACrBC,780 nmwas higher than previously
reported values.
Some difference in MACrBC,780 nmfor HFO compared to the distillate fuels may have been anticipated due to
the presence of a large rBC mode in HFO PM (section 3.1.1). This was not observed. One may therefore hypoth-esize that all rBC particles consisted of soot aggregates, since the MACrBC,780 nmof a soot aggregate depends
primarily on the size of its monomers (Sorensen, 2001) and not on its overall size. However, as measurements on char particles are lacking in the literature, it is not clear that the MACrBC,780 nm(and other optical properties)
of small char particles would be sufficiently different from soot to be seen in Figures 5b and S1. Regardless of the physical interpretation, our data indicate that the anomalous size distribution of HFO PM did not lead to an anomalous MACrBC,780 nm. We note, however, that SP2 measurements were not available for the lowest
engine load test points, for which brC absorption appeared to be anomalously high.
3.2. Brown Carbon
In this section, we discuss the wavelength dependence and intensive properties of brC. The focus is on HFO PM, since brC was negligible in the other fuels.
We reiterate here that these calculations are numerically independent of the SP2 data discussed in section 3.1.1, as shown in the schematic diagram Figure 2. Uncertainties related to the larger mode of rBC particles measured in HFO PM by SP2 are therefore irrelevant to the following results. In particular, we used only the
babn,780nmmeasured by CAPS PMssa and the AAE measured by the AE33 to calculate kOM. The assumptions are
that AAEBC= 1 and that only BC absorbs at � > 700 nm. 3.2.1. Wavelength Dependence of Light Absorption
Figure 6 shows AE33 absorption spectra for all engine test points. The data are normalized to 880 nm to allow different concentrations to be compared. The distillate fuels (DF and MGO) show similar trends and are consistent with an AAE of 1 ± 0.1 down to 470 nm. At 370 nm, there is some evidence of a minor contribution (<20% of babnat 370 nm) of brC to light absorption for the distillate fuels.
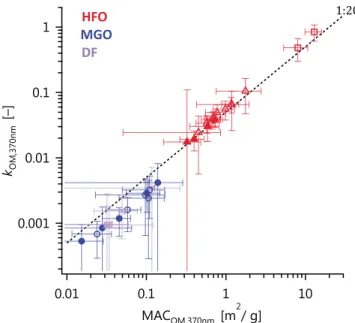
Figure 8. Retrieved OM imaginary refractive indices plotted against MAC at 370 nm. The two high-valued outliers (square symbols) represent 11%-load conditions (see Figure 7). The observed good correlation indicates that variability inkOMwas driven by variability in the OM properties (particularly engine conditions) rather than particle size or other Mie model parameters. OM=organic PM; MAC=mass absorption cross section; HFO=heavy fuel oil.
For HFO, the data are generally consistent with an AAE(370–950) of 1.7 ± 0.2. The shaded region in Figure 6 encompasses this range, showing that this AAE includes the majority of the data points while slightly under-predicting absorption at � < 500 nm. We hypothesized that the scatter in Figure 6 may be related to a varying mass fraction of BC (relative to OM and sulfate) but found this was not the case (Figure S4).
Figure 6 also includes MWAA measurements of light absorption of the filter samples. These spectral measure-ments provide additional confidence in the AE33 data, since the MWAA directly measures and corrects for light scattering from the filter sample. The MWAA data represent only three HFO filter samples due to limited sample availability but generally corroborate the AE33-measured AAEs.
3.2.2. MACOM,370
Figure 7c shows brC absorption at 370 nm, per mass of OM (MACOM,370) for all fuels as a function of engine load.
For cases in which the median AE33 C value was used, rather than a specifically calibrated C value, the data are shown with open rather than filled symbols. The upper panel, Figure 7a, illustrates the AE33-measured AAEs from which these MACs have been derived.
Figure 7c shows that the MACOM,370increased by an order of magnitude at the lowest engine load for HFO.
This increase did not correspond to a change in the overall OM emission factor EFOM, as seen by comparison
to Figure 7b, nor to a change in the sampled OM concentrations (not shown). Therefore, this change must be due to a difference in the chemical composition of the OM. (For this reason, we hypothesized that the less-volatile thermal-optical OC fractions would correlate with MACOM,370but found that the correlation was
poor (section S5).) The relative emission factors of polycyclic aromatic hydrocarbons (PAHs), including oxy-genated and nitrooxy-genated PAHs, have been reported to increase at low engine loads by Sippula et al. (2014). Such species have been connected to the chemical composition of the fuel (Rüger et al., 2015; Streibel et al., 2017). The optical properties are thus not adequately described by the lubricating-oil model proposed by Eichler et al. (2017), who only discussed engine emissions at 50% load.
3.2.3. Imaginary Refractive Index of OM, kOM,�
Based on the measurements described in the previous sections, a Mie model was constructed and fit to the data to obtain the imaginary refractive index of OM for this study, as detailed in section 2.5.
Figures 8 and 9 show the results of the Mie model fits. Figure 8 shows kOM,370as a function of MACOM,370 nm. The
two quantities are correlated because the main variations in model inputs were in OM mass concentration and light absorption, rather than particle size or density. Two extreme outliers have a kOM,370close to unity,
which is unusually high. We carefully inspected all input data for these outliers but found no errors. The kOM,370
Figure 9. Retrieved imaginary refractive indices as a function of wavelength, normalized tokOM,370 nm. Data where
kOM,�<0.005were omitted due to unreliable data (see error bars in Figure 8). Outlier type I refers to the high outlier at
660 nm; outlier type II refers to the two high-kOMcases shown in Figure 8. The labels�xrefer to power laws with
exponentx. A power law withxbetween−2and−4adequately describes the data. OM=organic PM; MAC=mass absorption cross section; HFO=heavy fuel oil; MGO=marine gas oil; DF=diesel fuel.
Figure 9 depicts the wavelength dependence of kOMby normalizing kOM,� to kOM,370for all data. The gray
shading and lines show the behavior that would be expected for a kOMAAE of 2, 3, and 4 (upper line, central
line, and lower line). The plot was filtered to only included points where kOM,�>0.005before normalization.
This threshold is based on the Monte-Carlo-estimated uncertainties shown in Figure 8 and resulted in the exclusion of all MGO and DF data.
Two types of outliers are noticeable in Figure 9. The first, “outlier I,” shows an anomalously slow decrease in
kOMwith �. The reason for this exception was not identified. The second, “outlier II,” corresponds to the two
high outliers in Figure 8. The kOM-versus-� trend for both of these type-II outliers appears reasonable and is
similar; compared to the other measurements the slope is more negative than expected. In other words, in addition to having higher absolute kOM,370these measurements also had a higher ratio kOM,370:kOM,660, which
is consistent with a true chemical difference in the type-II samples.
4. Discussion
4.1. Expected Differences Between Engines and HFO Samples
In general, the intensive optical properties of marine engine PM may vary between studies. In our present study, we have observed similar optical properties to those observed in the study described by Mueller et al. (2015), as discussed in detail in section S5. Further measurements are required to describe the degree to which engine-to-engine variability may influence these properties.
In addition, differences in fuel composition may influence marine engine PM optical properties. Since the molecular composition of HFO PM has been shown to be comparable with the molecular composition of HFO (Streibel et al., 2017), in a manner depending on engine load (Sippula et al., 2014), we hypothesize that the molecular composition of brC is also related to the molecular composition of the fuel. In support of this hypothesis, we note that Sippula et al. (2014) observed larger mass fractions of PAHs in HFO OM at lower engine loads, similar to our observation of increased MACOMat lower engine loads. Those authors suggested
that the PAHs in HFO PM represent unburned fuel. This picture is consistent with the nonabsorbing nature of the distillate-fuel PM samples, since neither MGO nor DF contain substantial levels of PAHs.
If PAHs in HFO are a major source of brC in HFO PM, then different engines may produce brC in a similar manner to one another. Thus, the extrapolation of the MACOMand kOMreported herein to other engines may
be justified, especially when using the relationship of OC3/OC with MACOM,370(Figure S5) to estimate light
Figure 10. Depiction of the importance of brown carbon absorption for a typical case at 50% load. Here brC is defined by the BC+brC approach as excess absorption after subtracting BC absorption via AAEBC,880 nm= 1. (top) Percent change in direct radiative forcing due to brown carbon, relative to a reference case of nonabsorbing organics. (middle) Contribution of organics and black carbon to overall absorption. (bottom) MACOMandkOMused for this analysis. MAC=mass absorption cross section; BC=black carbon; brC=brown carbon; AAE=Ångström exponent; OM=organic PM.
may lead to variability in the light-absorbing properties of the emissions, additional studies are warranted to constrain fuel-related variability in kOMand MACOM.
4.2. Summary and Implications of brC/OM Light Absorption
In the following, we summarize the results on brC absorption and provide an illustration of the potential radiative impacts of HFO brC.
The standard operating load for this engine is 50%, although engines frequently operate at lower loads to save fuel or in the presence of ice (Lack & Corbett, 2012). At 50% load, the mean kOM,370nmand corresponding SD
were 0.057 ± 0.027 (n = 5). At 25% load, the corresponding values were 0.034 ± 0.018 (n = 6). Considering the large variabilities, we recommend the combined mean, 0.045 ± 0.025, for modeling studies. According to Figure 9, kOM,�, may then be estimated as
kOM,�= (0.045 ± 0.025)(�∕370nm)−3, 370nm < � < 660 nm (6)
At the commonly used � of 550 nm, equation (6) gives kOM,550nm= 0.014 ± 55%. Compared to the kOM,550nm
values summarized by the review of Lu et al. (2015), this is a high value. For example, those authors recom-mended kOM,550nm= 0.015 ± 45% for lignite OM and kOM,550nm ≈ 0.03 for biomass-combustion OM with 10%
BC (a comparable BC fraction to our data). For HFO, Lu et al. (2015) recommended kOM,550nm= 0.006 ± 40%,
based on the extrapolation of studies of DF emissions to HFO. This is a factor of 2.3 smaller than our mea-sured value. Considering that we meamea-sured negligible brC for DF PM, this extrapolation is not valid and future studies should use equation (6) to estimate kOMfor HFO.
The very high OM fraction (approximately 90%) in HFO emissions makes brC light absorption especially impor-tant for this aerosol in spite of its kOM(at 25-50% engine load) falling within the range of previously reported
values (for other brC sources). This is demonstrated in Figure 10, where the Simple Forcing Efficiency (Bond & Bergstrom, 2006; Chen & Bond, 2010) has been employed. The figure illustrates the Direct Radiative Forcing (DRF) of a representative ship-exhaust plume over the planet’s surface. A wavelength-dependent mass scat-tering cross section of 2.3 m2/g at 780 nm and scaling exponent of 4 (see supporting information for details)
was used with a backscatter fraction of 0.1. For the 50% load case (inputs shown in lower panel), the figure plots the relative absorption of OM and BC (middle panel) and the estimated change in DFR (upper panel) when including brC absorption. The change in DRF is relative to the base case of nonabsorbing OM (equal OM mass, with kOMset to zero). Relative humidity effects have been neglected for simplicity. The DRF is highly
sensitive to the albedo of the surface below the aerosol; as such, two cases are shown: one for the case of fresh snow or cloud, one for the case of the dark ocean.
Note that OM absorption from HFO at � = 660 nm is ∼20% of the total. At this wavelength, brC absorption may have been expected to have dropped to zero (Laskin et al., 2015): HFO brC clearly absorbs farther into the red than expected. At � = 370 nm, the contribution of brC to the DRF increases to 18% for the over-snow case. Note that we have chosen a conservative example of 50% load and that MACOMwas much larger at lower loads
(Figure 7). The ability of brC absorption to influence the DRF of HFO-exhaust PM, particularly in high-albedo environments like the Arctic, should motivate modeling studies to assess the overall climate effects of HFO brC absorption.
5. Conclusions
We used in situ measurements of single-particle black carbon mass (via laser-induced incandescence), in situ aerosol light extinction and scattering coefficients, and filter-based measurements of Ångström absorption exponents, to reach several conclusions on the properties of BC and brC in emissions from an auxiliary-scale research ship engine. One residual fuel (HFO) and two distillate fuels (marine gas oil, MGO, and DF) were used. Overall, light absorption by OM in DF and MGO exhaust was found to be negligible, whereas absorption by OM in HFO PM was very significant. This result was not surprising considering the near black color of the HFO fuel (diesel is almost transparent) and the molecular similarity between HFO-exhaust OM and the fuel (Sippula et al., 2014; Streibel et al., 2017). In more detail, our conclusions are as follows.
1. Generally, BC was externally mixed from nonrefractory material (sulfates and organics) in the primary emis-sions. The BC size distribution for DF and MGO was a typical lognormal, whereas for HFO an apparent bimodal lognormal with very large rBC particles was observed.
2. The ratio of 780-nm light absorption coefficient with rBC mass gave a MACrBC,780 nmof 7.8 ± 1.8 m2/g from
SP2 and in situ absorption measurements for all three fuels.
3. The overall wavelength dependence of absorption (370 < � < 950 nm) for this PM can be generally described by an AAE of 1.0 ± 0.1 for MGO and DF and by an AAE of 1.7 ± 0.2 for HFO.
4. Considering the PM as a mixture of brC and BC with AAEBC = 1 (BC + brC model), only HFO was found
to contain significant amounts of brC, with MACOM,370 nm= 0.4 ± 0.2m2/g at typical operating conditions
of 50% load. At low engine loads (11%), MACs up to 10 m2/g were observed while OM emission factors
remained unchanged, indicating a fundamental change in the nature of the absorbing material.
5. Using a measurement-constrained Mie model, we retrieved wavelength-dependent imaginary refractive indices kOM,�for HFO of 0.032–0.066 (interquartile range). A parameterization was provided for kOM,�at
typical engine operating conditions (equation (6)). The reported kOMis large compared to previous values
reported for open biomass burning (Lu et al., 2015). Due to the high OM fraction in this exhaust (∼90%), OM absorption (brC) may contribute up to 50% of total absorption for HFO at 370 nm, and 20% at 660 nm. 6. A simplified calculation showed that accounting for brC in the radiative forcing of HFO PM may enhance the DRF by 18% at 370 nm and 50% load, and much more at lower engine loads. Climate models should therefore include this absorption when estimating the radiative effects of ship exhaust.
Although the emissions and light-absorbing properties of OM may vary between engines, between engine settings, and between HFO samples, our reported kOMand MACOMvalues provide a significant improvement
over previously available data.
5.1. Author Contributions
J. C. C. performed the initial data analysis and interpretation. H. C., M. G., I. E. H., G. M., and L. D. contributed significantly to data interpretation. M. Z., J. C. C., and M. G. operated and calibrated the SP2. S. P. and J. C. C. operated and calibrated the CAPS. G. J. operated the AE33 and provided its data, and L. D. analyzed the AE33 raw data. A. A. M., S. P., and J. C. C. operated and calibrated the AMS. J. C. C. performed the APM measurements. J. O. and B. S. planned and oversaw the experiments. A. S. H. P. and R. Z. initiated the study. J. C. C. wrote the manuscript, and all authors contributed to the writing.