A framework for the comparison of different EEG acquisition solutions
Texte intégral
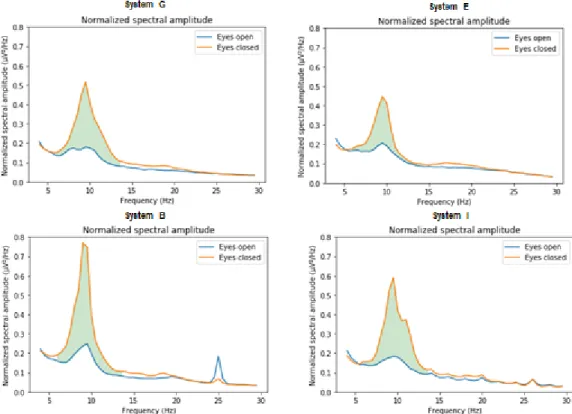
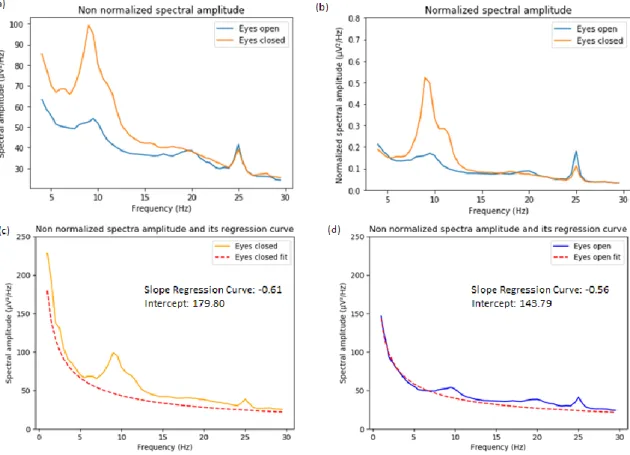
Figure

Documents relatifs
Mismatches between both sources and species with missing habit were finally manually checked and added by using information provided by the African Plant Checklist and
This led to our novel backstepping approach in [14] and [15] where pointwise delays are present in the feedback even if current output values are available, and then our work [11],
Indeed it remains to prove the existence of global approximate solutions to the system satisfying uniformly energy estimates, BD entropy and the gain of integrability à
According to the level of detail, snow models range from statistical snowmelt-runoff and degree-day methods using composite snow-soil or explicit snow layer(s), to physically-based
While there were no significant differences in classification of spectral features, the g.USBamp performed slightly better than the OpenBCI during the P300 speller task. The
The aim of this work is to compare in terms of performance, area and power dissipation, the implementations of complex FIR filters based on the traditional Two’s Complement
Pour cela, nous présenterons également, dans les deux premiers chapitres de cette thèse, la mise au point des réactions de condensation de Hantzsch et de Biginelli en décrivant
Analysis of clients and user's needs Life-cycle cost calculations Functional specifications of building Quality function deployment Technical performance specification
