HAL Id: halshs-01113600
https://halshs.archives-ouvertes.fr/halshs-01113600
Submitted on 5 Feb 2015HAL is a multi-disciplinary open access archive for the deposit and dissemination of sci-entific research documents, whether they are pub-lished or not. The documents may come from teaching and research institutions in France or abroad, or from public or private research centers.
L’archive ouverte pluridisciplinaire HAL, est destinée au dépôt et à la diffusion de documents scientifiques de niveau recherche, publiés ou non, émanant des établissements d’enseignement et de recherche français ou étrangers, des laboratoires publics ou privés.
Innovation in Services: Issues at Stake and Trends.
J Howells, B Tether, F Gallouj, F Djellal, C Gallouj, K Blind, J Edler, C
Hipp, F Montobbio, N Corrocher, et al.
To cite this version:
J Howells, B Tether, F Gallouj, F Djellal, C Gallouj, et al.. Innovation in Services: Issues at Stake and Trends.. [Research Report] European Commission. 2004. �halshs-01113600�
Innovation in Services: Issues at Stake and Trends. Studies
on Innovation Matters Related to the Implementation of the
Community" Innovation and SMEs Programme", European
Commission, Final Report, 2004.
Authors: J Howells, B Tether, F Gallouj, F Djellal, C Gallouj, K Blind, J
Edler, C Hipp, F Montobbio, N Corrocher, A Macpherson, D Banach.
Studies on Innovation Matters Related to the Implementation of the Community „Innovation and SMEs Programme‟
INNO-Studies 2001: Lot 3 (ENTR-C/2001)
Innovation in Services:
Issues at Stake and Trends
A study co-ordinated by
Jeremy Howells and Bruce Tether
ESRC Centre for Research on Innovation and Competition (CRIC)
Institute of Innovation Research, University of Manchester
2004
FINAL REPORT
© Commission of the European Communities, Brussels – Luxembourg, 2004
Legal Notice
Neither the European Commission, nor any person acting on behalf of the Commission, is responsible for the use which might be made of information in this report. The views expressed in this report are those of the authors and do not necessarily reflect the policies of the European Commission.
Contents
Forward and Acknowledgements ... 5
Executive Summary ... 7
1. Introduction ... 12
1.1 Why Services Matter and Are they Innovative? ... 12
1.2 Report Outline ... 14
2. Innovation in Services and Manufacturing Evidence from the „Innobarometer‟ 16 2.1 Introduction ... 16
2.2 Comparing Innovation in Services and Manufacturing ... 17
2.3 Conclusions ... 23
3 An Analysis of Services in the Second Community Innovation Survey... 25
3.1 Introduction and the Extent of Innovation in Services ... 25
3.2 The Sources of Innovation ... 26
3.3 Why Innovate? ... 36
3.4 Conclusions ... 38
4 Innovation and Change in Four Service „Sectors‟ Part 1 - Introduction ... 40
4.1 Introduction and Rationale ... 40
4.2 Road Transport and Logistics ... 44
4.3 Information Processing ... 49
4.4 Design and Related Activities ... 55
4.5 Care for the Elderly ... 59
5. Innovation & Change in Four Service „Sectors‟ Part 2 - Survey Findings ... 63
5.1 Introduction to the Survey and Methods Used ... 63
5.2 Road Transport and Logistics ... 66
5.3 Information Processing ... 73
5.4 Design and Related Activities ... 80
5.5 Care for the Elderly ... 87
5.6 Conclusions ... 94
6. Innovation & Change in Four Service „Sectors‟ Part 3 - Drivers of Innovation . 96 6.1 Introduction – Towards an Explanation ... 96
6.2 Conclusions ... 105
7. Barriers to Innovation ... 110
7.1 Introduction ... 110
7.2 Barriers to Innovation: Evidence from the Innobarometer ... 110
7.3 Barriers to Innovation: The 2nd Community Innovation Survey ... 114
7.4 Barriers to Innovation in Services: Evidence from „Four Sectors‟ Study 115 8. Policy Implications: Opportunities, Barriers and Other Issues ... 123
8.1 „In the Dark‟: Measurement and Related Issues ... 123
8.2 Human Capital and Training ... 124
8.3 Intellectual Property Rights and Service Innovation... 126
8.4 Barriers to Service Innovation and Growth ... 127
References and Bibliography ... 129
Forward and Acknowledgements
It should be noted that this is the Final Report produced by the Manchester coordinating team under Lot 3 of the Inno Studies Programme (ENTR-C/2001). It follows the prescribed format as outlined under: Section 6 „Expected Deliverables‟ of page 5 of Appendix I, Annex II; page 21 of Appendix I, Annex II; and page 1 of Annex III of the contract (INNO-03-01). A draft of this report was submitted for comment by the Commission and was revised in accordance with the comments received, following procedures prescribed and laid out on page 21 of Appendix I, Annex II.
The co-coordinators of the overall project and this report, Jeremy Howells and Bruce Tether, would like to thank first of all Elvira Uyarra, our research assistant, for all her tireless work on the survey and sector reviews. We would also like to thank Davide Borghese on a short term assignment from Bocconi University for his work on the case study material. Secondly, to all the partners and collaborators in the project. These include the key research partners from our four other „country group‟ teams: Faiz Gallouj, Faridah Djellal and Camal Gallouj from IFRESI, University of Lille, France; Knut Blind and Jacob Edler from the Fraunhofer Institute for Systems and Innovation Research (ISI), Karlsruhe and Christiane Hipp from the University of Hamburg-Harburg, Germany; Fabio Montobbio and Nicoletta Corrocher from CESPRI, Bocconi University, Milan, Italy; Alan MacPherson and Donna Banach from the Canada-United States Trade Center (CUSTAC) at the State University of New York at Buffalo, New York State, USA.
We must also thank members of our Multinational Expert Panel who provided valuable expert advice on the project: Francisco Carrerra, Massimo Pitis and Michael Thomson from the Bureau of European Design Associations (BEDA); Rinaldo Evangelista from CNR-ISRDS, Rome; Bettina Höfner from Deutscher Direktmarketing Verband, Wiesbaden; Ana Rico from the European Observatory on Health Care Systems, Madrid and Erasmus University, Rotterdam; Norman Rose from the Business Services Association, London; Jerry Sheehan from the Science and Technology Division of the OECD, Paris; Jon Sundbo from the University of Roskilde.
We are also grateful to EOS Gallup Europe for providing the Innobarometer dataset that is analysed in Chapter 2. The Innobarometer (or „Flash Eurobarometer‟) was commissioned by Directorate General for Enterprise, organised and managed by DG Press and Communication, and realised by EOS Gallup Europe. The analysis presented in Chapter 2 was undertaken by the CRIC co-ordinating team and the views expressed are those of the authors and do not necessarily reflect the views of the European Commission or EOS Gallup Europe.
Finally, we would like to thank Klaus Schwall, Nils Weller and Alex Talacchi together with Jose-Ramon Tiscar-Ramirez and Jean-Noel Durvy from the Innovation Policy Unit of the Directorate General for Enterprise (C1) for their support and encouragement throughout the study. We would also like to thank Ronald Mackay and Luis Rubalcaba also from D1 of the Directorate General for Enterprise for their policy advice and input, together with all the other Commission officials who commented on our research.
We would like to emphasise that the views expressed in the report are those of the authors and do not necessarily reflect the views of the European Commission or that of our research partners or collaborators.
Executive Summary
This is the Final Report produced by the Manchester coordinating team under Lot 3 of the Inno Studies Programme (ENTR-C/2001).
Study Background
1. The service sector has a dominant role in developed economies, accounting for roughly two thirds of employment and GDP. More particularly, services have been the only sector of the European economy that has generated jobs in the last two decades (Chapter 1).
2. The growing significance of services in the overall economy is also reflected in its increasing innovative activity, with services accounting for a greater share of overall R&D activity, patenting and trademark activity. Thus, by 2001, the European Union average for the share of services in Business Expenditure in Research and Development (BERD) had risen to 13%, although for some EU countries, such as Spain and Denmark, this was much higher at over 30% (Chapter 1).
3. The study analysed the data of three key surveys which have relevance for the study of innovation in services, namely: the Innobarometer survey and the second European Community Innovation Survey (CIS-2) and the „Four Sectors‟ survey, which was undertaken specifically for this project.
4. There are significant sectoral differences within services in terms of the activities they undertake and in the nature and extent of innovative activity. In order to overcome this great diversity in service activities, a fourfold typology of different service activities and conditions was used based on the different transformation processes: those services engaged in physical transformation processes (particularly of goods); those services involved in the transformation of information; those services engaged in the provision of knowledge-based services; and, those services which are aimed at the transformation of people (Chapter 4). The study in order to recognise the diversity of operating and market conditions of these four broad service activities, selected in turn four specific service sectors to represent them, namely: road transport and logistics; information processing (particularly call centre) activities; design and related activities; and, care for the elderly.
Main Findings I: Extent and Pattern of Innovation
5. In relation to the Innobarometer survey, it was revealed that a majority of firms surveyed in service sectors in 2002, did consider themselves as being involved in some form of innovative activity. The main difference was in the importance service firms placed of non-technological, organisational innovation compared with manufacturing firms (Chapter 2).
6. On the basis of CIS-2 data, collected for the period 1994-1996, a significant (over a third) proportion of service firms western European countries, were innovative
in that they introduced new services or methods to produce or develop new services (Chapter 3). The review of the CIS-2 data also revealed the diversity in the behaviour of service firms with respect to innovation not only between sectors but also within them. As such, there is considerable variety amongst „innovating service firms‟ that is not wholly explained by the nature of the particular sectors in which they operate.
7. The „Four Sectors‟ survey of service businesses also recorded a significant level of innovative activity.
Main Findings II: Drivers of Innovation
8. The results identified a fairly close link between traditional, direct forms of innovation („CIS type‟) with more indirect, disembodied forms of innovation („Non-CIS type‟) in those businesses that recorded such change. Nonetheless, there was a large and significant group of businesses in both Europe and America which are involved in a significant way with more indirect, disembodied and intangible forms of innovation, that have little or no involvement in the more traditional, direct forms („CIS type‟) of innovation.
9. All E.U. businesses rated quality of services provided as the most important factor contributing to business success (with an overall average score of 96%), whereas relatively few sought to compete mainly on cost.
10. The analysis found, as expected, that as organisations become larger, they are more likely to innovate.
11. European record a much more positive view about their level of innovativeness than U.S. firms. There are variety of reasons for this explanation, but one which is worth further exploration is that there is a difference in the strategies of firms between the US and Europe. Because the costs of establishing a business tend to be less in the US, it is possible that US firms tend to emphasise „fitness‟ rather than „adaptability‟. „Fit organisations‟ concentrate on doing an established set of activities and improving their performance at those activities. The pattern of improvement tends to be cumulative, and individual advances (or innovations) may not be recognised. By contrast, „adaptable organisations‟ are those that retain a greater ability to change into a different set of activities. These changes tend to be more discontinuous, and therefore more recognisable than continuous improvements. However, it was also acknowledged in the main text that, since the survey concentrated on „change‟, there could be the issue of „catch-up‟ by European businesses in terms of their record and attitude towards innovation. 12. As expected, those businesses seeking substantial growth were more likely to
engage in almost all types of innovation. It is notable that for each type of innovation, those organisations seeking substantial growth greater levels of innovativeness than that for those seeking modest growth.
13. The wider the geographical market that the businesses served the study found the greater likelihood that it would engage in all types of innovative activity.
14. There is evidence from the survey that beyond a fairly low threshold, the number of competitors does not have an especially important (direct) relationship with innovation. Indeed, the quality of competition is rather more important than the quantity of competition. Moreover, there are a few hints that a large quantity of competition can have a negative impact on innovation performance. As such, it is not the quantity, but the quality of competition that matters, plus how firms respond to the task environment they perceive.
Main Findings III: Barriers to Innovation
15. There was significant sectoral variation within services in terms of what is seen as significant barriers to innovation. Care should therefore be taken in making „blanket‟ statements about service innovation barriers and policies to rectify them. 16. On a broad level, there was indication from this survey that external conditioning
factors seem to be seen as more significant barriers to firm innovation than internal barriers, associated with, for example, the lack of qualified personnel and organisational rigidities.
17. However, the most significant of these external barriers were not so much to do with government action (such as regulation) or in-action (such as lack of support), but rather with customers being unwilling or unable to pay for new services and the costs and risks of innovation. These first and second rated barriers were also associated with the fifth rated barrier, that customers are unresponsive to new services once they are introduced. The lack of demanding and novelty seeking customers, who are willing and able to pay for upgraded, improved or novel services, seems to be a major and highly important barrier in service innovation which enterprises find difficult to overcome. There is clearly a role for public procurement in helping to energise the demand side of service innovation.
18. Regulation was rated as being the third most significant barrier hindering innovation, with it being of particular significance in the care for the elderly and road transport sectors. There is clearly an issue of over-regulation here, but on the positive side regulations can also stimulate innovative activity and greater efficiency (Chapter 8).
17. Lack of key staff was not rated highly, except for care for the elderly, and this contrasts with other studies which suggest human resource and training issues could be a significant barrier to innovation in service sectors.
18. Across the three sectors where comparisons are provided (road transport, information processing and design and related activities), E.U. businesses tended to rate barriers as being much more significant than their U.S. counterparts. This might indicate that E.U. respondents complain more or are generally more pessimistic in their attitude. However it could also point to more fundamental issues associated with the nature of the „task environment‟ they operate in, one which is too restrictive or nurturing enough to grow and develop in.
Policy Issues
19. Turning now to policy matters, insight into services and service innovation, and in turn policy formation, is still hampered by the lack of adequate basic statistics on services and service industries, which is a prerequisite for policy formulation, monitoring and evaluation.
20. Innovation statistics are still strongly biased to technological innovation, and measurement of output and factor and knowledge inputs in services is one of the key areas where initiatives are needed both within member states, but also on a European-wide and international level. This study, for example, has sought to compare some of the conditions of service innovation between the European Union and the United States, but has been hampered, amongst other things, by comparability of datasets. There have been important steps by the Community Innovation Survey to include non-technological innovation indicators in their survey, but more effort is still required.
21. However it is important to recognise that services are difficult to study and conceptualise. It is, therefore, not just about „simply‟ putting more money into funding the collection of more data and the creation of new and more comprehensive datasets. Much more effort needs to be done by the research community in developing new, but robust indicators, particularly in the area of organisational innovation, that can actually better articulate and measure what service innovation is about and not simply trying to adapt old modes of thinking in relation to innovation. This will require basic, long term funding in developing this conceptual and methodological research framework.
22. This all suggests that broad and homogenous training and skills based outside the firm will not be as effective in supporting service firms to be both more competitive and innovative as other more tailored schemes. Based on this review, training and skills support should be more specific, centred on the: peculiar needs of the sectors; the skills required; provided generally in-house; and, centred more on bespoke provision relating to the particular needs of the firm. 23. The implications for policy are less clear cut in relation to human resources and
training. The issue of human resources obviously raises the question of the division of responsibility between the state and the enterprise in the provision of an educated, skilled and motivated workforce. There was some evidence to suggest that firms that identified human resources as a problem were more likely to engage in training, but this „self-help‟ approach to the problem did not go far - about two days per employee. Policy needs to promote and stimulate the benefits of training and higher skills levels to service firms, but also needs to consider how such support might be approached. Here the evidence is much clearer. Relatively few firms thought that training should be provided by the public sector‟s education and training institutions, with a strong indication that the majority of firms thought the training to improve the qualifications of staff should be provided by the companies themselves.
24. In relation to intellectual property rights and policy, the European Commission needs to carefully monitor the situation. Firstly, for certain service sectors, such
as telecommunication services or computer services, intellectual property right issues are important and businesses in these sectors do feel that often existing property right mechanisms are not properly aligned to the needs of the firms concerned. There have been some shifts in the reach and nature of certain mechanisms such as the extension of patents to cover certain forms of software generation, but problems remain for firms operating in these knowledge intensive and high technology service sectors.
25. As all forms of services become more knowledge and innovation intensive, more service firms may be encountering problems surrounding intellectual property rights and the protection of knowledge surrounding aspects of the innovation process. As yet, this still may be of a low level, but given the general trends towards increasing levels of innovation may become more pervasive over time. 26. Despite the positive role of regulation it also does form a significant barrier
hindering innovation, particularly in certain sectors. We may need new and novel regulation in certain areas, but we need continued vigilance in reviewing and reducing regulatory burden in other areas. Regulation should not always be seen negatively in a European context, but equally it does form a burden to service industry which hinders innovation.
27. The study concludes by listing a number of specific policy suggestions designed to support service innovation in Europe (Chapter 8).
1.
Introduction
1.1
Why Services Matter and Are they Innovative?
The service sector has a dominant role in the developed economies, accounting for about two thirds of employment and GDP (Eurostat, 1999). According to Eurostat, “Services are the only sector of the European economy that has generated jobs in the last two decades.” Thus, between 1985 and 1997 approximately two-thirds of economic and employment growth in the business sector of Organisation for Economic Cooperation and Development (OECD) countries was due to growth in services. On average, value added created by business-related services constituted 54% of the total in 2001, compared with 34% for manufacturing industry (Commission of the European Communities 2003, 11). More specifically, knowledge-based „market‟ services accounted for 19% of total OECD value added in 2000 (OECD 2004, 48). In the United States of America (USA) alone, 76 million jobs were created between 1970 and 2000, with 70.6 million (93%) of these jobs in services (quoted in Beyers 2003, 3).
Services, therefore, not only comprise a large part of the economy, but also represent the main engine for growth within advanced industrial economies. However, despite this, little is known about the underlying dynamics and nature of the service sector compared with other sectors, such as manufacturing, mining and agriculture. What makes services such a dynamic growth sector in developed economies? How can it be stimulated and sustained in the future? What is the role of innovation in this process of dynamic change?
The report seeks to provide some answers to these issues, but also seeks to challenge some of our traditional assumptions about services and innovation. It argues that innovation in service activity remains a hidden dimension to its growth and success and that, moreover, service innovation plays an increasing role across the economy, stimulating change and supporting growth.
Certainly services have long been perceived as being non-innovative or technologically backward. Until the 1990s they were largely perceived as passive adopters of technologies developed by manufacturers. Throughout the 1990s and into the 21st century, it has become increasingly clear that this view is, at best, an oversimplification. Services are certainly major users of technologies, not least information and communication technologies (ICTs), but they often use these in creative rather than standard ways, and their needs for new functionality is a major stimulus to innovation by manufacturers and software creators alike. Even as users of technologies, therefore, services can be significant innovators.
Services are, however, not just innovators through the use of acquired technologies. The service sector is becoming an ever more important locus for innovative activity within the emerging „knowledge economy‟. „Knowledge Intensive Business Services‟ (KIBS), such as those involved in market research, design, engineering and technical services, are particularly important economic actors, and these services are increasingly becoming more proactive, generators of innovation, which are taken up and implemented by manufacturing enterprises. The British company ARM plc is a good example of this.
ARM designs, but does not manufacture, the computer chips that are at the heart of the vast majority of mobile phones sold the world over. This growing significance in innovative activity within services is reflected in the increasing share of services in overall R&D activity and patenting and trademark activity. In 2001, the European Union average for the share of services in Business Expenditure in Research and Development (BERD) had risen to 13% (Commission of the European Communities 2003, 21), although for some EU countries this was much higher.1 Studies using Community Innovation Survey (CIS) data have also shown that service activities are also generating more innovations (Chapter 3). Thus no longer can all service firms be regarded simply as passive consumers of technology or mere facilitators to manufacturing companies, where manufacturers are seen as the „real innovators‟.
It is also apparent that there is tremendous diversity amongst services, in their activities and innovation strategies. Some of the world‟s most knowledge intensive firms are involved in services, but not all services are knowledge intensive. Many services are highly routine, and employ people with low, rather than high, levels of educational attainment. However, innovation and technological change affects these services too. For example, telephone call centres, whereby customers use centralised telephone-based centres to gain access to services, have grown massively in recent years. According to one estimate, one percent of the UK workforce works in call centres, a proportion that has been rising rapidly. Telephone call centres, together with other back office business operations, are an organisational innovation that has been facilitated by technological change and call centres have, for example, transformed the UK insurance industry. However, further technological change also threatens these activities. On the one hand, there is the prospect of internationalisation. Already call centres have been established in India and elsewhere in the Third World – where labour is cheaper - to service the European markets. On the other, there is the threat of further technological change. For example, it is now possible for customers to directly supply the information required for insurance quotations over the internet. Through this „self-service‟ (one of the most profound and diffused innovation trends in services) the need for call centre staff is reduced and thus jobs only recently created are now being threatened.
In considering innovation in services it is therefore necessary to examine the full spectrum of service activities. All too often attention is restricted to the knowledge- insensitive „high end‟, associated with KIBS and similar knowledge or technically oriented activities. Arguably, at least, as much attention should be focused on the „low end‟, covering more routine services (such as retailing and distribution) which may not appear to be technologically dynamic, but which are nonetheless profoundly affected by technological and organisational change. It is also important to appreciate that it is these „lower end‟ services that engage the vast majority of people employed in services.
Although services are increasingly seen as the drivers rather than the facilitators in economic growth, and some services have become integral to the growth of the knowledge-driven economy, services and their innovation activities remain poorly understood. This lack of understanding is due to a variety of inter-linked factors. The dominant conceptual models of innovation have been hidebound by manufacturing-centric views of the innovation process, centred as these are on the production of
1 In Spain and Denmark the share was around 35% and 34% in the US. The share of services R&D as a percentage of total R&D in the OECD area has continued to rise from less than 5% of BERD in 1980 to 15% in 1997 (Howells 2001).
tangible artefacts. Innovation statistics, including those generated by the European Community Innovation Surveys (Chapter 3), have continued to reflect this production based (i.e., „technological product and process‟) view of the innovation process.
There have been various attempts to define service innovations and what makes them distinct from innovation in manufacturing. Although many of the earlier studies tended to take a „technologist‟ approach, focusing on the introduction of artefact, hardware-driven technologies and systems into service firms and organisations, more recent studies have sought to highlight the distinctiveness of service innovation. These „service-oriented‟ approaches have sought to move away from what might be seen as merely adapting manufacturing based innovation models centred as these are on technological innovation. Instead, these new approaches have focused on the peculiarities of service innovation, revolving around non-technological, disembodied innovations, and how this might lead to new conceptualisations of innovation processes in relation to service activity. Latterly, more „integrative‟ perspectives have sought to stress that service innovations include both technological and non-technological innovations, such as organisational and relational change, and such approaches seek to stress that human and organisational capabilities are also important in many service innovations (Van Ark et al., 2003). There is also a recognition of the convergence of goods and services in both their production and consumption (Howells, 2004a; 2004b). This also serves to highlight the fact that using existing approaches to identifying innovations, even service innovation by manufacturers is overlooked. With traditional innovation measures, the more disembodied and tacit forms of knowledge creation and innovation generation tend to be neglected, despite these being the very forms of innovation that tend to be particularly important in services, and especially amongst KIBS activities, but also in more routine services such as retailing and distribution.
Because service innovation has largely been overlooked by surveys, service innovation has in turn had „low visibility‟. This has meant that academics and innovation policymakers alike have continued to neglect services as a policy field, and few funds have been provided to improve the understanding of innovative activity in the service sector. Even for this reason alone, the current study marks an important step forward. It represents a valuable opportunity to research, and provide policy relevant insights on, innovation in services. The study therefore aims to improve the insight into the innovative process within services, building on a number of studies that have been undertaken to emerge in this area, but also through the undertaking of original research.
1.2 Report Outline
We begin with an overview of innovation in services using two existing data-sets. In Chapter 2 we compare the extent and orientation of innovation in services and manufacturers across Europe using the Innobarometer survey. In Chapter 3 we draw on the second European Community Innovation Survey (CIS-2) and look primarily at patterns of innovation within services, highlighting in particular how these patterns vary within and between various service „sectors‟.
In Chapters 4, 5 and 6 we report the results of the original research undertaken for this study. Chapter 4 introduces the four „sectors‟ that were analysed for this study. These „sectors‟ were: road transportation and logistics; information processing; care for the
elderly; and design. In Chapter 4, we provide an overview of these activities and outline, using case studies some of the innovations that have been introduced within them. Chapter 5 then presents the findings of the questionnaire survey which was undertaken for this study. The results pertaining to each of the sectors are outlined in turn. Chapter 6 then attempts to draw the evidence together, through the use of multivariate statistical methods, to examine the „drivers of innovation‟ in services.
Chapter 7 looks at the empirical evidence concerning the factors hampering innovation in services. This chapter draws on evidence from the Innobarometer, the second European Community Innovation Survey, and the „Four Sector Survey‟ which was undertaken for this project.
Chapter 8 concludes the report with a summary of the findings and an outline of policy related suggestions.
2.
Innovation in Services and Manufacturing
Evidence from the „Innobarometer‟
2.1 Introduction
In this chapter, we examine the evidence on the extent and patterns of innovation in service firms, in comparison with manufacturers, as these were reported by managers in over 3,000 European firms to the „Innobarometer‟ of 2002. The „Innobarometer‟ was a telephone survey, undertaken for the European Commission by Gallup Europe during February 2002. The 3,014 European enterprises which participated all had 20 or more employees and the surveying was stratified: by country; by enterprise size (20-49 employees; 50-249 employees; and 250 or more employees), and by activity (construction, industry, services and trade).2 The person interviewed was “the boss”, that is the person in charge of general management, or one of the highest level managers in a financial, marketing or commercial function.3
In contrast to the European Community Innovation Surveys (Chapter 3), the „Innobarometer‟ is intended to be more of an „opinion poll‟ than a scientific survey, and there is reason to believe that more innovative firms, or at least those firms that perceive themselves to be more innovative than the average, participated in the survey. Thus 60% of the respondents rated their company “above average” compared with their main competitors with respect to innovation performance (including 13% who declared their company to be “well above average”), whilst only 9% admitted they were “below average” (including 1% who declared they were “well below average”). The remainder either declared the firm was “average” (28%), or did not express a view (3%). There are two obvious explanations for these findings. Firstly, there may be an inherent bias in the participation of firms in the survey towards more innovative enterprises. This is understandable as it is a voluntary survey and so a firm that has engaged more fully with innovation would be more likely to be willing to discuss this with researchers than one that had avoided innovation. Secondly, there may a level of self delusion amongst the respondents – quite simply they may think their firms are better at innovation than they really are.4
Given the above, we will examine the results of the Innobarometer as a simple sample, divided between two different activities: manufacturing and services. The manufacturing sector has been much more heavily studied with respect to innovation, and we include it here primarily as a benchmark against which to compare service firms. However, both
2 This stratification generated 180 (15 x 3 x 4) cells, within which sampling was random. Because of the approach followed, larger enterprises and those in smaller European countries, were over sampled.
3 For further details, see „Flash Eurobarometer 129 – Innobarometer‟, Gallup Europe, October 2002.
4 A third less likely and more complex explanation is that rather than focus on the firm‟s overall innovation performance the respondents had in mind only the dimensions of innovation with which they engaged. For example, a firm may have focused on product innovation, whilst its competitors may have focused on process or organisational innovation. From the firm‟s perspective it is reasonable to perceive that its innovation performance is superior to that of its competitors, particularly if it associates innovation primarily with product innovation. There may be further explanations, but it is impossible to disentangle these and overall we suggest that there is probably a bias in the response towards firms that are more active in innovation.
manufacturing and services are highly heterogeneous in the activities they cover. As analysed here, the „service sector‟ includes firms engaged in: wholesale and retail trade, transport, communications, financial services, and various personal and business services.
2.2 Comparing Innovation in Services and Manufacturing
The Focus of Innovation Activities
We begin with the types of innovation activities the firms engaged in. The firms were asked about whether their innovation efforts were concentrated on: 1 – „the development of new products‟; 2 – „the development of new production processes‟; or 3 – „the development of new organizational changes‟. A maximum of two of these could be identified. Amongst manufacturers, over half indicated their innovation efforts were concentrated on developing new products, and a similar proportion concentrated on developing new processes (Table 2.1). Meanwhile, a quarter of the manufacturers identified organisational changes. The patterns for services was different: 34% of service enterprises focused on developing new products, and 24% concentrated on developing new production processes, but over half (54%) claimed the focus of their innovation efforts was organisational change. This is a large and highly significant difference. Another notable difference is that a greater proportion of service firms were unable to identify the focus of their innovation efforts than were the manufacturers (12% compared with 5%).
Table 2.1 Innovation Type by Sector
Manufacturing Services Statistically Significant Difference?
New Products 54% 34% (at 1%)
New Processes 56% 24% (at 1%)
Organizational Changes 25% 53% (at 1%)
Figure 2.1 shows these results in greater detail. The figure shows that over 70% of manufacturers focused their innovation efforts on developing new products and/or new processes (and not organisational changes), whilst only 8% failed to identify either of these and instead focused on organizational change alone. In services, by contrast, 35% identified new products and/or new production processes (and not organisational changes) as the main thrusts of their innovation activity, whilst 37% claimed to have focused on only on organisational change. Other surveys of innovation, most notably the European „Community Innovation Surveys‟ (CIS) do not ask about organisational innovation, and this omission will clearly reduce the apparent innovation rate in services much more significantly than in manufacturing. It is therefore important that a methodology be developed to include organisational innovation in future versions of the Community Innovation Surveys.
Figure 2.1 Innovation Orientation by Sector Product (PD) Only Process Only (PC) Organizational Only (ORG) PD & PC PD & ORG PC & ORG
PC PC & ORG ORG
Key Manufacturing 22% 23% 11% 8% 5% 26% PD PD & PC PD & ORG DK / None = 5% Services 10% 6% 8% 37% 9% 19% PD PC ORG PD & PC PD & ORG PC & ORG DK / None = 12%
Manufacturing : Product & Process = 71% Services : Organisational + = 54%
Figure 2.2 The Significance of New Products in Total Sales
0% 10% 20% 30% 40% 50% 60% 70% 80% 90% 100%
Manufacturing Services Manufacturing Services All Firms Firms that Focused on Product Innovation
Pr o p o rt io n o f C o m p an ie s None 1% to 5% 6% to 10% 11% to 20% 21% to 50% 51% to 99% All (100%)
The Contribution of Innovative Products to Sales
About 80% of manufacturers declared at least some of their income was derived from new or renewed products and services introduced over the last two years, but the proportion of service firms making this claim was only slightly lower, at about 75%
(Figure 2.2).5 Moreover, the proportion of firms deriving a high proportion of their income from new or renewed products and services was similar across both sectors, with about 30% of the firms in each declaring that over 20% of their income was from new products or services. Amongst those firms that declared they had focused all or part of their innovation efforts on new product developments, about 40% of the respondents in both sectors declared at least 20% of their income was due to new or renewed products or services. The absence of a significant difference in these distributions between manufacturers and service firms is interesting, as some have argued services find it more difficult to attribute sales to „new products‟ than is typically the case amongst manufacturers. The evidence of the Innobarometer suggests this is not the case.
The Significance of Innovation in Investment
Innovation is also often a significant driver of investments. Almost 90% of the manufacturing firms declared that some of their investments were dedicated to innovation. Although this proportion was again slightly lower amongst service firms (83%), it is clear that in both sectors innovation drives at least some of firms‟ investments (Figure 2.3).6 However, the link is usually partial, and often indirect. In both sectors, the proportion of firms that declared that all of their investments were linked to innovation was small, at 9% amongst manufacturers and just 4% amongst service firms. Perhaps surprisingly, there was not a large difference in these patterns amongst the firms that focused on process innovation in comparison with the full sample of firms.
Figure 2.3 The Significance of Innovation in Investments
0% 10% 20% 30% 40% 50% 60% 70% 80% 90% 100%
Manufacturing Services Manufacturing Services All Firms Firms that Focused on Process Innovation
Pr o p o rt io n o f C o m p an ie s None 1% to 5% 6% to 10% 11% to 20% 21% to 50% 51% to 99% All (100%)
5 This excludes firms that were unable to answer this question. The proportion unable to answer the question was greater amongst and service (14%) firms than amongst manufacturers (9%). 7 The following factors were suggested: 1 – „technological advance and Research and Development competencies‟; 2 – „efficient production methods and making the best use of resources‟; 3 – „flexibility and adaptability of production to market needs‟; 4 – „leadership in finding out and exploiting new market trends‟; 5 – „good co-operation practices with suppliers, customers or trade associations‟; 6 – „qualifications of the staff and their professionalism‟.
Strengths in Innovation
The survey asked the firms to identify the two most important factors contributing to their „strengths at innovation‟.7 Amongst manufacturers, adaptability to meet market needs was the most widely identified factor, highlighted by almost half the respondents. By contrast, amongst service firms, staff qualifications and the professionalism of staff was the most widely recognised factor, this being identified by more than half the service firms. This is a notable difference and reflects the importance of the „human element‟ in service provision and innovation which has been highlighted by earlier studies. Also notable here is the extent to which services recognise „co-operation practices within their supply chain‟ as a key strength of innovation. Many commentators have highlighted the highly cooperative mode of innovation in services, and this finding supports that contention. It is however notable that over a third of manufacturers also highlighted „co-operation practices within the supply chain‟ as one of their (two) strengths at innovation. Despite the attention paid to R&D, technological advance and R&D competencies it was either the least or the second least likely of these factors to be identified in both manufacturing and service sectors. Thus, it was identified by less than one in five manufacturers, and by an even smaller proportion of the service firms (Table 2.2). Most firms, therefore, be they manufacturers or service firms, consider that their strengths in innovation do not rely on R&D activities. Notably, however, those that did identify R&D competencies as one of their key strengths in innovation were more likely to regard their innovation performance as superior to that of their competitors.8
Table 2.2 Strengths in Innovation by Sector
Manufacturing Services Significant Difference?
Adaptability to Market Needs 48% 30% (at 1%)
Staff Qualifications and Professionalism 37% 54% (at 1%) Co-operation Practices within Supply Chain 35% 43% (at 1%)
Efficient Production Methods 25% 13% (at 1%)
Technological Advance & R&D
Competencies 19% 13% (at 1%)
Leadership in Market Trends 12% 18% (at 1%)
7 The following factors were suggested: 1 – „technological advance and Research and Development competencies‟; 2 – „efficient production methods and making the best use of resources‟; 3 – „flexibility and adaptability of production to market needs‟; 4 – „leadership in finding out and exploiting new market trends‟; 5 – „good co-operation practices with suppliers, customers or trade associations‟; 6 – „qualifications of the staff and their professionalism‟. 8 Amongst manufacturers, 28% of those that identified R&D as a strengths claimed their innovation performance was well above that of their competitors, compared with 10% amongst those that did not identify this factor, whilst only 4% of those that identified R&D as a strength admitted their innovation performance was below that of their competitors, compared with 13% of those that did not identify this factor. The corresponding figures for service firms were: 26% versus 13% and 1% versus 8%.
2.2.5
Engagement in Training
Perhaps surprisingly, given the significance of staff qualifications and professionalism as a „strength at innovation‟, there is little evidence that services engage in more training activities than manufacturers. As Figure 2.4 suggests there is little difference between manufacturers and service firms in their commitments to training, although within each sectors there was considerable variation in firms commitments to training.
We will explore further issues related to accessing human capital and training in Chapter 7, as the Innobarometer found this was one of the most widespread barriers to innovation in services. Suffice to say now that whilst service firms recognise this as a problem area, they are often reluctant to make significant commitments to training. This is an area where policymakers should consider interventions, and we will suggest a policy measure in Chapter 8.
Figure 2.4 Commitments to Training by Sector
0% 5% 10% 15% 20% 25% Manufacturing Services Pr o p o rt io n o f C o m p an ie s
No training undertaken One (training day per employee) Two Three Four / Five 6 to 10 11 to 25 Over 25
Means of Accessing New Technologies
The firms were asked to identify the most important ways by which they accessed new technologies9 (Table 2.3). The survey found that co-operations within the supply-chain (i.e., with suppliers and/or customers) was the most widely used means of accessing advanced technologies amongst both manufacturing and service firms. The use of co-operations is interesting here, as it suggests the co-development of technologies rather than the acquisition of standard, „off the shelf‟ technologies. As such, it indicates services are not just passive adopters of technologies. The acquisition of new machinery and equipment was, however, the second most widely used route in both sectors, whilst
9 Each respondent could identify up to two of the following: 1. – „through acquiring machinery and equipment‟; 2 – „through co-operations with customers or suppliers‟; 3 – „through conducting in-house R&D‟; 4 – „through co-operations with universities or R&D specialists‟; or 5 – „through the acquisition of external intellectual property (such as by licensing in)‟.
the conduct of in-house R&D was the third most widely used route, although this was considerably more widely used amongst manufacturers (44%) than amongst service firms (26%). R&D focused co-operations were also significantly more common amongst manufacturers than amongst services enterprises (17% versus 10%). Finally, acquiring intellectual property (such as licensing is) was slightly more widely used by service enterprises than by manufacturers, although in both sectors this was amongst the least used routes to access new or advanced technologies.
Three further points can be made from these findings. Firstly, whilst co-operations are important to services, they are also widespread amongst manufacturers – this is not a mode of innovation largely confined to services. Secondly, the adoption of new technologies is not more important in services – services are in general no more likely to be „passive adopters of technology‟ than manufacturers (cf. Pavitt 1984). Thirdly, whilst R&D does appear more important amongst manufacturers, it is not insignificant amongst services.
Table 2.3 Innovation Type by Accessing of New Technology
Manufacturing Services Significant Difference?
Co-operations within Supply Chain 54% 63% (at 1%)
Acquiring machinery or equipment 44% 39% (at 5%)
Conducting in-house R&D 44% 26% (at 1%)
R&D focused Co-operations 17% 10% (at 1%)
Acquiring IP (e.g., Licensing-in) 7% 11% (at 1%)
Engagement in Co-operation
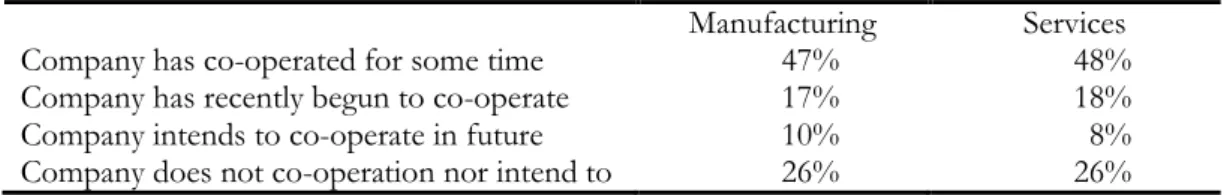
The questions concerning firms‟ „strengths at innovation‟ and their means of accessing new technologies have highlighted the significance of co-operations (particularly within the supply chain), but the questionnaire also asked the firms directly about their engagement in co-operative activities to launch new products. This found that in both sectors, almost half of the firms had engaged in co-operations for „some time‟, whilst in both sectors around 17% had recently begun to co-operate, and around 10% declared that they intended to co-operate in the future. The remaining quarter did not co-operate and did not intend to co-operate in the future (Table 2.4). These patterns are strikingly similar and again strongly suggest that the „co-operative mode‟ of innovation which is widely attributed to services is also commonplace amongst manufacturers. Also similar were the distributions regarding the extent to which firms thought that co-operations would or would not be useful for innovation in the future (Table 2.5).
Table 2.4 Cooperation by Sector and Innovation Type
Manufacturing Services
Company has co-operated for some time 47% 48%
Company has recently begun to co-operate 17% 18%
Company intends to co-operate in future 10% 8%
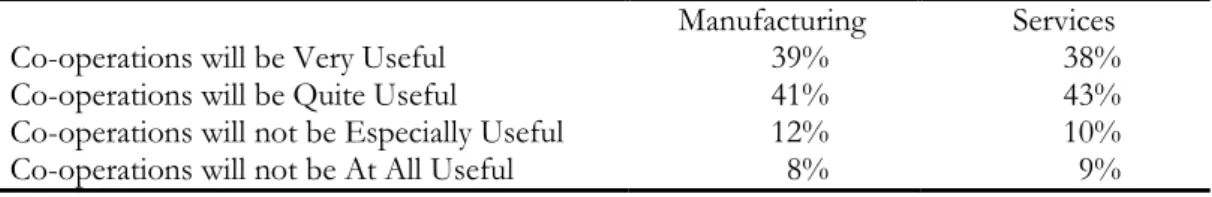
Table 2.5 Expectations about the Future Importance of Co-operations
Manufacturing Services
Co-operations will be Very Useful 39% 38%
Co-operations will be Quite Useful 41% 43%
Co-operations will not be Especially Useful 12% 10%
Co-operations will not be At All Useful 8% 9%
Future Markets and Cooperative Profiles
The survey also asked the firms were asked about how they expected markets to develop with respect to their receptiveness to innovative products in coming years. Amongst both manufacturers and service firms, most companies expected markets to become more receptive to innovation, although about three in ten companies expected markets to remain unchanged, and one in ten expected markets to become less receptive to innovation (Table 2.6). This expectation that innovation will become more important in the future is reflected in the increasing emphasis placed on member state governments in the European Union and national governments towards supporting innovation policy, though as noted later in Chapter 8 this should be extended more towards including service as well ass manufacturing industry.
Table 2.6 Future Markets for Innovative Products
Manufacturing Services Markets will become more receptive to
innovative products in coming years. 58% 61%
Markets will remain unchanged in their
attitude to innovative products 33% 30%
Markets will become less receptive to
innovative products in coming years. 9% 9%
2.3 Conclusions
In this chapter, we have used the Innobarometer to examine the extent of innovation in services and to make some simple comparisons with manufacturers. In conclusion, we emphasise the following points:
1. The significance of organisational innovation in services. The finding that over a third of the service firms interviewed stated that their only focus on innovation was in the form of organisational change means that this form of innovation needs to be investigated much more fully. By contrast, a much smaller proportion (8%) of manufacturers focused only on organisational change. The exclusion of organisational change from the Community Innovation Survey is an important bias in that survey against forms of innovation that appear more prevalent in services than amongst manufacturers. The absence of organisational change from these types of survey will therefore reduce the apparent innovation rate in services relative to manufacturers.
2. Aside from the significance of organisational change, the other striking difference between services and manufacturers was in their „strengths at innovation‟. In particular, service firms were more likely to emphasise their staff qualifications and professionalism than were manufacturers. This points to the high importance of human capital and skills in services and service innovation. 3. However, these differences aside there were a significant number of similarities in
the pattern of findings for services and manufacturers. The extent of operations, for example, was widespread in both sectors, suggesting co-development, with neither sector dominated by the passive adoption of technologies. Also, whilst R&D activities were more widespread amongst manufacturers, they were not insignificant in services. They were also similar patterns in terms of the impact of innovation on sales, and with regard to the significance of investments for innovation. All these similarities suggest there is no „great divide‟ between manufacturers and service firms with respect to innovation.
4. This said, we emphasise the high degree of diversity in the responses of both manufacturers and service firms to the Innobarometer survey. This diversity is wholly to be expected, as not only do both of these „sectors‟ embrace a wide variety of different activities, but within each activity firms have different resources and attitudes to innovation. We will explore this diversity of behaviours in services (in relation to innovation) in the next chapter, which draws on an analysis of the second European Community Innovation Survey (CIS-2).
3
An Analysis of Services in the Second Community
Innovation Survey
3.1 Introduction and the Extent of Innovation in Services
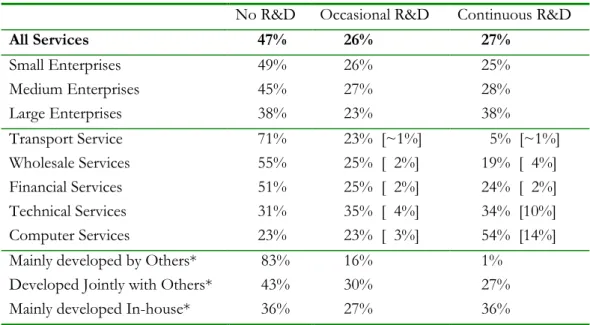
This chapter provides a review of findings from the Second European Community Innovation Survey (CIS-2) which covered innovative activities within service enterprises in 13 western European countries over the 1994-1996 period.10 The analyses is confined to the specific issues or questions posed in the CIS survey, and aspects of innovation, such as organisational change, which were not included cannot - for obvious reasons - be examined. Whereas the previous chapter was largely oriented to examining innovation in services in comparison with manufacturers, here our primary aim is to start „unpacking‟ services and examining the diversity of innovation behaviours within and between different service „sectors‟.The first issue concerns the extent to which services engage in (technologically) innovative activities.11 It is apparent that the proportion of „innovators‟ varied significantly between sectors, with only a quarter of transport service firms, and a third of wholesalers, introducing new services or methods to produce or deliver them, compared with 44% of technical service firms, almost half of financial service firms, and two thirds of computer service firms (Table 3.1). Such differences are to be expected, as some services (such as transport services) are engaged in much more stable activities – and provide a much more stable set of services – than others (such as computer services), amongst which innovation is more continuous and central to competitiveness. There is also significant variation between computer service engaged in innovative activities. This perhaps, overall, indicates that a substantial proportion of firms engage in activities within which „discrete innovations‟ are difficult to identify. Significantly, the fact that a firm declared it did not „innovate‟ does not necessarily mean that it did not invest in new technologies. Further analysis on the UK data (Tether 2001) shows that many of the „non-innovators‟ introduced new technologies, such as e-mail and Internet access.
From studies of manufacturing, it has become customary to expect the propensity to innovate to increase with firm size. This has been explained by large firms tending to engage in more activities, and thus having greater scope for innovation (Sirilli and Evangelista 1998). This pattern is found for most of the service sectors covered by the CIS-2 data, but not, interestingly, for computer services where small firms appear as likely to innovate as large firms. In general, there also appears to be a weaker relationship between firm size and innovation in services than is commonly found for manufacturing, suggesting there are fewer economies of scale. This weakness of economies of scale would help explain the lower concentration of most service activities, except finance, as compared with manufacturing.
Table 3.1 Proportion of Innovating Enterprises
10 This review is based on research by one of the authors of this report and further details of the study are provided in Tether et al. (2001) and Tether (2003).
11 The CIS-2 approached this by asking the firms: „Between 1994-96, has your enterprise introduced onto the market any new or significantly improved services, or methods to produce or deliver services?‟ This is the basic „innovation question‟, which was accompanied by a rather long and convoluted definition of „technological innovation‟.
Innovating Enterprises1 Enterprises with
Innovative Activities2
All Small Medium Large All Small Medium Large
All Services 36% 33% 41% 66% 41% 38% 45% 70% Transport 24% 22%* 33%* 44%* 29% 27%* 35%* 50%* Wholesale 32% 33%* 34%* 50%* 38% 40%* 36%* 54%* Technical 44% 43%* 57%* 58%* 52% 52%* 62%* 69%* Financial 48% 39%* 53%* 82%* 52% 41%* 55%* 85%* Computer 65% 64%* 66%* 65%* 68% 67%* 67%* 67%*
1 – ‘Innovating enterprises’ are those that introduced a new service or methods to produce or deliver new services in 1994 – 96. 2 – ‘Enterprises with innovative activities’ includes both innovating enterprises and enterprises with incomplete or unsuccessful innovation projects undertaken in 1994 – 96. Small – Enterprises with 10 to 49 employees; Medium – Enterprises with 50 – 249 employees; Large – Enterprises with 250+ employees. * Due to restricted data availability, these results are based on findings from 6 countries (France [not wholesale], Germany, Ireland, Norway, Portugal. Sweden and the UK) rather than all 13 countries.
Unfortunately, one of the weaknesses of the CIS-2 is that it did not ask the firms that did not innovate why they did not innovate. It would be especially interesting to know how firms that are active in highly innovative sectors survive without innovating. These questions were not investigated, and instead the remainder of the survey addressed only the „innovators‟. Another weakness of the CIS-2 survey is that it did not ask about the impact of the innovations on the firm, for example in terms of the percentage of turnover due to new services. Both of these problems have been addressed and rectified, at least to some extent, in the third Community Innovation Survey.
3.2 The Sources of Innovation
The fact that a firm claimed to have „innovated‟ need not mean it developed its own innovation(s). The questionnaire asked the „innovators‟: „who developed these services or methods?‟12 According to the findings (Table 3.2), about half the firms claimed that they had mainly developed their own innovations, with a third declaring the innovations were developed jointly with others, and about a fifth admitting they were mainly developed by others.13 These proportions differed significantly between sectors, with the external development of innovations being most common in transport services and least
12 It should be noted that only three responses were available: „mainly other enterprises or institutes‟; „your enterprise together with other enterprises or institutes‟; or „mainly your enterprise‟. This might be an oversimplification, for the answer can be a matter of perspective, particularly if the „innovation‟ is be based on an idea, the implementation of which required the adoption externally developed technologies. Is such an „innovation‟ found in the idea or the technology required for its implementation, or both? Another limitation is that for innovators that involved external enterprises or institutes, the type of organisation(s) (i.e., customers, suppliers, etc.) involved was not detailed.
13 These findings treat each „innovator‟ equally, but it is possible that if the significance of the innovations introduced were taken into account (Tether 1998), then the significance of these different sources might change. In particular, the significance of jointly developed innovations might be greater, because „higher levels‟ of innovation activity tend to involve greater interaction and collaboration between firms (Tether 2002).
frequent in computer services. The pattern for the internal development was roughly the reverse of this, whilst that for the joint development of innovations varied less, but was greatest amongst financial services.
Table 3.2 Sources of Innovation
All Transport Wholesale Financial Technical Computer
Mainly by Others 18% 28% 16% 21% 15% 9%
Jointly with Others 32% 28% 32% 37% 31% 26%
Mainly In-House 51% 43% 51% 42% 54% 65%
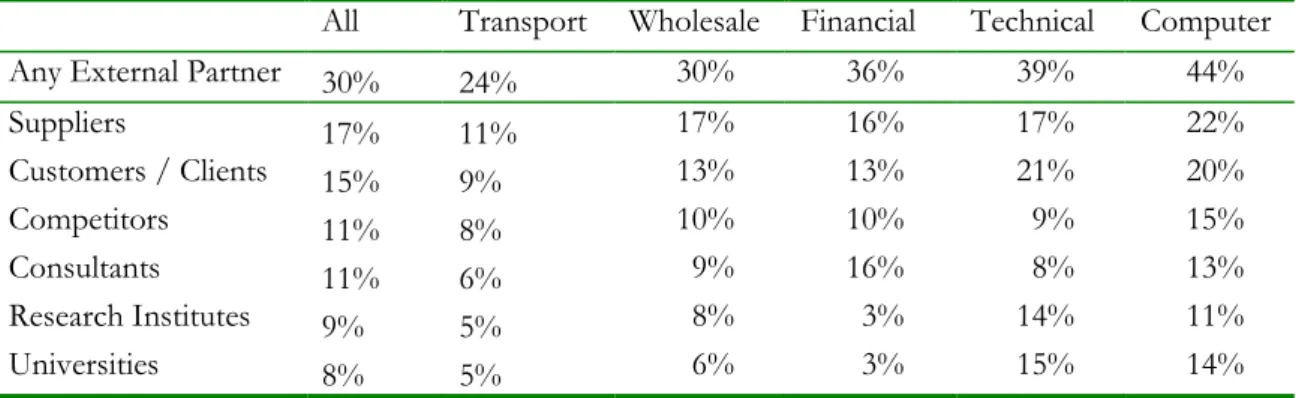
Aside from highlighting a substantial rate of co-operative innovation which was reported by the respondents to the Innobarometer, these findings point to different patterns in the innovation processes of different sectors. Given their characterisation as „technology users‟ (Evangelista, 2000), the relatively high dependence on externally developed innovations in transport services is unsurprising, especially if it is assumed that innovations „mainly developed by others‟ were, in the main, developed by suppliers. But it is perhaps surprising that the extent of dependence on externally developed innovations was not greater. Over two fifths of the transport service firms claimed to be the authors of their own innovations. Although the source of the innovation can be a matter of perspective, if correct these results cast further doubt on the adequacy of the characterisation of transport service firms as (passive) „technology users‟. By contrast, computer services appear to depend mainly on their own internal resources for innovation, although innovation is sometimes undertaken „jointly with others‟ (which presumably refers to customers in most instances). Indeed, the relatively high rate of „joint innovation‟ in financial services may well reflect collaborations with computer service firms, which are engaged for the development of bespoke or significantly customised information technology (IT) systems.
These findings raise more questions than they answer, but they do illustrate considerable diversity within as well as between service „sectors‟ with respect to the sourcing of innovations. Many services admit a significant involvement of others - even a dependence on others – but most contend that they have undertaken (at least some of) the creative activities necessary for the introduction of their own innovations. This contrasts with the widely held perception that services are mere passive, „supplier dominated‟ adopters of externally developed technologies. The findings also suggest the strong emphasis on „interactive innovation‟ as the dominant mode of innovation in services, may be exaggerated, for even in technical services, which might have been expected to exhibit a high level of interactive innovation, only about a third of the firms admitted to having innovated „jointly with others‟.