HAL Id: in2p3-00487186
http://hal.in2p3.fr/in2p3-00487186
Submitted on 28 May 2010
HAL is a multi-disciplinary open access
archive for the deposit and dissemination of sci-entific research documents, whether they are pub-lished or not. The documents may come from
L’archive ouverte pluridisciplinaire HAL, est destinée au dépôt et à la diffusion de documents scientifiques de niveau recherche, publiés ou non, émanant des établissements d’enseignement et de
Isotopic fission-fragment yields measured at Lohengrin
and deduced element yields
F. Rejmund, M. Caamano, K.-H. Schmidt
To cite this version:
F. Rejmund, M. Caamano, K.-H. Schmidt. Isotopic fission-fragment yields measured at Lohengrin and deduced element yields. 2010, pp.1-14. �in2p3-00487186�
Isotopic fission-fragment yields measured at
Lohengrin and deduced element yields
F. Rejmund ∗, M. Caama˜no, K.-H. Schmidt
http://hal.in2p3.fr/in2p3-00487186/fr/
1
Introduction
We comment experimental isotopic yields obtained at the Lohengrin spec-trometer, which are the basis to investigate even-odd effect in the element yields Y(Z). The isotopic yields are given in general in the format of tables, in which the isotopic yields Y(Z,A) are normalised to 1 for each mass A. These isotopic yields are referred to ”relative isotopic yields” in the present work. To obtain the absolute isotopic yields, it is necessary to compute the following relation:
Yabs(Z, A) = Y (Z, A) ∗ Y (A) (1)
Finally, the (absolute) element yields Y(Z) are obtained by summing over the absolute isotopic distribution for each element:
Y (Z) =X
A
Yabs(Z, A) (2)
It is obvious that, to obtain reliable element yield, the complete isotopic
distribution has to be measured. In the following, the results from the
different fissioning systems measured at Lohengrin are discussed in detail. Each section corresponds to a particular fissioning system.
2
230Th
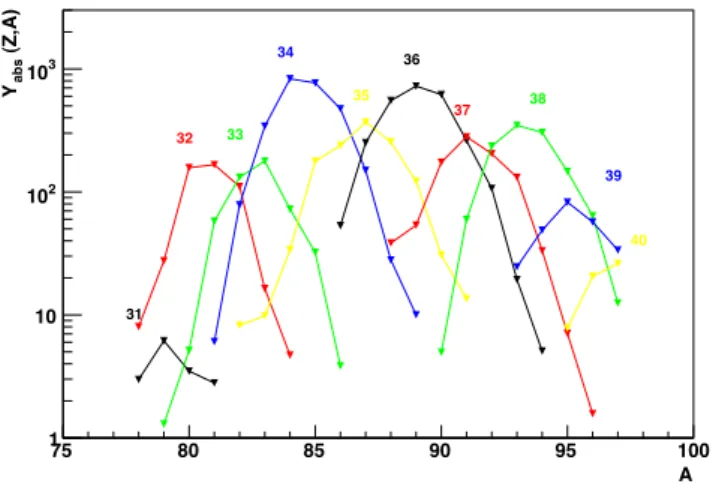
The isotopic yields are given in table 1 of [1]. The element yields are also given in the same table. In principle they should correspond to the sum of the isotopic yields in each element, as given by the relation (2). In figure 1 the relative isotopic yields are displayed, together with the mass yields. It is clearly seen that the isotopic distribution for Z=31, 39 and 40 are
∗
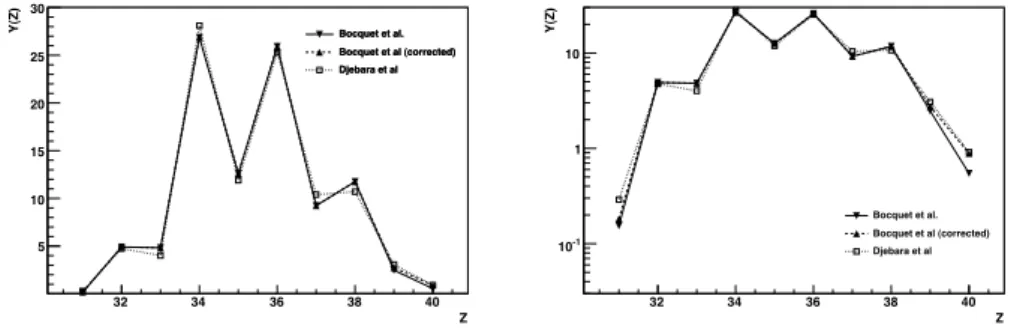
incomplete. When normalised to absolute yields, as displayed in figure 2, the isotopic distribution for Z=39 is slightly cut, and for Z=39 significantly cut. The element yields obtained from the summation over isotopic chains are displayed in figure 3. In table 2, the element yields obtained from the isotopic yields are compared with the element yields published in the same reference [1], as well as with data from an other technique [2]. The compar-ison is interesting, as first, the element yields deduced from the sum of the isotopic chain is not in full agreement with the element yields given by the same authors. Indeed, by summing all isotopic yields, the element yields of Z=31 and Z=40 are found to be 0.15 and 0.54, whereas in table 1 of [1], they are given as 0.2 and 1 respectively. This indicates that in [1], some ad-ditional information which is not reported in the publication is used to give the element yield. In figure 3, we corrected the element yields by completing the truncated isotopic distribution with a gaussian fit. It is interesting to note that these corrected yields are very close to those published by Dje-barra et al., also displayed in the figure. These data are produced with less resolution, but their element yield is less suffering from mass cuts due to the spectrometer. This shows that the Lohengrin measurements are not neces-sarily better than other, because of their precision. Finally, this confirms the choice of Djebara’s data for further investigation on the element yields.
A 75 80 85 90 95 100 (Z,A) rel Y 1 10 2 10 31 32 33 34 35 36 37 38 39 40
Figure 1: Relative isotopic yields of thermal-neutron induced fission of
229Th. The corresponding fission-fragment atomic numbers are indicated.
The mass yields multiplied by a factor 50 are displayed for comparison.
3
236U
The data used in our work, come from table 8 and 1 of [3] for the most symmetric part, and from [4] for the asymmetric part. In [3], the table 8
A 75 80 85 90 95 100 (Z,A) abs Y 1 10 2 10 3 10 31 32 33 34 35 36 37 38 39 40
Figure 2: Absolute isotopic yields of thermal-neutron induced fission of
229Th. The corresponding fission-fragment atomic numbers are indicated.
Z Y(Z) [1] Y(Z) [1] Y(Z) [2]
(deduced) (published) 31 0.15 0.2 0.3 32 4.91 4.9 4.74 33 4.82 4.8 4.01 34 26.87 26.9 28.1 35 12.59 12.6 11.9 36 25.92 26.0 25.3 37 9.24 9.2 10.4 38 11.75 11.8 10.7 39 2.46 2.6 3.07 40 0.54 1.0 0.9
Table 1: Element yields obtained in the fission of 230Th. First column is
deduced from the isotopic distribution, measured in [1]. Second column is the published element yield [1]. Third column is the element yield published in [2].
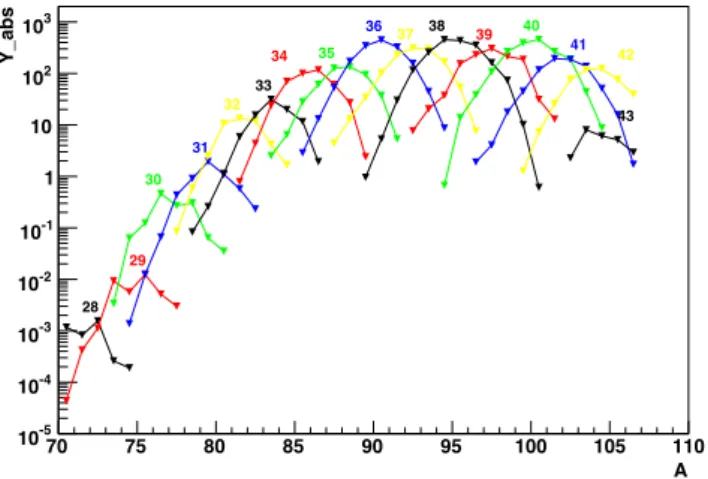
gives the relative isotopic yields; these data are displayed in the figure 4, where it can be seen that the isotopic distribution for Z=43 is not complete. In [4] the isotopic yields are not explicitely given, but the absolute
iso-topic yields are available in EXFOR data basis. In both measures, the
isotopic chain of As (Z=33) has been measured. For this element, the abso-lute isotopic yields, derived from equation (1) are displayed in figure 5, from experiments [4] and [3]. The two measures are perfectly compatible.
Z 32 34 36 38 40 Y(Z) 5 10 15 20 25 30 Bocquet et al. Bocquet et al (corrected) Djebara et al Bocquet et al. Bocquet et al (corrected) Djebara et al Z 32 34 36 38 40 Y(Z) -1 10 1 10 Bocquet et al. Bocquet et al (corrected) Djebara et al
Figure 3: Absolute element yields of thermal-neutron induced fission of
229Th. A 70 75 80 85 90 95 100 105 110 Y -1 10 1 10 2 10 3 10 28 29 30 31 32 33 34 35 36 37 38 39 40 41 42 43
Figure 4: Isotopic yields of thermal-neutron induced fission of 235U. The
corresponding fission-fragment atomic numbers are displayed. The mass yields multiplied by a factor of 100 are displayed.
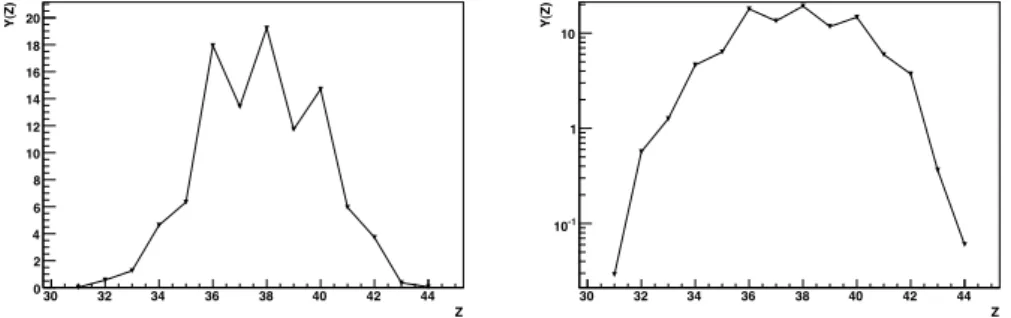
given in figure 6. It can be observed, that the isotopic distributions are complete (i.e, showing a bell-shape), even for the most symmetric split. Therefore, in principle, the full element yield can be used to study even-odd staggering. The corresponding element yields are given in figure 7. However, for Z=43, some doubts can be given on the validity of the isotopic yields, as the maximum of the isotopic distribution happens for a lower mass than the maximum of the isotopic distribution of Z=42. This is also illustrated in figure 8, where the isotopic yield is represented over a bidimensional nuclide chart. It is clearly seen that the isotopic distribution for Z=43 lays on the neutron deficient side of the lighter isotopic chains, which is in complete contradiction with the general trend of the isotopic distribution. Therefore, we recommend not to include this last point in any further investigation of the elemental yields.
A 77 78 79 80 81 82 83 84 85 86 87 Y -2 10 -1 10 1 10 2 10 Lang et al. Sida et al.
Figure 5: Absolute isotopic yields of Z=33 in thermal-neutron induced
fis-sion of 235U, as given in references [3] and [4] with full triangles and open
circles, respectively. A 70 75 80 85 90 95 100 105 110 Y_abs -5 10 -4 10 -3 10 -2 10 -1 10 1 10 2 10 3 10 28 29 30 31 32 33 34 35 36 37 38 39 40 41 42 43
Figure 6: Absolute isotopic yields of thermal-neutron induced fission of235U.
The corresponding fission-fragment atomic numbers are displayed.
4
234U
The data are taken from [5], table 5 for the isotopic yields, where the ab-solute isotopic yields are given. They are displayed in the figure 9. The deduced element yields are displayed in figure 10. However, from figure 9, the isotopic distributions for Z = 31, 43, 44, 45 are clearly incomplete and the corresponding element yields are thus underestimated. In addition, it is dangerous to make a correction for the missing isotopes, as the isotopic
Z 28 30 32 34 36 38 40 42 44 Y(Z) 0 200 400 600 800 1000 1200 1400 1600 1800 2000 Z 28 30 32 34 36 38 40 42 44 Y(Z) 10 2 10 3 10
Figure 7: Element yields of thermal-neutron induced fission of235U, in linear
and logarithmic scale.
N 40 45 50 55 60 65 70 Z 30 32 34 36 38 40 42 44 46 48 50
Figure 8: Isotopic yields of thermal-neutron induced fission of 235U, in a
2-dimensional nuclide chart.
distributions are too limited (for Z=31, 44 and 45 the maximum is not ap-pearing), or widths of the distributions are varying by large factors from one element to the other (see for example the distribution for Z=43). In conclu-sion, we recommend to disregard these data in any further investigation of the element yields.
5
240Pu
Isotopic yields in fission of240Pu are taken from [6], table 9, as displayed in
figure 11. To obtain absolute yields, they are normalised to the mass yield of [6], table 2, also displayed in figure 11. The absolute isotopic yields are displayed in figure 12.
A 75 80 85 90 95 100 105 110 abs Y -3 10 -2 10 -1 10 1 10 31 32 33 34 35 36 37 38 39 40 41 42 43 44 45
Figure 9: Absolute isotopic yields of thermal-neutron induced fission of233U.
The corresponding fission-fragment atomic numbers are displayed.
Z 30 32 34 36 38 40 42 44 Y(Z) 0 2 4 6 8 10 12 14 16 18 20 Z 30 32 34 36 38 40 42 44 Y(Z) -1 10 1 10
Figure 10: Element yields of thermal-neutron induced fission of 233U, in
linear and logarithmic scale.
Z=33, 34, 44 and 45. The deduced element yields are shown in figure 13. They can be used for further investigation only on a limited range between Z=35 and Z=43.
6
246Cm
The data are taken from the references [7], and [8] for the very asymmetric split. Few isotopes that are not present in both publications are taken from Rochman PhD, Fig. 56 ( for Z = 32, 33). Absolute isotopic yields are given in Table 1 of [7], table 4 and figure 4 of [8]. They are reproduced in the figure 14.
The element yields are then deduced as the sum of the isotopic distribu-tion for each atomic number, following equadistribu-tion (2), and they are displayed
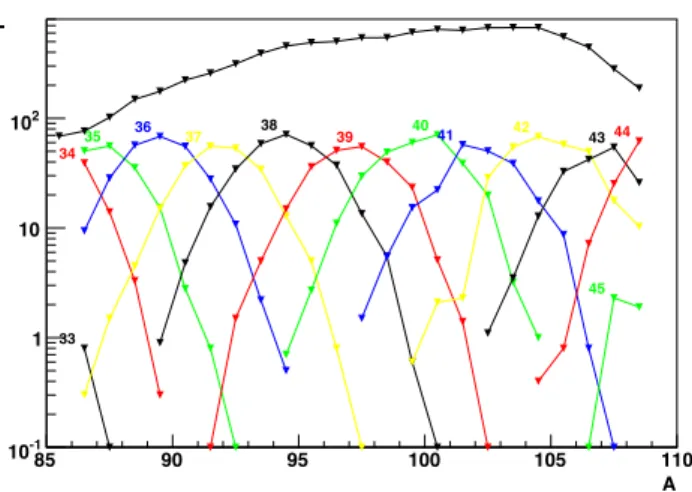
A 85 90 95 100 105 110 Y -1 10 1 10 2 10 33 34 35 36 37 38 39 4041 42 4344 45
Figure 11: Isotopic yields of thermal-neutron induced fission of239Pu. The
corresponding fission-fragment atomic numbers are indicated. The mass
yield is represented on the same Figure, multiplied by a factor 100.
in figure 15.
The element yields are measured up to Z = 47. The local even-odd effect is displayed only in the reference [8], which focuses on the very asymmetric distribution of the fission fragments, and therefore the even-odd effect in this nucleus has not been investigated close to the symmetry (up to Z=47). From figure 14, one sees that the isotopic distribution for Z=47 is not complete, and therefore the corresponding element yield is slightly underestimated. To avoid misinterpretation in any further investigation, it is safer to remove it from the element yield.
7
250Cf
Relative isotopic yields are from [9], table 3, for Z=36 to Z=48, and from [10], table 1, for Z= 29 to Z=35. Isotopic distributions for Z=35 are measured in both publications and coincide within 14%. The corresponding isotopic distributions are displayed in figure 16, compared to the mass yield Y(A).
The absolute isotopic yields are then derived with the relation (1), and are displayed in figure 17.
We can see that even though the relative isotopic yields seem cut for the most symmetric fragments (figure 16) , when normalised with the mass yields, all the isotopic distributions are complete (figure 17). The full ele-ment yields can be used for the investigation of the even-odd effect (with some minor correction for Z=48). They are displayed in figure 18 in linear and logarithmic scale.
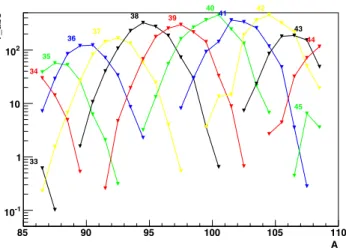
A 85 90 95 100 105 110 Y_abs -1 10 1 10 2 10 33 34 35 36 37 38 39 40 41 42 43 44 45
Figure 12: Isotopic yields of thermal-neutron induced fission of239Pu. The
corresponding fission-fragment atomic numbers are indicated.
Z 32 34 36 38 40 42 44 46 Y(Z) 0 200 400 600 800 1000 1200 1400 1600 1800 Z 32 34 36 38 40 42 44 46 Y(Z) 10 2 10 3 10
Figure 13: Element yields of thermal-neutron induced fission of 239Pu, in
linear and logarithmic scale.
8
Conclusions
The isotopic yields and element yields obtained at the Lohengrin spectrom-eter must be used with precaution when investigating even-odd structure on the element yield. Indeed, we have shown in the present work, that in general, the isotopic distribution for the most symmetric and most asym-metric fission are not complete. Conclusively, the element yields deduced from the sum of the corresponding isotopic distributions may present fake trends produced by the truncated isotopic distributions of some elements. The impact on further investigations such as the local even-odd staggering may lead to wrong conclusions. As a consequence, the importance of other types of measurements dedicated to the direct measurement of the element yield, such as [2] or [11] has to be acknowledged.
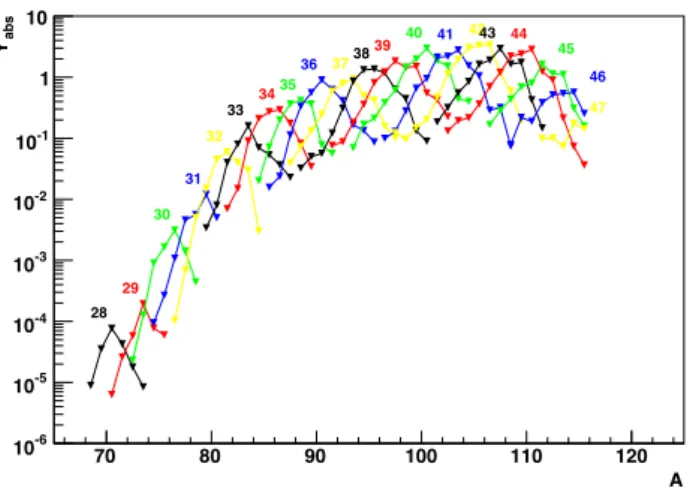
A 70 80 90 100 110 120 abs Y -6 10 -5 10 -4 10 -3 10 -2 10 -1 10 1 10 28 29 30 31 32 33 3435 36 3738 39 40 41 4243 44 45 46 47
Figure 14: Absolute isotopic yields of thermal-neutron induced fission of
245Cm. The corresponding fission-fragment atomic numbers are displayed.
Z 28 30 32 34 36 38 40 42 44 46 48 Y(Z) 0 2 4 6 8 10 12 14 16 Z 28 30 32 34 36 38 40 42 44 46 48 Y(Z) -1 10 1 10
Figure 15: Element yields of thermal-neutron induced fission of 245Cm, in
linear and logarithmic scale.
can be deduced from the isotopic yields measured at Lohengrin. When the isotopic distribution is cut, the yield is marked with an asteriks. If possible to correct, with a gaussian fit of the existing distribution, the corrected yield is indicated. The figure 19 show the local even-odd effect, determined from the genuine isotopic yields, compared to even-odd effect from element yields that have been corrected for truncated isotopic distribution, if possible.
References
[1] J.P. Bocquet, R. Brissot, H. R. Faust, M. Fowler, J. Wilhelmy, M.
Asghar and M. Djebara, Zeit. f¨ur Phys. A 335 (1990) 41
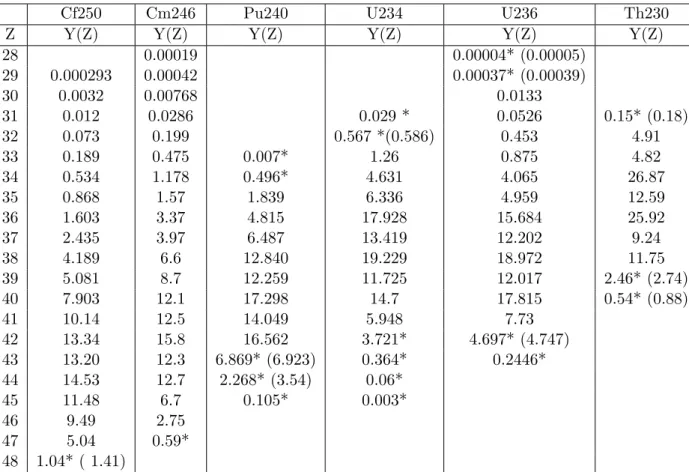
Cf250 Cm246 Pu240 U234 U236 Th230
Z Y(Z) Y(Z) Y(Z) Y(Z) Y(Z) Y(Z)
28 0.00019 0.00004* (0.00005) 29 0.000293 0.00042 0.00037* (0.00039) 30 0.0032 0.00768 0.0133 31 0.012 0.0286 0.029 * 0.0526 0.15* (0.18) 32 0.073 0.199 0.567 *(0.586) 0.453 4.91 33 0.189 0.475 0.007* 1.26 0.875 4.82 34 0.534 1.178 0.496* 4.631 4.065 26.87 35 0.868 1.57 1.839 6.336 4.959 12.59 36 1.603 3.37 4.815 17.928 15.684 25.92 37 2.435 3.97 6.487 13.419 12.202 9.24 38 4.189 6.6 12.840 19.229 18.972 11.75 39 5.081 8.7 12.259 11.725 12.017 2.46* (2.74) 40 7.903 12.1 17.298 14.7 17.815 0.54* (0.88) 41 10.14 12.5 14.049 5.948 7.73 42 13.34 15.8 16.562 3.721* 4.697* (4.747) 43 13.20 12.3 6.869* (6.923) 0.364* 0.2446* 44 14.53 12.7 2.268* (3.54) 0.06* 45 11.48 6.7 0.105* 0.003* 46 9.49 2.75 47 5.04 0.59* 48 1.04* ( 1.41)
Table 2: Element yields of the fissioning systems studied at Lohengrin. When the mass distribution is incomplete, the yield is marked with an as-terix. When possible to correct by fitting the truncated distribution with a gaussian, the extrapolated yield is indicated in parenthesis.
A 70 80 90 100 110 120 Y -3 10 -2 10 -1 10 1 10 2 10 29 30 31 323334 353637 3839 4041 42 43 44 45 46 47 48
Figure 16: Isotopic yields of thermal-neutron induced fission of 249Cf. The
corresponding fission-fragment atomic numbers are indicated. The mass
yield is represented on the same Figure, multiplied by a factor 100 for clarity.
A 70 80 90 100 110 120 abs Y -2 10 -1 10 1 10 2 10 29 30 31 32 33 34 35 3637 3839 4041 42 43 44 45 46 47 48
Figure 17: Absolute isotopic yields of thermal-neutron induced fission of 249Cf. The corresponding fission-fragment atomic numbers are indicated.
[3] W. Lang, H.-G. Clerc, H. Wolfarth, H. Schrader, K.-H. Schmidt, Nucl. Phys. A 345 (1980) 34
[4] J. L. Sida , P. Armbruster, M. Bernas, J.P. Bocquet, R. Brissot, H.R. Faust, Nucl. Phys. A 502 (1989) 233c
[5] U. Quade et al., Nucl. Phys. A 487 (1988) 1 [6] C. Schmitt et al., Nucl. Phys. A 430 (1984) 21
Z 28 30 32 34 36 38 40 42 44 46 48 Y(Z) 0 200 400 600 800 1000 1200 1400 Z 28 30 32 34 36 38 40 42 44 46 48 Y(Z) 10 2 10 3 10
Figure 18: Element yields of thermal-neutron induced fission of 249Cf, in linear and logarithmic scale.
[7] D. Rochman, H. Faust, I. Tsekhanovich, F. G¨onnenwein, F. Storrer, S.
Oberstedt, V. Sokolov, Nucl. Phys. A 710 (2002) 3
[8] D. Rochman, I. Tsekhanovich, F. G¨onnenwein, V. Sokolov, F. Storrer,
G. Simpson, O. Serot, Nucl. Phys. A 735 (2004) 3 [9] M. Djebara et al, Nucl.Phys. A 496 (1989) 346
[10] R. Hentzschel, H. R. Faust, H. O. Denschlag, B. D. Wilkins, J. Gindier, Nucl. Phys. A 571 (1994) 427
30 32 34 36 38 40 42 44 46 0 0.2 0.4 0.6 #^{230}Th #^{230}Th 30 32 34 36 38 40 42 44 46 0 0.2 0.4 0.6 #^{236}U #^{236}U 30 32 34 36 38 40 42 44 46 0 0.2 0.4 0.6 #^{234}U #^{234}U 30 32 34 36 38 40 42 44 46 0 0.2 0.4 0.6 #^{240}Pu#^{240}Pu 30 32 34 36 38 40 42 44 46 0 0.2 0.4 0.6 #^{246}Cm #^{246}Cm 30 32 34 36 38 40 42 44 46 0 0.2 0.4 0.6 #^{250}Cf #^{250}Cf Z Z #delta(Z) (Z) δ
Figure 19: Local even-odd effect for the different systems studied at Lohen-grin (full circles). When truncated and if possible, the isotopic distributions are completed by gaussian extrapolation. The resulting even-odd effect is displayed with open circles.