Dynamic regulatory network controlling TH17 cell differentiation
The MIT Faculty has made this article openly available. Please sharehow this access benefits you. Your story matters.
Citation Yosef, Nir, Alex K. Shalek, Jellert T. Gaublomme, Hulin Jin, Youjin
Lee, Amit Awasthi, Chuan Wu, et al. “Dynamic regulatory network controlling TH17 cell differentiation.” Nature 496, no. 7446 (March 6, 2013): 461-468.
As Published http://dx.doi.org/10.1038/nature11981
Publisher Nature Publishing Group
Version Author's final manuscript
Citable link http://hdl.handle.net/1721.1/80821
Terms of Use Article is made available in accordance with the publisher's
policy and may be subject to US copyright law. Please refer to the publisher's site for terms of use.
Dynamic regulatory network controlling Th17 cell differentiation
Nir Yosef1,2,*, Alex K. Shalek3,*, Jellert T. Gaublomme3,*, Hulin Jin2, Youjin Lee2, Amit Awasthi2,4, Chuan Wu2, Katarzyna Karwacz2, Sheng Xiao2, Marsela Jorgolli3, David Gennert1, Rahul Satija1, Arvind Shakya6, Diana Y. Lu1, John J. Trombetta1, Meenu R. Pillai8, Peter J. Ratcliffe7, Mathew L. Coleman7, Mark Bix8, Dean Tantin6, Hongkun Park3§, Vijay K. Kuchroo2,§, Aviv Regev1,5,§
1
Broad Institute of MIT and Harvard, 7 Cambridge Center, Cambridge, MA
2Center for Neurologic Diseases, Brigham & Women’s Hospital, Harvard Medical
School, Boston, MA
3
Departments of Chemistry and Chemical Biology and of Physics, Harvard University, Cambridge, MA
4
Present address: Translational Health Science & Technology Institute, Faridabad, Haryana, India
5
Howard Hughes Medical Institute, Department of Biology, Massachusetts Institute of Technology, Cambridge, MA
6
Department of Pathology, University of Utah School of Medicine, Salt Lake City, UT
7
University of Oxford, Headington Campus, Oxford, United Kingdom
8
Department of Immunology, St. Jude Children's Research Hospital, Memphis, TN
* These authors contributed equally to this work
§
To whom correspondence should be addressed. E-mail: [email protected] (AR),
ABSTRACT
Despite their importance, the molecular circuits that control the differentiation of naïve T cells remain largely unknown. Recent studies that reconstructed regulatory networks in mammalian cells have focused on short-term responses and relied on perturbation-based approaches that cannot be readily applied to primary T cells. Here, we combine
transcriptional profiling at high temporal resolution, novel computational algorithms, and innovative nanowire-based tools for performing perturbations in primary T cells to systematically derive and experimentally validate a model of the dynamic regulatory network that controls Th17 differentiation. The network consists of two self-reinforcing, but mutually antagonistic, modules, with 12 novel regulators, whose coupled action may be essential for maintaining the balance between Th17 and other CD4+ T cell subsets. Overall, our study identifies and validates 39 regulatory factors, embeds them within a comprehensive temporal network and reveals its organizational principles, and highlights novel drug targets for controlling Th17 differentiation.
INTRODUCTION
Effective coordination of the immune system requires careful balancing of distinct inflammatory and regulatory CD4+ helper T cell populations. Among those, pro-inflammatory IL-17 producing Th17 cells play a key role in the defense against extracellular pathogens and have also been implicated in the induction of several autoimmune diseases1. Th17 differentiation from naïve T-cells can be triggered in vitro by the cytokines TGF-β1 and IL-6. While TGF-β1 alone induces Foxp3+ regulatory T cells (iTreg)2, the presence of IL-6 inhibits iTreg and induces Th17 differentiation1.
Much remains unknown about the regulatory network that controls Th17 cells3,4.
Developmentally, as TGF- is required for both Th17 and iTreg differentiation, it is not understood how balance is achieved between them or how IL-6 biases toward Th17 differentiation1. Functionally, it is unclear how the pro-inflammatory status of Th17 cells is held in check by the immunosuppressive cytokine IL-103,4. Finally, many of the key regulators and interactions that drive development of Th17 remain unknown5.
Recent studies have demonstrated the power of coupling systematic profiling with
perturbation for deciphering mammalian regulatory circuits6-9. Most of these studies have relied upon computational circuit-reconstruction algorithms that assume one ‘fixed’ network. Th17 differentiation, however, spans several days, during which the
components and wiring of the regulatory network likely change. Furthermore, naïve T cells and Th17 cells cannot be transfected effectively in vitro by traditional methods
without changing their phenotype or function, thus limiting the effectiveness of perturbation strategies for inhibiting gene expression.
Here, we address these limitations by combining transcriptional profiling, novel
computational methods, and nanowire-based siRNA delivery10 (Fig. 1a) to construct and validate the transcriptional network of Th17 differentiation. The reconstructed model is organized into two coupled, antagonistic, and densely intra-connected modules, one promoting and the other suppressing the Th17 program. The model highlights 12 novel regulators, whose function we further characterized by their effects on global gene expression, DNA binding profiles, or Th17 differentiation in knockout mice.
RESULTS
A transcriptional time course of Th17 differentiation
We induced the differentiation of naïve CD4+ T-cells into Th17 cells using TGF-β1 and IL-6, and measured transcriptional profiles using microarrays at eighteen time points along a 72hr time course (Fig. 1, Supplementary Fig. 1a-c, Methods). As controls, we measured mRNA profiles for cells that were activated without the addition of
differentiating cytokines (Th0). We identified 1,291 genes that were differentially expressed specifically during Th17 differentiation (Methods, Supplementary Table 1) and partitioned them into 20 co-expression clusters (k-means clustering, Methods, Fig.
1b and Supplementary Fig. 2) with distinct temporal profiles. We used these clusters to
characterize the response and reconstruct a regulatory network model, as described below (Fig. 2a).
Three main waves of transcription and differentiation
There are three transcriptional phases as the cells transition from a naïve-like state (t=0.5hr) to Th17 (t=72hr; Fig. 1c and Supplementary Fig. 1c): early (up to 4hr), intermediate (4-20hr), and late (20-72hr). Each corresponds, respectively, to a
differentiation phase5: (1) induction, (2) onset of phenotype and amplification, and (3) stabilization and IL-23 signaling. The early phase is characterized by transient induction (e.g., Cluster C5, Fig. 1b) of immune response pathways (e.g., IL-6 and TGF-β signaling;
Fig. 1d and Supplementary Table 2). Some early induced genes display sustained
expression (e.g., Cluster C10, Fig. 1b); these are enriched for transcription factors (TFs), including the key Th17 factors Stat3, Irf4 and Batf, and the cytokine and cytokine receptors IL-21, Lif, and Il2ra (Supplementary Table 1). The transition to the intermediate phase (t=4hr) is marked by induction of ROR-γt (master TF;
Supplementary Fig. 1d) and another 12 TFs (Cluster C20, Fig. 1b), both known (e.g.,
Ahr) and novel (e.g., Trps1) to Th17 differentiation. During the transition to the late phase (t=20hr), mRNAs of Th17 signature cytokines are induced (e.g., IL-17a, IL-9; cluster C19) whereas mRNAs of cytokines that signal other T cell lineages are repressed (e.g., IFN-γ and IL-4). Regulatory cytokines from the IL-10 family are also induced (IL-10, IL-24), possibly as a self-limiting mechanism related to the emergence of
‘pathogenic’ or ‘non-pathogenic’ Th17 cells11
. Around 48hr, the cells induce IL23r (data not shown), which plays an important role in the late phase (Supplementary Fig. 3
Inference of dynamic regulatory interactions
We hypothesized that each of the clusters (Fig. 1b, Supplementary Table 2)
encompasses genes that share regulators active in the relevant time points. To predict these regulators, we assembled a general network of regulator-target associations from published genomics profiles12-19 (Fig. 2a, Methods). We then connected a regulator to a gene from its set of putative targets only if there was also a significant overlap between the regulator’s putative targets and that gene’s cluster (Methods). Since different
regulators act at different times, the connection between a regulator and its target may be active only within a certain time window. To determine this window, we labeled each edge with a time stamp denoting when both the target gene is regulated (based on its expression profile) and the regulator node is expressed at sufficient levels (based on its mRNA levels and inferred protein levels20; Methods). In this way, we derived a network ‘snapshot’ for each of the 18 time points (Fig. 2b-d). Overall, 9,159 interactions between 71 regulators and 1,266 genes were inferred in at least one network.
Substantial regulatory re-wiring during differentiation
The active factors and interactions change from one network to the next. The vast majority of interactions are active only at some time window (Fig. 2c), even for regulators (e.g., Batf) that participate in all networks. Based on similarity in active interactions, we identified three network classes (Fig. 2c), corresponding to the three differentiation phases (Fig. 2d). We collapsed all networks in each phase into one model, resulting in three consecutive network models (Supplementary Fig. 4; Supplementary
master regulators such as Batf1, Irf4, and Stat3), whereas 18 are active in only one (e.g. Stat1 and Irf1 in the early network; ROR-γt in the late network). Indeed, while ROR-γt mRNA levels are induced at ~4h, ROR-γt protein levels increase at approximately 20h and further rise over time, consistent with our model (Supplementary Fig. 5).
Ranking novel regulators for systematic perturbation
In addition to known Th17 regulators, our network includes dozens of novel factors as predicted regulators (Fig. 2d), induced target genes, or both (Supplementary Fig. 4;
Supplementary Table 3). It also contains receptor genes as induced targets, both
previously known in Th17 cells (e.g., IL-1R1, IL-17RA) and novel (e.g., Fas, Itga3).
We ranked candidate regulators for perturbation (Fig. 2a, 3a, Methods), guided by features that reflect a regulatory role (Fig. 3a, “Network Information”) and a role as target (Fig. 3a, “Gene Expression Information”). We computationally ordered the genes to emphasize certain features (e.g., a predicted regulator of key Th17 genes) over others (e.g., differential expression in our time course data). We used a similar scheme to rank receptor proteins (Supplementary Table 4 and Methods). Supporting their quality, our top-ranked factors are enriched (p<10-3) for manually curated Th17 regulators
(Supplementary Fig. 6), and correlate well (Spearman r>0.86) with a ranking learned by a supervised method (Methods). We chose 65 genes for perturbation: 52 regulators and 13 receptors (Supplementary Table 4). These included most of the top 44 regulators and top 9 receptors (excluding a few well-known Th17 genes and/or those for which
Nanowire-based perturbation of primary T cells
In unstimulated primary mouse T cells, viral- or transfection-based siRNA delivery has been nearly impossible because it either alters differentiation or cell viability21,22. We therefore used a new delivery technology based on silicon nanowires (NWs)10,23, which we optimized to effectively (>95%) deliver siRNA into naïve T cells without activating them (Figs. 3b and c)23.
We attempted to perturb 60 genes with NW-mediated siRNA delivery and achieved efficient knockdown (<60% transcript remaining at 48hr post activation) for 34 genes (Fig. 3c and Supplementary Fig. 7). We obtained knockout mice for seven other genes, two of which (Irf8 and Il17ra) were also in the knockdown set (Supplementary Table
4). Altogether, we successfully perturbed 39 of the 65 selected genes – 29 regulators and
10 receptors – including 21 genes not previously associated with Th17 differentiation.
Nanowire-based screen validates 39 regulators in the Th17 network
We measured the effects of perturbations at 48hr post-activation on the expression of 275 signature genes using the Nanostring nCounter system (Supplementary Tables 5, 6; Il17ra and Il21r knockouts were also measured at 60hr). The signature genes were computationally chosen to cover as many aspects of the differentiation process as possible (Methods): they include most differentially expressed cytokines, TFs, and cell surface molecules, as well as representatives from each cluster (Fig. 1b), enriched function (Supplementary Table 2), and predicted targets in each network
(Supplementary Table 3). For validation, we profiled a signature of 86 genes using the Fluidigm BioMark system, obtaining highly reproducible results (Supplementary Fig.
8).
We scored the statistical significance of a perturbation’s effect on a signature gene by comparing to non-targeting siRNAs and to 18 control genes that were not differentially expressed (Methods, Fig. 4a, all non-grey entries are significant). Supporting the original network model (Fig. 2), there is a significant overlap between the genes affected by a regulator’s knockdown and its predicted targets (p ≤ 0.01, permutation test;
Supplementary Methods).
To study the network’s dynamics, we measured the effect of 28 of the perturbations at 10hr (shortly after the induction of ROR-γt; Supplementary Table 5), using the
Fluidigm Biomark system. We found that 30% of the functional interactions are present with the same activation/repression logic at both 10hr and 48hr, whereas the rest are present only in one time point (Supplementary Fig. 9). This is consistent with the extent of rewiring in our original model (Fig. 2b).
Two coupled antagonistic circuits in the Th17 network
Characterizing each regulator by its effect on Th17 signature genes (e.g. IL17A, IL17F,
Fig. 4b, grey nodes, bottom), we find that at 48hr the network is organized into two
antagonistic modules: a module of 22 ‘Th17 positive factors’ (Fig. 4b, blue nodes: 9 novel) whose perturbation decreased the expression of Th17 signature genes (Fig. 4b,
grey nodes, bottom), and a module of 5 ‘Th17 negative factors’ (Fig. 4b, red nodes: 3 novel) whose perturbation did the opposite. Each of the modules is tightly
intra-connected through positive, self-reinforcing interactions between its members (70% of the intra-module edges), whereas most (88%) inter-module interactions are negative. This organization, which is statistically significant (empirical p-value<10-3; Methods,
Supplementary Fig. 10), is reminiscent to that observed previously in genetic circuits in
yeast24,25. At 10hrs, the same regulators do not yield this clear pattern (p>0.5), suggesting that at that point, the network is still malleable.
The two antagonistic modules may play a key role in maintaining the balance between Th17 and other T cell subsets and in self-limiting the pro-inflammatory status of Th17 cells. Indeed, perturbing Th17 positive factors also induces signature genes of other T cell subsets (e.g., Gata3, Fig. 4b, grey nodes, top), whereas perturbing Th17 negative factors suppresses them (e.g., Foxp3, Gata3, Stat4, and Tbx21).
Validation and characterization of novel factors
We now focused on the role of 12 of the positive or negative factors (including 11 of the 12 novel factors that have not been associated with Th17 cells; Fig. 4b, light grey halos). We used RNA-Seq after perturbing each factor to test whether its predicted targets (Fig.
2) were affected by perturbation (Fig. 4c, Venn diagram, top). We found highly
significant overlaps (p<10-5) for three of the factors (Egr2, Irf8, and Sp4) that exist in both datasets, and a border-line significant overlap for the fourth (Smarca4), validating the quality of the edges in our network.
Next, we assessed the designation of each of the 12 factors as ‘Th17 positive’ or ‘Th17 negative’ by comparing the set of genes that respond to that factor’s knockdown (in RNA-Seq) to each of the 20 clusters (Fig. 1b). Consistent with the original definitions, knockdown of a ‘Th17 positive’ regulator down-regulated genes in otherwise induced clusters, and up-regulated genes in otherwise repressed or un-induced clusters (and vice versa for ‘Th17 negative’ regulators; Fig. 4d and Supplementary Fig. 11a,b). The genes affected by either positive or negative regulators also significantly overlap with those bound by key CD4+ transcription factors (e.g., Foxp326,27, Batf, Irf4, and ROR-γt28,29, Xiao et al., unpublished data).
Mina promotes the Th17 program and inhibits the Foxp3 program
Knockdown of Mina, a chromatin regulator from the Jumonji C (JmjC) family, represses the expression of signature Th17 cytokines and TFs (e.g. ROR-γt, Batf, Irf4) and of late-induced genes (clusters C9, C19; p<10-5; Supplementary Tables 5 and 7), while
increasing the expression of Foxp3, the master TF of Treg cells. Mina is strongly induced during Th17 differentiation (cluster C7), is down-regulated in IL23r-/- Th17 cells, and is a predicted target of Batf30, ROR-γt30, and Myc in our model (Fig. 5a). Mina was shown to suppress Th2 bias by interacting with the TF NFAT and repressing the IL-4 promoter31. However, in our cells, Mina knockdown did not induce Th2 genes, suggesting an alternative mode of action via positive feedback loops between Mina, Batf and ROR-γt (Fig. 5a, left). Consistent with this model, Mina expression is reduced in Th17 cells from ROR-γt-knockout mice, and the Mina promoter was found to be bound by ROR-γt by
ChIP-Seq (data not shown). Finally, the genes induced by Mina knockdown significantly overlap with those bound by Foxp3 in Treg cells26,27 (P<10-25; Supplementary Table 7) and with a cluster previously linked to Foxp3 activity in Treg cells32 (Supplementary
Fig. 11c and Supplementary Table 7).
To further analyze the role of Mina, we measured IL-17a and Foxp3 expression following differentiation of naïve T cells from Mina-/- mice. Mina-/- cells had decreased IL-17a and increased Foxp3 compared to wild-type (WT) cells, as detected by intracellular staining (Fig. 5a). Cytokine analysis of the corresponding supernatants confirmed a decrease in IL-17a production and an increase in IFN- (Fig. 5a) and TNF- (Supplementary Fig.
12a). This suggests a model where Mina, induced by ROR-γt and Batf, promotes
transcription of ROR-γt, while suppressing induction of Foxp3, thus affecting the reciprocal Tregs/Th17 balance33 by favoring rapid Th17 differentiation.
Fas promotes the Th17 program and suppresses IFN- expression
Fas, the TNF receptor superfamily member 6, is another Th17 positive regulator (Fig.
5b). Fas is induced early, and is a target of Stat3 and Batf in our model. Fas knockdown
represses the expression of key Th17 genes (e.g., IL-17a, IL-17f, Hif1a, Irf4, and Rbpj) and of the induced cluster C14, and promotes the expression of Th1-related genes, including IFN- receptor 1 and Klrd1 (Cd94; by RNA-Seq, Fig. 4, Fig. 5b,
Supplementary Table 7 and Supplementary Fig. 11). Fas and Fas-ligand deficient mice
defect in IFN- or Th1 responses. The mechanism underlying this phenomenon was never studied.
To explore this, we differentiated T cells from Fas-/- mice (Fig. 5b, Supplementary Fig.
12c). Consistent with our knockdown analysis, expression of IL-17a was strongly
repressed and IFN- production was strongly increased under both Th17 and Th0
polarizing conditions (Fig. 5b). These results suggest that besides being a death receptor, Fas may play an important role in controlling the Th1/Th17 balance, and Fas-/- mice may be resistant to EAE due to lack of Th17 cells.
Pou2af1 promotes the Th17 program and suppresses IL-2 expression
Knockdown of Pou2af1 (OBF1) strongly decreases the expression of Th17 signature genes (Fig. 5c) and of intermediate- and late-induced genes (clusters C19 and C20, p<10
-7
; Supplementary Tables 5 and 7), while increasing the expression of regulators of other CD4+ subsets (e.g., Foxp3, Stat4, Gata3) and of genes in non-induced clusters (clusters
C2 and C16 p<10-9; Supplementary Table 5 and 7). Pou2af1’s role in T cell differentiation has not been explored35.
To investigate its effects, we differentiated T cells from Pou2af1-/- mice (Fig. 5c,
Supplementary Fig. 12b). Compared to WT cells, IL-17a production was strongly
repressed. Interestingly, IL-2 production was strongly increased in Pou2af1-/- T cells under non-polarizing (Th0) conditions. Thus, Pou2af1 may promote Th17 differentiation by blocking production of IL-2, a known endogenous repressor of Th17 cells36. Pou2af1
acts as a transcriptional co-activator of the TFs OCT1 or OCT235. IL-17a production was also strongly repressed in Oct1-deficient cells (Supplementary Fig. 12d), suggesting that Pou2af1 may exert some of its effects through this co-factor.
TSC22d3 may limit Th17 differentiation and pro-inflammatory function
Knockdown of the TSC22 domain family protein 3 (Tsc22d3) increases the expression of Th17 cytokines (IL-17a, IL-21) and TFs (ROR-γt, Rbpj, Batf), and reduces Foxp3
expression. Previous studies in macrophages have shown that Tsc22d3 expression is stimulated by glucocorticoids and IL-10, and it plays a key role in their anti-inflammatory and immunosuppressive effects37. Tsc22d3 knockdown in Th17 cells increased the
expression of IL-10 and other key genes that enhance its production (Fig. 5d). Although IL-10 production has been shown33,38,39 to render Th17 cells less pathogenic in
autoimmunity, co-production of IL-10 and IL-17a may be the indicated response for clearing certain infections like Staphylococcus aureus at mucosal sites40. This suggests a model where Tsc22d3 is part of a negative feedback loop for the induction of a Th17 cell subtype that coproduce IL-17 and IL-10 and limits their pro-inflammatory capacity. Tsc22d3 is induced in other cells in response to the steroid Dexamethasone41, which represses Th17 differentiation and ROR-γt expression42. Thus, Tsc22d3 may mediate this effect of steroids.
To further characterize Tsc22d3’s role, we used ChIP-Seq to measure its DNA-binding profile in Th17 cells and RNA-Seq following its knockdown to measure its functional effects. There is a significant overlap between Tsc22d3’s functional and physical targets
(P<0.01, e.g., IL-21, Irf4; Methods, Supplementary Table 8). For example, Tsc22d3 binds in proximity to IL-21 and Irf4, which also become up regulated in the Tsc22d3 knockdown. Furthermore, the Tsc22d3 binding sites significantly overlap those of major Th17 factors, including Batf, Stat3, Irf4, and ROR-γt (>5 fold enrichment; Fig. 5d,
Supplementary Table 8, and Methods). This suggests a model where Tsc22d3 exerts its
Th17-negative function as a transcriptional repressor that competes with Th17 positive regulators over binding sites, analogous to previous findings in CD4+ regulation29,43.
DISCUSSION
We combined a high-resolution transcriptional time course, novel methods to reconstruct regulatory networks, and innovative nanotechnology to perturb T cells, to construct and validate a network model for Th17 differentiation. The model consists of three
consecutive, densely intra-connected networks, implicates 71 regulators (46 novel), and suggests substantial rewiring in 3 phases. The 71 regulators significantly overlap with genes genetically associated with inflammatory bowel disease44 (11 of 71, p<10-9). Building on this model, we systematically ranked 127 putative regulators (80 novel;
Supplementary Table 4), and tested top ranking ones experimentally.
We found that the Th17 regulators are organized into two tightly coupled,
self-reinforcing but mutually antagonistic modules, whose coordinated action may explain how the balance between Th17, Treg, and other effector T cell subsets is maintained, and how progressive directional differentiation of Th17 cells is achieved. Within the two
modules are 12 novel factors (Fig. 4 and 5), which we further characterized, highlighting four of the factors (others are in Supplementary Note and Supplementary Fig. 13).
In a recent work, Ciofani et al.29 systematically ranked Th17 regulators based on ChIP-Seq data for known key factors and transcriptional profiles in wild type and knockout cells. While their network centered on known core Th17 TFs, our complementary approach perturbed many genes in a physiologically meaningful setting. Reassuringly, their core Th17 network significantly overlaps with our computationally inferred model (Supplementary Fig. 14).
The wiring of the positive and negative modules (Fig. 4 and 5) uncovers some of the functional logic of the Th17 program, but likely involve both direct and indirect
interactions. Our functional model provides an excellent starting point for deciphering the underlying physical interactions with DNA binding profiles30 or protein-protein
interactions (Wu et al.45, in this issue of Nature). The regulators we identified are compelling new targets for regulating the Th17/Tregs balance and for switching pathogenic Th17 into non-pathogenic ones.
FIGURE LEGENDS
Figure 1. Genome wide temporal expression profiles of Th17 differentiation.
(a) Overview of approach. (b) Gene expression profiles during Th17 differentiation. Shown are the differential expression levels for genes (rows) at 18 time points (columns) in Th17 polarizing conditions (TGF-β1 and IL-6; left panel, Z-normalized per row) or
Th17 polarizing conditions relative to control activated Th0 cells (right panel,
log2(ratio)). The genes are partitioned into 20 clusters (C1-C20, color bars, right). Right: mean expression (Y axis) and standard deviation (error bar) at each time point (X axis) for genes in representative clusters. Cluster size (“n”), enriched functional annotations (“F”), and representative genes (“M”) are denoted. (c) Three major transcriptional phases. Shown is a correlation matrix (red: high; blue: low) between every pair of time points. (d) Transcriptional profiles of key cytokines and cytokine receptors.
Figure 2. A model of the dynamic regulatory network of Th17 differentiation.
(a) Overview of computational analysis. (b) Schematic of temporal network ‘snapshots’. Shown are three consecutive cartoon networks (top and matrix columns), with three possible interactions from regulator (A) to targets (B, C & D), shown as edges (top) and matrix rows (AB – top row; AC – middle row; AD – bottom row). (c) 18 network ‘snapshots’. Left: each row corresponds to a TF-target interaction that occurs in at least one network; columns correspond to the network at each time point. A purple entry: interaction is active in that network. The networks are clustered by similarity of active interactions (dendrogram, top), forming three temporally consecutive clusters (early, intermediate, late, bottom). Right: a heatmap denoting edges for selected regulators. (d) Dynamic regulator activity. Shown is, for each regulator (rows), the number of target genes (normalized by its maximum number of targets) in each of the 18 networks (columns, left), and in each of the three canonical networks (middle) obtained by collapsing (arrows). Right: regulators chosen for perturbation (pink), known Th17
regulators (grey), and the maximal number of target genes across the three canonical networks (green, ranging from 0 to 250 targets).
Figure 3. Knockdown screen in Th17 differentiation using silicon nanowires.
(a) Unbiased ranking of perturbation candidates. Shown are the genes ordered from left to right based on their ranking for perturbation (columns, top ranking is leftmost). Two top matrices: criteria for ranking by ‘Network Information’ (topmost) and ‘Gene Expression Information’. Purple entry: gene has the feature (intensity proportional to feature strength; top five features are binary). Bar chart: ranking score. ‘Perturbed’ row: dark grey: genes successfully perturbed by knockdown followed by high quality mRNA quantification; light grey: genes we attempted to knockdown but could not achieve or maintain sufficient knockdown or did not obtain enough replicates; Black: genes we perturbed by knockout or for which knockout data was already available. Known row: orange entry: a gene was previously associated with Th17 function (this information was not used to rank the genes; Supplementary Fig. 6). (b) Scanning electron micrograph of primary T cells (false colored purple) cultured on vertical silicon nanowires. (c) Effective knockdown by siRNA delivered on nanowires. Shown is the % of mRNA remaining after knockdown (by qPCR, Y axis: mean ± standard error relative to non-targeting siRNA control, n = 12, black bar on left) at 48hrs after introduction of polarizing cytokines.
Figure 4. Coupled and mutually-antagonistic modules in the Th17 network.
(a) Impact of perturbed genes on a 275-gene signature. Shown are changes in the expression of 275 signature genes (rows) following knockdown or knockout (KO) of 39
factors (columns) at 48hr (as well as IL-21r and IL-17ra KO at 60 hours). Blue: decreased expression of target following perturbation of a regulator (compared to a non-targeting control); red: increased expression; Grey: not significant; all color entries are significant (Methods). ‘Perturbed’ (left): signature genes that are also perturbed as regulators (black entries). Key signature genes are denoted on right. (b) Two coupled and opposing
modules. Shown is the perturbation network associating the ‘positive regulators’ (blue nodes) of Th17 signature genes, the ‘negative regulators’ (red nodes), Th17 signature genes (grey nodes, bottom) and signature genes of other CD4+ T cells (grey nodes, top). A blue edge from node A to B indicates that knockdown of A downregulates B; a red edge indicates that knockdown of A upregulates B. Light grey halos: regulators not previously associated with Th17 differentiation. (c) Knockdown effects validate edges in network model. Venn diagram: we compare the set of targets for a factor in the original model of Fig. 2a (pink circle) to the set of genes that respond to that factor’s knockdown in an RNA-Seq experiment (yellow circle). Bar chart on bottom: Shown is the -log10(P-value) (Y axis, hypergeometric test) for the significance of this overlap for four factors (X axis). Similar results were obtained with a non-parametric rank-sum test (Mann-Whitney U test, Methods). Red dashed line: P=0.01. (d) Global knockdown effects are consistent across clusters. Venn diagram: we compare the set of genes that respond to a factor’s knockdown in an RNA-Seq experiment (yellow circle) to each of the 20 clusters of Fig. 1b (purple circle). We expect the knockdown of a ‘Th17 positive’ regulator to repress genes in induced clusters, and induce genes in repressed clusters (and vice versa for ‘Th17 negative’ regulators). Heat map: For each regulator knockdown (rows) and each cluster (columns) shown are the significant overlaps (non grey entries) by the test
above. Red: fold enrichment for up-regulation upon knockdown; Blue: fold enrichment for down regulation upon knockdown. Orange entries in the top row indicate induced clusters.
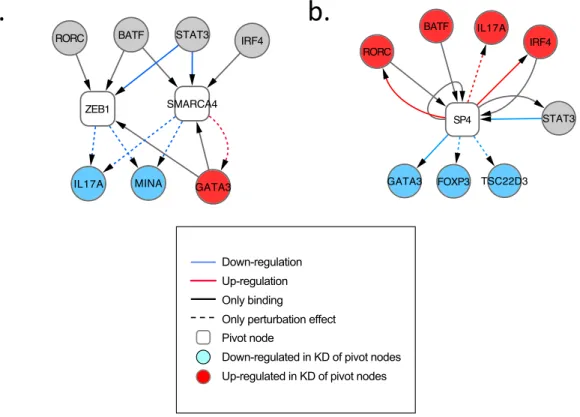
Figure 5. Mina, Fas, Pou2af1, and Tsc22d3 are key novel regulators affecting the Th17 differentiation programs. (a-d, left) Shown are regulatory network models
centered on different pivotal regulators (square nodes): (a) Mina, (b) Fas, (c) Pou2af1, and (d) Tsc22d3. In each network, shown are the targets and regulators (round nodes) connected to the pivotal nodes based on perturbation (red and blue dashed edges), TF binding (black solid edges), or both (red and blue solid edges). Genes affected by
perturbing the pivotal nodes are colored (blue: target is down-regulated by knockdown of pivotal node; red: target is up-regulated). (a-c, middle and right) Intracellular staining and cytokine assays by ELISA or Cytometric Bead Assays (CBA) on culture supernatants at 72h of in vitro differentiated cells from respective KO mice activated in vitro with anti-CD3 + anti-CD28 with or without Th17 polarizing cytokines (TGF-β + IL-6). (d, middle) ChIP-Seq of Tsc22d3. Shown is the proportion of overlap in bound genes (dark grey) or bound regions (light grey) between Tsc22d3 and a host of Th17 canonical factors (X axis). All results are statistically significant (P<10-6; Methods).
METHODS SUMMARY
We measured gene expression profiles at 18 time points (0.5hr to 72 days) under Th17 conditions (IL-6, TGF-β1) or control (Th0) using Affymetrix microarrays HT_MG-430A. We detected differentially expressed genes using a consensus over four inference
methods, and cluster the genes using k-means, with an automatically derived k. Temporal regulatory interactions were inferred by looking for significant (p< 5*10-5 and fold enrichment > 1.5) overlaps between the regulator’s putative targets (e.g., based on ChIP-seq) and the target gene’s cluster (using four clustering schemes). Candidates for
perturbation were ordered lexicographically using network-based and expression-based features. Perturbations were done using SiNW for siRNA delivery.
Full Methods and any associated references are available in the online version of the
paper.
ACKNOWLEDGEMENTS
We thank Leslie Gaffney and Lauren Solomon for artwork and the Broad’s Genomics Platform for sequencing. Daneen Kozoriz for cell sorting. Work was supported by
NHGRI (1P50HG006193-01, HP, AR), NIH Pioneer Awards (5DP1OD003893-03 to HP, DP1OD003958-01 to AR), NIH (NS 30843, NS045937, AI073748 and AI45757 to VKK), National MS Society (RG2571 to VKK), HHMI (AR), and the Klarman Cell Observatory (AR).
NY, AKS, JTG, HP, VKK, and AR conceived the study and designed experiments. NY developed computational methods. NY, AKS, JTG analyzed the data. AKS, JTG, HJ, YL, AA, CW. KK, SX, MJ, DG, RS, DYL, and JJT conducted the experiments. AS, MRP, PJR, MLC, MB, DT provided knockout mice. NY, AKS, JTG, VKK, HP and AR wrote the paper with input from all the authors.
AUTHOR INFORMATION
The microarray, RNA-seq and ChIP-seq data sets have been deposited in the Gene Expression Omnibus database under accession number GSE43955, GSE43969, GSE43948, GSE43949. Reprints and permissions information is available at
www.nature.com/reprints. The authors declare no competing financial interests. Readers are welcome to comment on the online version of the paper. Correspondence and requests for materials should be addressed to HP ([email protected]), VKK
([email protected]) or AR ([email protected]).
REFERENCES
1 Bettelli, E., Oukka, M. & Kuchroo, V. K. T(H)-17 cells in the circle of immunity and autoimmunity. Nat Immunol 8, 345-350, doi:10.1038/ni0407-345 (2007). 2 Zhou, L. et al. TGF-beta-induced Foxp3 inhibits T(H)17 cell differentiation by
antagonizing RORgammat function. Nature 453, 236-240, doi:nature06878 [pii]10.1038/nature06878 (2008).
3 O'Shea, J. et al. Signal transduction and Th17 cell differentiation. Microbes Infect
11, 599-611 (2009).
4 Zhou, L. & Littman, D. Transcriptional regulatory networks in Th17 cell differentiation. Curr Opin Immunol 21, 146-152 (2009).
5 Korn, T., Bettelli, E., Oukka, M. & Kuchroo, V. K. IL-17 and Th17 Cells. Annu
Rev Immunol 27, 485-517,
doi:10.1146/annurev.immunol.021908.13271010.1146/annurev.immunol.021908. 132710 [pii] (2009).
6 Amit, I. et al. Unbiased reconstruction of a mammalian transcriptional network mediating pathogen responses. Science 326, 257-263,
doi:10.1126/science.1179050 (2009).
7 Novershtern, N. et al. Densely interconnected transcriptional circuits control cell states in human hematopoiesis. Cell 144, 296-309, doi:10.1016/j.cell.2011.01.004 (2011).
8 Litvak, V. et al. Function of C/EBPdelta in a regulatory circuit that discriminates between transient and persistent TLR4-induced signals. Nat. Immunol. 10, 437-443, doi:10.1038/ni.1721 (2009).
9 Suzuki, H. et al. The transcriptional network that controls growth arrest and differentiation in a human myeloid leukemia cell line. Nat Genet 41, 553-562 (2009).
10 Shalek, A. K. et al. Vertical silicon nanowires as a universal platform for
delivering biomolecules into living cells. Proc. Natl. Acad. Sci. U.S.A. 107, 1870-1875, doi:10.1073/pnas.0909350107 (2010).
11 Lee, Y. et al. Induction and molecular signature of pathogenic TH17 cells. Nat
immunol in press (2012).
12 Linhart, C., Halperin, Y. & Shamir, R. Transcription factor and microRNA motif discovery: the Amadeus platform and a compendium of metazoan target sets.
Genome research 18, 1180-1189, doi:10.1101/gr.076117.108 (2008).
13 Zheng, G. et al. ITFP: an integrated platform of mammalian transcription factors.
Bioinformatics 24, 2416-2417, doi:10.1093/bioinformatics/btn439 (2008).
14 Wilson, N. K. et al. Combinatorial transcriptional control in blood stem/progenitor cells: genome-wide analysis of ten major transcriptional regulators. Cell Stem Cell 7, 532-544, doi:10.1016/j.stem.2010.07.016 (2010). 15 Lachmann, A. et al. in Bioinformatics Vol. 26 2438-2444 (2010).
16 Liberzon, A. et al. Molecular signatures database (MSigDB) 3.0. Bioinformatics
27, 1739-1740, doi:10.1093/bioinformatics/btr260 (2011).
17 Jiang, C., Xuan, Z., Zhao, F. & Zhang, M. TRED: a transcriptional regulatory element database, new entries and other development. Nucleic Acids Res 35, D137-140 (2007).
18 Elkon, R., Linhart, C., Sharan, R., Shamir, R. & Shiloh, Y. in Genome Research Vol. 13 773-780 (2003).
19 Heng, T. S. & Painter, M. W. The Immunological Genome Project: networks of gene expression in immune cells. Nat. Immunol. 9, 1091-1094,
doi:10.1038/ni1008-1091 (2008).
20 Schwanhäusser, B. et al. Global quantification of mammalian gene expression control. Nature 473, 337-342, doi:10.1038/nature10098 (2011).
21 Dardalhon, V. et al. Lentivirus-mediated gene transfer in primary T cells is enhanced by a central DNA flap. Gene therapy 8, 190-198 (2001).
22 McManus, M. et al. Small interfering RNA-mediated gene silencing in T lymphocytes. The Journal of Immunology 169, 5754 (2002).
23 Shalek, A. K. et al. Nanowire-Mediated Delivery Enables Functional
Interrogation of Primary Immune Cells: Application to the Analysis of Chronic Lymphocytic Leukemia. Nano Lett. 12, 6498-6504, doi:10.1021/nl3042917 (2012).
24 Segrè, D., Deluna, A., Church, G. M. & Kishony, R. Modular epistasis in yeast metabolism. Nat. Genet. 37, 77-83, doi:10.1038/ng1489 (2005).
25 Peleg, T., Yosef, N., Ruppin, E. & Sharan, R. Network-free inference of knockout effects in yeast. PLoS Comput Biol 6, e1000635,
doi:10.1371/journal.pcbi.1000635 (2010).
26 Marson, A. et al. Foxp3 occupancy and regulation of key target genes during T-cell stimulation. Nature 445, 931-935, doi:10.1038/nature05478 (2007).
27 Zheng, Y. et al. Genome-wide analysis of Foxp3 target genes in developing and mature regulatory T cells. Nature 445, 936-940, doi:10.1038/nature05563 (2007). 28 Glasmacher, E. et al. A Genomic Regulatory Element That Directs Assembly and
Function of Immune-Specific AP-1-IRF Complexes. Science (New York, NY), doi:10.1126/science.1228309 (2012).
29 Ciofani, M. et al. A Validated Regulatory Network for Th17 Cell Specification.
Cell, doi:10.1016/j.cell.2012.09.016 (2012).
30 Glasmacher, E. et al. A Genomic Regulatory Element That Directs Assembly and Function of Immune-Specific AP-1-IRF Complexes. Science,
doi:10.1126/science.1228309 (2012).
31 Okamoto, M. et al. Mina, an Il4 repressor, controls T helper type 2 bias. Nat.
Immunol. 10, 872-879, doi:10.1038/ni.1747 (2009).
32 Hill, J. A. et al. Foxp3 transcription-factor-dependent and -independent regulation of the regulatory T cell transcriptional signature. Immunity 27, 786-800,
doi:S1074-7613(07)00492-X [pii]10.1016/j.immuni.2007.09.010 (2007). 33 Korn, T. et al. IL-21 initiates an alternative pathway to induce proinflammatory
T(H)17 cells. Nature 448, 484-487, doi:10.1038/nature05970 (2007).
34 Waldner, H., Sobel, R. A., Howard, E. & Kuchroo, V. K. Fas- and FasL-deficient mice are resistant to induction of autoimmune encephalomyelitis. J Immunol 159, 3100-3103 (1997).
35 Teitell, M. A. OCA-B regulation of B-cell development and function. Trends
Immunol 24, 546-553 (2003).
36 Laurence, A. et al. Interleukin-2 signaling via STAT5 constrains T helper 17 cell generation. Immunity 26, 371-381, doi:S1074-7613(07)00176-8
[pii]10.1016/j.immuni.2007.02.009 (2007).
37 Choi, S.-J. et al. Tsc-22 enhances TGF-beta signaling by associating with Smad4 and induces erythroid cell differentiation. Mol. Cell. Biochem. 271, 23-28 (2005). 38 Peters, A., Lee, Y. & Kuchroo, V. K. The many faces of Th17 cells. Curr. Opin.
Immunol. 23, 702-706, doi:10.1016/j.coi.2011.08.007 (2011).
39 Chaudhry, A. et al. Interleukin-10 signaling in regulatory T cells is required for suppression of Th17 cell-mediated inflammation. Immunity 34, 566-578, doi:10.1016/j.immuni.2011.03.018 (2011).
40 Zielinski, C. E. et al. Pathogen-induced human TH17 cells produce IFN-γ or IL-10 and are regulated by IL-1β. Nature 484, 514-518, doi:IL-10.IL-1038/natureIL-10957 (2012).
41 Jing, Y. et al. A mechanistic study on the effect of dexamethasone in moderating cell death in Chinese Hamster Ovary cell cultures. Biotechnol Prog 28, 490-496, doi:10.1002/btpr.747 (2012).
42 Hu, S. M., Luo, Y. L., Lai, W. Y. & Chen, P. F. [Effects of dexamethasone on intracellular expression of Th17 cytokine interleukin 17 in asthmatic mice]. Nan
Fang Yi Ke Da Xue Xue Bao 29, 1185-1188 (2009).
43 Yang, X. P. et al. Opposing regulation of the locus encoding IL-17 through direct, reciprocal actions of STAT3 and STAT5. Nat. Immunol. 12, 247-254,
doi:10.1038/ni.1995 (2011).
44 Jostins, L. et al. Host-microbe interactions have shaped the genetic architecture of inflammatory bowel disease. Nature 491, 119-124, doi:10.1038/nature11582 (2012).
45 Wu, C., Yosef, N. & Thalhamer, T. SGK1 kinase regulates Th17 cells maintenance through IL-23 signaling pathway. (Submitted).
METHODS Mice
C57BL/6 wild-type (wt), Mt, Irf1, Fas-/-, Irf4fl/fl, and Cd4Cre mice were obtained from Jackson Laboratory (Bar Harbor, ME). Stat1 and 129/Sv control mice were purchased from Taconic (Hudson, NY). IL-12rβ1 mice were provided by Dr. Pahan Kalipada from Rush University Medical Center. IL-17Ra mice were provided by Dr. Jay Kolls
from Louisiana State University/University of Pittsburgh. Irf8fl/fl mice were provided by Dr. Keiko Ozato from the National Institute of Health. Both Irf4fl/fl and Irf8fl/fl mice were crossed to Cd4Cre mice to generate Cd4CrexIrf4fl/fl and Cd4CrexIrf8fl/fl mice. All animals were housed and maintained in a conventional pathogen-free facility at the Harvard Institute of Medicine in Boston, MA (IUCAC protocols: 0311-031-14 (VKK) and 0609-058015 (AR)). All experiments were performed in accordance to the guidelines outlined by the Harvard Medical Area Standing Committee on Animals at the Harvard Medical School (Boston, MA). In addition, spleens from Mina-/- mice were provided by Dr. Mark Bix from St. Jude Children’s Reseach Hospital (IACUC Protocol: 453). Pou2af1
mice were obtained from the laboratory of Dr. Robert Roeder46. Wild-type and Oct1-/- fetal livers were obtained at day E12.5 and transplanted into sub-lethally irradiated Rag1 -/-mice as previously described47 (IACUC Protocol: 11-09003).
Cell sorting and in vitro T-cell differentiation in Petri dishes
Cd4+ T cells were purified from spleen and lymph nodes using anti-CD4 microbeads (Miltenyi Biotech) then stained in PBS with 1% FCS for 20 min at room temperature with anti-Cd4-PerCP, anti-Cd62l-APC, and anti-Cd44-PE antibodies (all Biolegend, CA).
Naïve Cd4+ Cd62lhigh Cd44low T cells were sorted using the BD FACSAria cell sorter. Sorted cells were activated with plate bound anti-Cd3 (2μg/ml) and anti-Cd28 (2μg/ml) in the presence of cytokines. For Th17 differentiation: 2ng/mL rhTGF-β1 (Miltenyi Biotec), 25ng/mL rmIl-6 (Miltenyi Biotec), 20ng/ml rmIl-23 (Miltenyi Biotec), and 20ng/ml rmIL-β1 (Miltenyi Biotec). Cells were cultured for 0.5 – 72 hours and harvested for RNA, intracellular cytokine staining, and flow cytometry.
Flow cytometry and intracellular cytokine staining (ICC)
Sorted naïve T cells were stimulated with phorbol 12-myristate 13-aceate (PMA) (50ng/ml, Sigma-aldrich, MO), ionomycin (1μg/ml, Sigma-aldrich, MO) and a protein transport inhibitor containing monensin (Golgistop) (BD Biosciences) for four hours prior to detection by staining with antibodies. Surface markers were stained in PBS with 1% FCS for 20 min at room temperature, then subsequently the cells were fixed in Cytoperm/Cytofix (BD Biosciences), permeabilized with Perm/Wash Buffer (BD Biosciences) and stained with Biolegend conjugated antibodies, i.e. Brilliant Violet 650™ anti-mouse IFN-γ (XMG1.2) and allophycocyanin–anti-IL-17A (TC11-18H10.1), diluted in Perm/Wash buffer as described48 (Fig. 5, Supplementary Fig. 11). To measure the time-course of RORt protein expression, a phycoerythrin-conjugated anti- Retinoid-Related Orphan Receptor gamma was used (B2D), also from eBioscience (Supplementary Fig 4). FOXP3 staining for cells from knockout mice was performed with the FOXP3 staining kit by eBioscience (00-5523-00) in accordance with their “One-step protocol for intracellular (nuclear) proteins”. Data was collected using either a
FACS Calibur or LSR II (Both BD Biosciences), then analyzed using Flow Jo software (Treestar)49,50.
Quantification of cytokine secretion using Enzyme-Linked Immunosorbent Assay (ELISA).
Naïve T cells from knockout mice and their wild type controls were cultured as described above, their supernatants were collected after 72 h, and cytokine concentrations were determined by ELISA (antibodies for IL-17 and IL-10 from BD Bioscience) or by cytometric bead array for the indicated cytokines (BD Bioscience), according to the manufacturers' instructions (Fig. 5, Supplementary Fig. 11).
Microarray data
Naïve T cells were isolated from WT mice, and treated with IL-6 and TGF-β1.
Affymetrix microarrays HT_MG-430A were used to measure the resulting mRNA levels at 18 different time points (Fig. 1b). Cells treated with IL-6, TGF-β1, and IL-23 were profiled at last four time points (48 - 72hr). As control, we used time- and culture-matched WT naïve T cells stimulated under Th0 conditions. Biological replicates were measured in eight of the eighteen time points (1hr, 2hr, 10hr, 20hr, 30hr, 42hr, 52hr, 60hr) with high reproducibility (r2>0.98). For further validation we compared the
differentiation time course to published microarray data of Th17 cells and naïve T cells51 (Supplementary Fig. 1c). In an additional dataset naïve T cells were isolated from WT and Il23r–/– mice, and treated with IL-6, TGF-β1 and IL-23 and profiled at four different
time points (49hr, 54hr, 65hr, 72hr). Expression data was preprocessed using the RMA algorithm followed by quantile normalization52.
Detecting differentially expressed genes
Differentially expressed genes (comparing to the Th0 control) were found using four methods: (1) Fold change. Requiring a 2-fold change (up or down) during at least two time points. (2) Polynomial fit. We used the EDGE software53,54, designed to identify differential expression in time course data, with a threshold of q-value≤0.01. (3)
Sigmoidal fit. We used an algorithm similar to EDGE while replacing the polynomials
with a sigmoid function, which is often more adequate for modeling time course gene expression data55. We used a threshold of q-value≤0.01. (4) ANOVA. Gene expression is modeled by: time (using only time points for which we have more than one replicate) and treatment (“TGF-β1+IL-6” or “Th0”). The model takes into account each variable
independently, as well as their interaction. We report cases in which the p-value assigned with the treatment parameter or the interaction parameter passed an FDR threshold of 0.01.
Overall, we saw substantial overlap between the methods (average of 82% between any pair of methods). We define the differential expression score of a gene as the number of tests that detected it. As differentially expressed genes, we report cases with differential expression score >3.
For the Il23r–/–time course (compared to the WT T cells) we used methods 1–3 (above). Here we used a fold change cutoff of 1.5, and report genes detected by at least two tests.
Clustering
We considered several ways for grouping the differentially expressed genes, based on their time course expression data: (1) For each time point, we defined two groups: (a) all the genes that are over-expressed and (b) all the genes that are under-expressed relative to Th0 cells (see below); (2) For each time point, we defined two groups: (a) all the genes that are induced and (b) all the genes that are repressed, comparing to the previous time point; (3) K-means clustering using only the Th17 polarizing conditions. We used the minimal k, such that the within-cluster similarity (average Pearson correlation with the cluster’s centroid) was higher than 0.75 for all clusters; and, (4) K-means clustering using a concatenation of the Th0 and Th17 profiles.
For methods (1, 2), to decide whether to include a gene, we considered its original mRNA expression profiles (Th0, Th17), and their approximations as sigmoidal
functions55 (thus filtering transient fluctuations). We require that the fold change levels (compared to Th0 (method 1) or to the previous time point (method 2)) pass a cutoff defined as the minimum of the following three values: (1) 1.7; (2) mean + std of the histogram of fold changes across all time points; or (3) the maximum fold change across all time points. The clusters presented in Fig. 1b were obtained with method 4. The groupings from methods (1, 2, and 4) are provided in Supplementary Table 2.
Regulatory network inference
We identified potential regulators of Th17 differentiation by computing overlaps between their putative targets and sets of differentially expressed genes grouped according to
methods 1-4 above. We assembled regulator-target associations from several sources: (1)
in vivo DNA binding profiles (typically measured in other cells) of 298 transcriptional
regulators12-17; (2) transcriptional responses to the knockout of 11 regulatory proteins
6,43,49,56-60
; (3) additional potential interactions obtained by applying the Ontogenet algorithm (Jojic et al., under review; regulatory model available at:
http://www.immgen.org/ModsRegs/modules.html) to data from the mouse ImmGen consortium (http://www.immgen.org; January 2010 release19
), which includes 484 microarray samples from 159 cell subsets from the innate and adaptive immune system of mice; (4) a statistical analysis of cis-regulatory element enrichment in promoter regions
18,61
; and, (5) the TF enrichment module of the IPA software
(http://www.ingenuity.com/). For every TF in our database, we computed the
statistical significance of the overlap between its putative targets and each of the groups defined above using a Fisher’s exact test. We include cases where p< 5*10-5 and the fold enrichment > 1.5.
Each edge in the regulatory network was assigned a time stamp based on the expression profiles of its respective regulator and target nodes. For the target node, we considered the time points at which a gene was either differentially expressed or significantly induced or repressed with respect to the previous time point (similarly to grouping methods 1 and 2 above). We defined a regulator node as ‘absent’ at a given time point if:
(i) it was under expressed compared to Th0; or (ii) the expression is low (<20% of the
maximum value in time) and the gene was not over-expressed compared to Th0; or, (iii) up to this point in time the gene was not expressed above a minimal expression value of
100. As an additional constraint, we estimated protein expression levels using the model from Ref. 20 and using a sigmoidal fit55 for a continuous representation of the temporal expression profiles, and the ProtParam software62 for estimating protein half-lives. We require that, in a given time point, the predicted protein level be no less than 1.7 fold below the maximum value attained during the time course, and not be less than 1.7 fold below the Th0 levels. The timing assigned to edges inferred based on a time-point specific grouping (grouping methods 1 and 2 above) was limited to that specific time point. For instance, if an edge was inferred based on enrichment in the set of genes induced at 1hr (grouping method #2), it will be assigned a “1hr” time stamp. This same edge could then only have additional time stamps if it was revealed by additional tests.
Selection of Nanostring signature genes
The selection of the 275-gene signature (Supplementary Table 5, 6) combined several criteria to reflect as many aspect of the differentiation program as was possible. We defined the following requirements: (1) the signature must include all of the TFs that belong to a Th17 microarray signature (comparing to other CD4+ T cells51, see Supplementary Methods); that are included as regulators in the network and have a differential expression score>1; or that are strongly differentially expressed (differential expression score=4); (2) it must include at least 10 representatives from each cluster of genes that have similar expression profiles (using clustering method (4) above); (3) it must contain at least 5 representatives from the predicted targets of each TF in the different networks; (4) it must include a minimal number of representatives from each enriched Gene Ontology (GO) category (computed across all differentially expressed
genes); and, (5) it must include a manually assembled list of ~100 genes that are related to the differentiation process, including the differentially expressed cytokines, cytokine receptors and other cell surface molecules. Since these different criteria might generate substantial overlaps, we used a set-cover algorithm to find the smallest subset of genes that satisfies all of five conditions. We added to this list 18 genes whose expression showed no change (in time or between treatments) in the microarray data.
The 86-gene signature (used for the Fluidigm BioMark qPCR assay) is a subset of the 275-gene signature, selected to include all the key regulators and cytokines discussed. We added to this list 10 control genes (Supplementary Table 5).
Selection of perturbation targets
We used an unbiased approach to rank candidate regulators – transcription factor or chromatin modifier genes – of Th17 differentiation. Our ranking was based on the following features: (a) whether the gene encoding the regulator belonged to the Th17 microarray signature (comparing to other CD4+ T cells51, see Supplementary Methods);
(b) whether the regulator was predicted to target key Th17 molecules (IL-17, lL-21,
IL23r, and ROR-γt); (c) whether the regulator was detected based on both perturbation and physical binding data from the IPA software (http://www.ingenuity.com/); (d) whether the regulator was included in the network using a cutoff of at least 10 target genes; (e) whether the gene encoding for the regulator was significantly induced in the Th17 time course – we only consider cases where the induction happened after 4 hours to exclude non-specific hits; (f) whether the gene encoding the regulator was differentially
expressed in response to Th17-related perturbations in previous studies. For this criterion, we assembled a database of transcriptional effects in perturbed Th17 cells, including: knockouts of Batf56, ROR-γt (Xiao et al., unpublished), Hif1a57, Stat3 and Stat543,63, Tbx21 (Awasthi et al., unpublished), IL23r (this study), and Ahr59. We also included data from the Th17 response to Digoxin64 and Halofuginone65, as well as information on direct binding by ROR-γt as inferred from ChIP-seq data (Xiao et al., unpublished). Our
analysis of the published expression data sets is described in the Supplementary Methods. For each regulator, we counted the number of conditions in which it came up as a
significant hit (up/ down-regulated or bound); for regulators with 2 to 3 hits (quantiles 3 to 7 out of 10 bins), we then assign a score of 1; for regulators with more than 3 hits (quantiles 8-10), we assign a score of 2 (a score of 0 is assigned otherwise); and, (g) the differential expression score of the gene in the Th17 time course.
We ordered the regulators lexicographically by the above features according to the order:
a, b, c, d, (sum of e and f), g - that is, first sort according to a then break ties according to b, and so on. We exclude genes that are not over-expressed during at least one time point.
As an exception, we retained predicted regulators (feature d) that had additional external validation (feature f). To validate this ranking, we used a supervised test: we manually annotated 74 regulators that were previously associated with Th17 differentiation. All of the features are highly specific for these regulators (p<10-3). Moreover, using a
supervised learning method (Naïve Bayes), the features provided good predictive ability for the annotated regulators (accuracy of 71%, using 5-fold cross validation), and the
resulting ranking was highly correlated with our unsupervised lexicographic ordering (Spearman correlation > 0.86).
We adapted this strategy for ranking protein receptors. To this end, we excluded feature c and replaced the remaining “protein-level” features (b and d) with the following
definitions: (b) whether the respective ligand is induced during the Th17 time course; and, (d) whether the receptor was included as a target in the network using a cutoff of at least 5 targeting transcriptional regulators.
Gene knockdown using silicon nanowires
4 x 4 mm silicon nanowire (NW) substrates were prepared and coated with 3 μL of a 50 μM pool of four siGENOME siRNAs (Dharmcon) in 96 well tissue culture plates, as previously described10. Briefly, 150,000 naïve T cells were seeded on siRNA-laced NWs in 10 μL of complete media and placed in a cell culture incubator (370
C, 5% CO2) to
settle for 45 minutes before full media addition. These samples were left undisturbed for 24 hours to allow target transcript knockdown. Afterward, siRNA-transfected T cells were activated with αCd3/Cd28 dynabeads (Invitrogen), according to the manufacturer’s recommendations, under Th17 polarization conditions (TGF-β1 & IL-6, as above). 10 or 48hr post-activation, culture media was removed from each well and samples were gently washed with 100 μL of PBS before being lysed in 20 μL of buffer TCL (Qiagen)
supplemented with 2-mercaptoethanol (1:100 by volume). After mRNA was harvested in Turbocapture plates (Qiagen) and converted to cDNA using Sensiscript RT enzyme (Qiagen), qRT-PCR was used to validate both knockdown levels and phenotypic changes
relative to 8-12 non-targeting siRNA control samples, as previously described66. A 60% reduction in target mRNA was used as the knockdown threshold. In each knockdown experiment, each individual siRNA pool was run in quadruplicate; each siRNA was tested in at least three separate experiments (Supplementary Fig. 9). We used the nCounter system are presented in full in Geiss et al.67 to measure a a custom CodeSet constructed to detect a total of 293 genes, selected as described above. We also used the Fluidigm BioMark HD system to measure a smaller set of 96 genes. Finally, we used RNA-Seq to follow up and validate 12 of the perturbations. Details of the experimental and analytical procedures of these analyzes are provided in the Supplementary Methods.
Profiling Tsc22d3 DNA binding using ChIP-seq
ChIP-seq for Tsc22d3 was performed as previously described68 using an antibody from Abcam. The analysis of this data was performed as previously described 7 and is detailed in the Supplementary Methods.
Estimating statistical significance of monochromatic interactions between modules
The functional network in Fig. 4b consists of two modules: positive and negative. We compute two indices: (1) within-module index: the percentage of positive edges between members of the same module (i.e., down-regulation in knockdown/knockout); and, (2)
between-module index: the percentage of negative edges between members of the same
module that are negative. We shuffled the network 1,000 times, while maintaining the nodes’ out degrees (i.e., number of outgoing edges) and edges’ signs (positive/ negative), and re-computed the two indices. The reported p-values were computed using a t-test.
ADDITIONAL REFERENCES
46 Kim, U. et al. The B-cell-specific transcription coactivator OCA-B/OBF-1/Bob-1 is essential for normal production of immunoglobulin isotypes. Nature 383, 542-547, doi:10.1038/383542a0 (1996).
47 Wang, V. E., Tantin, D., Chen, J. & Sharp, P. A. B cell development and immunoglobulin transcription in Oct-1-deficient mice. Proc. Natl. Acad. Sci.
U.S.A. 101, 2005-2010, doi:10.1073/pnas.0307304101 (2004).
48 Bettelli, E. et al. Reciprocal developmental pathways for the generation of pathogenic effector TH17 and regulatory T cells. Nature 441, 235-238 (2006). 49 Awasthi, A. et al. A dominant function for interleukin 27 in generating interleukin
10-producing anti-inflammatory T cells. Nature immunology 8, 1380-1389, doi:10.1038/ni1541 (2007).
50 Awasthi, A. et al. Cutting edge: IL-23 receptor gfp reporter mice reveal distinct populations of IL-17-producing cells. J Immunol 182, 5904-5908,
doi:182/10/5904 [pii] 10.4049/jimmunol.0900732 (2009). 51 Wei, G. et al. in Immunity Vol. 30 155-167 (2009).
52 Reich, M. et al. GenePattern 2.0. Nat. Genet. 38, 500-501, doi:10.1038/ng0506-500 (2006).
53 Storey, J., Xiao, W., Leek, J., Tompkins, R. & Davis, R. in Proceedings of the
National Academy of Sciences Vol. 102 12837 (2005).
54 Leek, J. T., Monsen, E., Dabney, A. R. & Storey, J. D. EDGE: extraction and analysis of differential gene expression. Bioinformatics 22, 507-508,
doi:10.1093/bioinformatics/btk005 (2006).
55 Chechik, G. & Koller, D. Timing of gene expression responses to environmental changes. J Comput Biol 16, 279-290, doi:10.1089/cmb.2008.13TT
10.1089/cmb.2008.13TT [pii] (2009).
56 Schraml, B. U. et al. The AP-1 transcription factor Batf controls T(H)17 differentiation. Nature 460, 405-409, doi:nature08114 [pii]
10.1038/nature08114 (2009).
57 Shi, L. Z. et al. HIF1alpha-dependent glycolytic pathway orchestrates a metabolic checkpoint for the differentiation of TH17 and Treg cells. J. Exp. Med. 208, 1367-1376, doi:10.1084/jem.20110278 (2011).
58 Durant, L. et al. Diverse Targets of the Transcription Factor STAT3 Contribute to T Cell Pathogenicity and Homeostasis. Immunity 32, 605-615,
doi:10.1016/j.immuni.2010.05.003 (2010).
59 Jux, B., Kadow, S. & Esser, C. Langerhans cell maturation and contact
hypersensitivity are impaired in aryl hydrocarbon receptor-null mice. J. Immunol.
182, 6709-6717, doi:10.4049/jimmunol.0713344 (2009).
60 Xiao, S. et al. Retinoic acid increases Foxp3+ regulatory T cells and inhibits development of Th17 cells by enhancing TGF-beta-driven Smad3 signaling and inhibiting IL-6 and IL-23 receptor expression. J Immunol 181, 2277-2284, doi:181/4/2277 [pii] (2008).
61 Odabasioglu, A., Celik, M. & Pileggi, L. T. in Proceedings of the 1997
IEEE/ACM international conference on Computer-aided design 58-65 (IEEE
Computer Society, San Jose, California, United States, 1997).
62 Wilkins, M. R. et al. Protein identification and analysis tools in the ExPASy server. Methods Mol. Biol. 112, 531-552 (1999).
63 Durant, L. et al. in Immunity Vol. 32 605-615 (2010).
64 Huh, J. R. et al. Digoxin and its derivatives suppress TH17 cell differentiation by antagonizing RORgammat activity. Nature 472, 486-490,
doi:10.1038/nature09978 (2011).
65 Sundrud, M. S. et al. Halofuginone inhibits TH17 cell differentiation by activating the amino acid starvation response. Science 324, 1334-1338, doi:10.1126/science.1172638 (2009).
66 Chevrier, N. et al. Systematic discovery of TLR signaling components delineates viral-sensing circuits. Cell 147, 853-867, doi:10.1016/j.cell.2011.10.022 (2011). 67 Geiss, G. K. et al. Direct multiplexed measurement of gene expression with
color-coded probe pairs. SI. Nature Biotechnology 26, 317-325, doi:10.1038/nbt1385 (2008).
68 Ram, O. et al. Combinatorial Patterning of Chromatin Regulators Uncovered by Genome-wide Location Analysis in Human Cells. Cell 147, 1628-1639 (2011).
mRNA
profiling Modeling Perturbation (siRNAs,Nanowire delivery) Validatedmodel
18 time points (0.5–72 hr; +/– IL-23: 48–72 hr) 3 temporal networks; 71 regulators; ~1200 target genes 29 transcriptional regulators; 10 receptors 22 Th17-positive regulators antagonistically coupled to 5 Th17-negative regulators 0.5 1 2 4 6 8 10 12 16 20 24 30 48 50 52 42 60 72 0.5 1 2 4 6 8 10 12 16 20 24 30 42 48 50 52 60 72
a
b
C8 C2 C16 C5 C4 C10 C1 C18 C3 C13 C12 C14 C15 C20 C17 C11 C7 C6 C19 C9 C5 (n = 112) F: Immune response M: Stat1/2, Irf7/9, Il17raC15 (n = 119)
F: Immune response M: Ifng, Ccl3, Tbx21
C20 (n = 31)
F: Haematopoiesis M: Batf, Rorc, Id1/2, Trps1,
Rorc
induction inductionIl17
Il23r expression
IL-6 + TGF-β1 Th0
C19 (n = 135)
F: Cytokine signaling M: Il17a, Il10, Il21, Ccr5, Time (0.5–72 hr) Time (0.5–72 hr) Cluster Time (hr) IL-6 + TGF-β1 [IL-6 + TGF-β1] / [Th0] –3 0 3 Z score –2 0 2
Fold change (log2)
c
d
–2 0 2Fold change (log2)
b
c
Early Intermediate Late
0.5 1 2 4 6 8 10 12 16 20 24 30 42 48 50 52 60 72 Stat1 Irf1 Stat3 Batf Irf4 Rorc Smarca4
Temporal profiles of
individual interactions specific regulatorsBinding by
0.5 1 2 4 6 8 10 12 16 20 24 30 42 48 50 52 60 72 B C D B C D A A A B C D
d
Late interactions Sustained interactions Early interactions Time (hr) Timecourse dataPublished genomic profiles
Expression clusters Timing of target gene induction Presence of regulators
Protein–DNA binding (298 TF) DNA binding motifs (823 motifs) Expression profiles from 159 immune cells Knockout effects (11 TF)
NETWORK
MODEL Integrate
Integrate Ranked list of candidates(TF and receptors) for perturbation Regulator–target
putative associates
Expression changes in key perturbations in Th17 cells