MITLibraries
Document Services Room 14-0551 77 Massachusetts Avenue Cambridge, MA 02139 Ph: 617.253.5668 Fax: 617.253.1690 Email: docs@mit.edu http://libraries.mit.edu/docsDISCLAIMER OF QUALITY
Due to the condition of the original material, there are unavoidable
flaws in this reproduction. We have made every effort possible to
provide you with the best copy available. If you are dissatisfied with
this product and find it unusable, please contact Document Services as
soon as possible.
Thank you.
Pages are missing from the original document.
DIRECTIONAL SOLIDIFICATION PROCESSING OF BYC OXIDES
byHUA SHEN
Submitted to the Department of Materials Science and Engineering
on August 11, 1995 in Partial fulfillment of the requirements forthe Degree of Doctor of Philosophy
in Materials EngineeringABSTRACT
Directional solidification of yttrium-barium-copper oxides (YBCO) was investigated
using a resistance heated furnace. Materials and solidification parameters were
systematically varied and correlated to solidification morphologies. Thermal gradient was
held constant at approximately 120 °C/cm.Different types of growth morphologies were identified for samples with different
compositions, solidified at different growth rates. The growth morphology changed from
faceted plane front to dendritic/cellular and to equiaxed blocky with increasing growth
rate. However, the maximum growth rates to get faceted plane front and dendritic/cellularwere different for samples with different compositions. The maximum growth rate at
which a single crystal could be obtained increased from 1 m/s to 1.5 gm/s as excess
Y2BaCuO5 (211) content increased from 0 to 20 % (wt). It then decreased to 1 gm/s againas excess 211 increased to 40 % (wt).
In the dendritic/cellular regime, dendrite growth with distinguishable secondary
arms was observed in stoichiometric 123 samples. A qualitative dendrite growth model
considering both yttrium and copper diffusion was developed to interpret the
experimental observation. It is concluded that the formation of secondary dendrite arms
was due to microsegregation in the ternary system.A new quench technique developed in this study made it possible to perform
detailed microstructural examination of the YBa
2Cu
30
6+x (123)/liquid growth interfaces.
The examination revealed that the amount of excess Y
2BaCuO
5(211) had a strong
The microscopic 123 growth interface was flat at high excess 211 content, but not flat at
low excess 211 content. A highly curved 123 envelope was formed on 211 particles
located at the 123 growth interface at zero excess 211 content (stoichiometric 123
samples). Based on the detailed microscopic growth interface examinations, the relation
between peritectic reaction and the engulfment of 211 particles into 123 matrix was
discussed. It is concluded that the formation of a small highly curved 123 envelope on
211 particles for stoichiometric 123 samples was due to the large 211 particle spacing,
making the interface temperature lower.
Solidification interface temperatures of YBa
2Cu
30
7_
8(123) single crystals were
measured systematically for samples with different amounts of excess Y
2BaCuO
5(211)
phase, solidified at different growth rates. The experimental results show that the
solidification interface temperature depression ATp increases with increasing the growth
rate for samples with a given amount of excess 211. At a given growth rate, however,
ATp initially decreases and then increases with increasing the amount of excess 211.
Using the peritectic solidification model, it is concluded that the initial decrease of ATp
with increasing the excess 211 content was due to the decrease of the 211 particle
spacing, and the increase of ATp at high excess 211 content was due to the lengthened
diffusion path required for solute transport through the liquid.Solute distributions in the semi-solid melt and the relation between growth rate
and solidification temperature have been obtained for isothermal growth of 123 single
crystals in the ternary system of Y-B-Cu-O. This was done by solving the full solute
transport problem, both in the boundary layer near the growing crystal, and in the outersemi-solid region. Unlike the binary system, liquid composition in the semi-solid region
is not uniform. The copper concentration decreases and yttrium concentration increases
with increasing distance from the 123 growth interface. The 211 volume fraction in the
semi-solid melt is approximately constant. Those conclusions agree well with the
experimental measurements.
Thesis Supervisor: Merton C. Flemings
Title:
Toyota Professor
ACKNOWLEDGMENTS
I am deeply grateful to my advisor, Professor Merton C. Flemings for his
guidance, support, and encouragement during the performance of my thesis work and the
writing of this document. I sincerely thank Professor Michael J. Cima for his many
suggestions in the weekly group meetings for the past three and half years.I also thank Dr. John Haggerty for his suggestions in the duration of this thesis. I
thank Professor Kenneth Russell for being my thesis committee member and his helpful
suggestions. I thank Professor Andreas Mortensen and Professor Theo Kattamis for their
help.
I sincerely thank the people in the Solidification Group and CPRL (Ceramics
Processing Research Laboratory) at MIT for their help and friendships. Of these I
particularly wish to thank Dr. Tom Piccone, Dr. Yanzhong Wu, Dr. Toshi Kosaki, Dr.
Anacledo Figueredo, Dr. Qi Zhao, Shiyu Zhang, John Centorino, Leonard Rigione,
Karina Rigby, Shoichi Honjo and Sato. Being a resident of room 8-436 for more than 3
years I had the privilege to enjoy the companionship of John Matz, Ittipon, Arvind, Doug,
John Lum. I could not have found a better group of people to work with and I wish them
all good luck.
I would like to thank my parents Zhiquan Shen and Meixian Zhu, without whose
love and support I could have never made it this far. Their stressing of the importance of
education and their love of reading were, and remain, fundamental in shaping my life for
the better.
Finally and foremost I thank Nell, my wife. Your love and support have been
infinitely valuable to me. I never could have done it without you.Contents
Abstract
2
Acknowledgments
4
Table of Contents
5
List of Tables
8
List of Figures
8
1. Introduction 17§ 1.1 Application of high T, Superconducting Technology in the Electric
Power Industry
17
§ 1.1.1 New Fields which utilize the Special Characteristics
of Superconductivity
18
§ 1.1.2 Spectacularly Improved Performance by Replacing
Existing Devices with Superconducting Devices
21
§1.2 Objectives 22
§1.3 Thesis Organization 22
§1.4 Reference 23
2. Background 24
§2.1 Phase Equilibrium in the Y-Ba-Cu-O System in Air 24
§2.2 Solidification Processing
26
§2.2.1 Non-directional Solidification Methods
28
§2.2.2 Directional Solidification
31
§2.3 Growth Mechanism of 123 Phase and Peritectic Reaction
33
3. Experiments
§3.1 Experimental Apparatus 39
§3.2 Sample Preparation
40
§3.3 General Observations 41
§3.3.1 Liquid Migration
42
§3.3.2 The Microstructures in the Molten Zone and Solidified Portion
42
§3.3.3 Initial Transient Region 45
§3.4 Reference
46
4. Effect of Growth Rate on the Solidification Interface Morphology and
Microstructures of YBa2Cu306+8
50
§4.1 Abstract 50
§4.2 Introduction 50
§4.3 Experiment 51
§4.4 Experimental Result
52
§4.4.1 Solidification Interface Morphology and Microstructure for
Stoichiometric 123 Samples at Different Growth Rates
52
§4.4.2 Solidification Interface Morphology and Microstructures of
Samples with Excess 211 at Different Growth Rates
56
§4.4.3 Solidification Interface Morphology and Microstructures of
Samples with Stoichiometric 123 plus 40%(wt) 211 at
Different Growth Rates
56
§4.5 Discussion 57
§4.5.1 Solidification Interface Morphology at Different Conditions
57
§4.5.2 Dendrite Growth for Samples with Stoichiometric 123
58
§4.6 Summary 59
§4.7 Reference 59
5. Effect of Excess Y2BaCuOs on the Solidification Interface
Morphology of Single Crystal YBa2Cu306+8
76
§5.1 Abstract
76
§5.2 Introduction
76
§5.3 Experiment 78
§5.4 Experimental Results
79
§5.4.1 Effect of the Amount of Excess 211 on the Microscopic
Solidification Morphology of Single Crystal 123
79
§5.4.2 Effect of the 211 Particle Orientation on the Microscopic
Solidification Interface Morphology of 123 81
§5.5 Discussion
82
§5.5.1 Peritectic Reaction and Peritectic Transformation 82 §5.5.2 Effect of 211 particles on the Microscopic Solidification
Interface Morphology of 123 Before the Engulfment
83
§5.5.3 Effect of Excess 211 Particles on the MicroscopicSolidification Interface Morphology of 123 Single
Crystal during the Engulfment 84
§5.6 Summary 85
§5.7 Reference 86
6. Solidification Interface Temperature of YBa2Cu306+8 Single Crystal
100
§6.1 Abstract 100
§6.2 Introduction 100
§6.3 Experiment 101
§6.4 Experimental Results and Discussion
103
§6.4.1 Solidification Interface Temperature Measurement
103
§6.4.2 Bi-fiber Growth Experiment
104
§6.4.3 Interface Temperature Depression at Low Excess 211 Content 105
§6.4.4 Interface Temperature Depression at High Excess 211 Content
107
§6.5 Summary 108
§6.6 Reference 108
7. Solute Distributions in the Semi-Solid Melt during the Growth of
YBa2Cu306+8 Single Crystal in the Ternary System of Y-Ba-Cu-O
122
§7.1 Abstract 122
§7.2 Introduction 122
§7.3 Experiment 123
§7.4.1 Solute Distribution in Region II 125 §7.4.2 Solute Distribution in Region I 131 §7.4.3 Solute Concentrations in the liquid at the 123 Growth Interface 133
§7.4.4 Calculated Solute Distributions in the Semi-Solid Melt
134
§7.4.5 Solidification Path 136
§7.5 Discussion 137
§7.5.1 211 particle distribution in Region II 137 §7.5.2 Liquid Composition at the 123 Growth Interface 137
§7.5.3 The Effect of Interface Kinetics on the Solute Distribution
in the Semi-Solid Melt
138
§7.6 Summary 138
§7.7 Reference 139
§7.8 Appendix 140
8. Conclusions 157
List of Tables
2.1
Temperature of invariant reactions near 123 composition in air
26
4.1
Interface morphology and temperature for samples with different
amounts of excess 211 and solidified at different growth rates
53
6.1 Calculated 211 particle spacing and interface temperaturedepression (ATp) 106
6.2 Calculated Interface Temperature Depression (ATp) at high
211 content 107
7.1
Parameters used to calculate solute distributions in semi-solid melt.
134
7.2 Solute Concentration at the Growth Interface of 123 134List of Figures
1.1
Application fields of superconducting technology.
17
1.2 Limiting operation wave form. 18
1.3
A superconducting fault current limiter system
designed by TEPCO
19
1.4
Configuration of Current leads
20
1.5 Photograph of a magnetically levitated rare earth magnet with a turbine disc above high-temperature
superconducting materials.
21
Chapter 2
2.1
Pseudo-ternary section of the system 1/2(Y
20
3)-BaO-CuO in air, at
24
temperature around 850C.
2.2 Temperature-composition section corresponding to the lines
al-a2 of the ternary section shown in figure 2.1 25
2.3
Three dimensional views of liquidus surface Y-B-C-O system in air
27
2.4
Optical Micrograph of a MTG processed YBaCuO. Grains
were highly textured, which can be confirmed by the
orientation of the twin structures.
28
2.5
Schematic Illustration of MPMG process. Corresponding microstructure
at each stage (a, b, c, d) is also schematically shown.
29
Chapter 3
3.1
The apparatus for directional solidification
39
3.2 The details of the zone melting furnace 40.3.3
The optical microscopic picture of a stoichiometric sample
after sintering. It can be seen that the microstructure of a as-sintered
sample was polycrystalline.
41
:3.4 Liquid migration along a sample surface solidified at Tmax = 1100
°C
43 3.5 A sample surface solidified at Ta,, = 1080 °C and growth rate R = 1 rm/swithout polishing. It can be seen that the surface of the sample
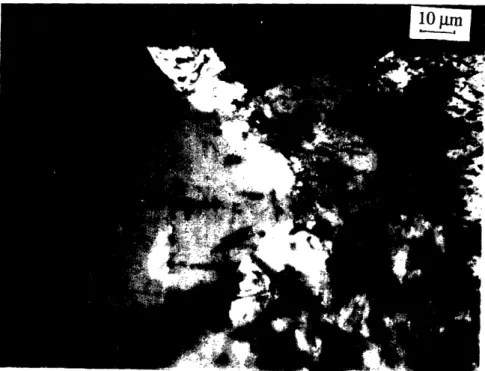
was very smooth and the solidification interface was very clear. 44 3.6 A SEM picture of the molten zone for a stoichiometric 123 sample. 44
3.7
Solidified microstructures for samples with different amount of excess
the increase of the amount of excess 211.
47
3.8
Microstructures in the initial transient region for a sample with
20%(wt) excess 211. 48
3.9
Formation of the initial transient region.
49
Chapter 4
4.1
The solidification interfaces and microstructures of samples with
stoichiometric 123 at a growth rate of (a) top: 2 mm/s and (b) bottom:10 gtm/s. It can be seen that the solidified microstructures were
equiaxed grains. 61
4.2
The solidification interface and solidified microstructures of a sample
with stoichiometric 123 at a growth rate of 1.75 gm/s. It can be seenthat solidified microstructures were long grains parallel
to the growth direction.
62
4.3
The solidification interface and microstructure of a sample with
stoichiometric 123 at a growth rate of 1.5 4m/s. It can be seenthat it is dendrite growth. 63
4.4 High magnification picture of the dendrite growth. It can be seen
that the trapped liquid phases were parallel to the growth interface.
The secondary arm marked "A" just started to grow along the growth
interface of the primary arm. More 211 particles were trapped alongthe growth path of the dendrite tip after solidification. 64
4.5
Solidification interface and solidified microstructures of a
stoichiometric 123 sample at a growth rate of 1 gm/s. It can be seen
that it was a single crystal. 65
4.6 The solidification interface of a sample with 10% (wt) excess 211
at a growth rate of 1 m/s. It can be seen that the interface was faceted. 66
4.7
The solidification interface and microstructure of a sample with
10% (wt) 211 at a growth rate of 3 gm/s. It can be seen that textured
microstructures were obtained.
67
4.8 The solidification interface of a sample with 10% (wt) excess 211 at a growth rate of 10 m/s. It can be seen that the solidified
microstructure was equiaxed. 67
4.9 The solidification interface of a sample with 20% (wt) 211 at a
4.10
The solidification interface and microstructure of a sample with 20%
(wt) 211 at a growth rate of 10 pm/s. It can be seen that the solidifiedmicrostructure was equiaxed. 68
4.11 The solidification interface of a sample with 40% (wt) 211 at a growth
rate of 1 pm/s. It can be seen that the solidification interface was not
flat and 2 1 particles in the melt were aggregated. 69
4.12
The effect of growth rate and the amount of excess 211 on
the morphology of the solidification interface.
70
4.13
Sketch of primary and secondary dendrite arms based on figure 4.3
and 4.4. It can be seen that quenched copper rich liquid phases were trapped in the solidified 123 phase and distributed parallel to the
solidification interface. 211 particles existed in solidified 123 phase
even though the initial composition was stoichiometric 123. More 211particles were found along the growth path of the dendrite tip. 71 4.14 (a) CuO concentration in the semi-solid melt. It can be seen that copper
concentrations at the dendrite root (A, D and E) are higher than that at the dendrite tip (B and C). (b) Illustration of the positions where
the EDAX measurements were made. Curve shows anticipated for
based on data and structure, with low concentrations at dendrite tips.
72
4.15
The dendrite growth model for samples with stoichiometric 123.
73
4.16
Solute distributions in the semi-solid melt
74
4.17
Ternary phase diagram
75
Chapter 5
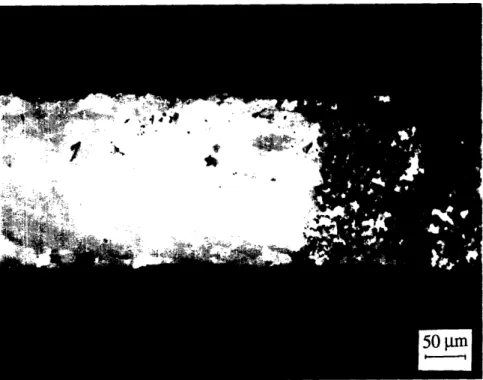
5.1 (a) Solidification interface morphology of a sample with 20% (wt)
excess 211 at a growth rate of 1 gm/s. It can be seen that thesolidification interface was flat.
88
5.1 (b) A high magnification picture of the solidification interface in
figure 1(a). It can be seen that a large 211 particle was lying across and perpendicular to the solidification interface between the quenched
liquid and solidified 123 phase. The rectangular angle between the 211 particle and 123 interface indicates that no 123 "envelope" was formed at the triple area of the 211 particle, quenched liquid and 123 growth interface. It has to be noticed that the gray area near the large 211 particle at the growth interface was not 123 phase but liquid phase,
which can be easily distinguished in the optical microscope but
difficult in this picture. 89
5.2 Solidification interface morphology of a sample with 10% (wt) excess 211 at a growth rate of 1 gm/s. It can be seen that the
solidification interface was not flat but curved.
90
5.3
Solidification interface morphology of a sample with 0%(wt) excess
211 at a growth rate of 1 gm/s (stoichiometric 123). It can be seen that
there were small 123 envelopes on the 211 particles located at the
solidification interface. Those small 123 envelopes had highly curved
shape. 91
5.4
High magnification SEM picture of the solidification interface of the
sample in figure 5.3. On the left is the solidified 123 and on the right is liquid plus 211 particles. It can be seen clearly that the solidification interface was not flat and part of the interface which was close to 211particles grown faster than other part of the interface which had no
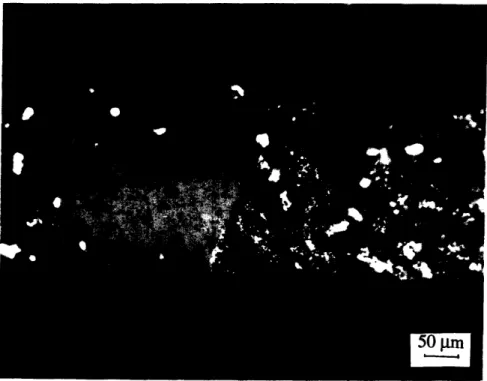
211 particles in its vicinity. 92
5.5
High magnification SEM picture of the solidification interface of
the sample in figure 3. On the left is the solidified 123 and on the right is liquid plus 211 particles. It can be seen that a big 211 particles was located in both sides of the solidification interface. Closeexamination of this picture and figure 3 shows that there was a
small 123 envelope on this 211 particles at the solidification interface. 93
5.6
Solidification interface morphology of a sample with 40%(wt) excess
211 at a growth rate of 1 gm/s. On the left is the solidified 123 matrix plus 211 particles. On the right is liquid plus 211 particles. It can be
seen that the solidification interface was not flat. (a) Top: Optical
microscopic picture. (b) Bottom: SEM picture. 94
5.7
The relation between the solidification interface morphology and
the amount of excess 211
95
5.8 The growth interface of a sample with 10%(wt) excess 211 at a growth rate of 1 gm/s. On the top is quenched liquid plus 211 particles
and on the bottom is solidified 123 single crystal with 211 inclusions.
It can be seen that the 211 particles marked "A" acted as an obstacle tothe growth of the 123 interface. It can also be seen that the 123 growth interface which saw a 211 particle (marked "B") parallel to the growth
interface grown slower than other part of the interface. Even though this
211 particles was very close to the 123 growth interface, locally this part
of the interface grown slower because it is difficult for the copper to
diffuse away from the 123 interface through a small channel between
the 123 interface and the 211 particle. 96
5.9
Schematic illustration of figure 5.8.
97
5.10
Peritectic reaction and transformation at the solidification interface. At
temperature T, y phase envelope is formed on a phase particles. Thethickening of the y phase envelope and the growth of the liquid/g
interface are accomplished by solute diffusion through four paths: pl is through the liquid to the planar interface; p2 is through the liquid tothe curved (protruding) section of y phase adjacent to a phase; p3 is by
diffusion through the protruding section of the y, and/or along the grain boundary between a and y. Only this path among the four paths results in size diminishment of the a particle in solid state; surface diffusion along the path 4 between the liquid and y phase. This path is neglected in the discussion, assuming that transport by this path is small compare with that through the bulk liquid. 98 5.11 Iso-concentration lines ahead of the 123 growth interface. (a) top:samples with less excess 211 have different concentration gradient
ahead of the growth interface. (b) bottom: samples with more excess211 have approximately the same concentration gradient ahead
of the grown interface. 99
Chapter 6
6.1 (a) Configuration of both the sample and the furnace before the sample
was taken out of the furnace. (b) Configuration of the thermocouple
and the furnace before measuring the temperature versus the distance.(c) The measured relation of temperature versus distance. The
temperature of the solidification interface is decided by
the distance (L1 + L2) - L3. 110
6.2
Two fibers with different amount of excess 211 grown together at a
constant pulling rate. The growth interface temperature for each
fiber was different.
111
6.3(a) Interface temperature depression as a function of growth rat for samples
with different amounts of excess 211. It is assumed in this figurethat the interface temperature depression is zero at zero growth rate. 112 6.3(b) The extracted growth rate R from figure 6.3(a) at ATp = 17 °C versus the
composition. Also plotted are the measured growth rates versus the
composition at ATp = 17 °C by Shirohara et al. in a seeded growth experiment [1O]. It can be seen from both measurements that thegrowth rate initially increased and then decreased with the increase
of the 211 weight percent at a given ATp. 113 6.4 Bi-fiber growth. (a) Two fibers with 10% (wt) excess 211 (right)
and 20% (wt) excess 211 (lest) grown together. It can be seen that the interface temperature of the fiber with 20% (wt) excess 211 was higher than that with 10% (wt) excess 211. (b) Higher magnification
of the growth interface and the boundary between those two fibers. 114 6.5 Bi-fiber growth. Two fibers with 0% (wt) excess 211 (left) and 20%
(wt) excess 211 (right) grown together. It can be seen that some parts of the left fiber grow at the same orientation as the right fiber, indicating
that the right fiber grown faster than the left fiber and was acting as a
seeding crystal for the left fiber. It can also be seen that the right fiber
with 20% (wt) 211 has a faceted plane front growth but the left fiberwith 0%(wt) 211 has a faceted dendrite growth morphology. The growth
interface temperature for the fiber with 20% (wt) 211 was higher than that
for the fiber with 0% (wt) 211. 115
6.6 Bi-fiber growth. Two fibers with 10% (wt) excess 211 (right) and 40% (wt) excess 211 (left) grown together. It can be seen that the
growth interface temperature of the fiber with 40% (wt) excess 211
was much higher than that with 40% (wt) excess 211 even though some
parts of the left fiber grown with the right fiber as its seeding crystal.
116
6.7 (a) Peritectic reaction model. (b) The model to calculate 211 particlespacing, assuming 211 particles are arranged in closely packed
configuration 117
6.8 The interface temperature depression ATp at a growth rate of 0.5 gm/s
for samples with different amounts of excess 211. It can be seen that both
calculated and measured ATp decreases monotonously with the increaseof 211 volume fraction in the semi-solid melt at low 211 content.
However, measured DTP increased at high 211 volume fraction.
118
6.9
Diffusion distances required for solute transport. (a) at low 211
6.10
(a) The solidification interface and the semi-solid melt for samples
with 40% (wt) excess 211. (b) High magnification of (a). It can be seen that 211 particles in the semi-solid melt was aggregated to each other andliquid was separated by those aggregated 211 particles. EDAX
composition measurement found that the liquid composition in
the area marked "A" was 98% CuO.
120
6.11
Calculated interface temperature depression ATp from table 6.2.
It can be seen that both calculated and measured ATp decrease
at low 211 content and increase at high 211 content with increasing
211 volume fraction. 121
Chapter 7
7.1 The optical microscopic picture of a sample with 20% (wt) excess 211 isothermally solidified by the melt-growth method at AT = 15 °C.
The top region is the quenched semi-solid melt. The bottom region
is the solidified 123 with 211 inclusions.
145
7.2 The measured CuO %(wt) in the semi-solid melt ahead of the 123growth interface. The measured area at each measurement was
approximately 30x25 !am2. 146
7.3
The measured 211 volume fraction distribution in the semi-solid
melt. It can be seen that the 211 volume fraction isapproximately consult in the semi-solid melt except
the boundary layer. 147
7.4
Solute (yttrium and copper) distributions in the semi-solid melt.
x is the distance from the boundary between region I and region II. 148 7.5(a) The isothermal section of the ternary phase diagram at To = 975 °C.
The liquid composition at the growing interface of 123 crystal
is given by the point B, which is the equilibrium liquid composition
between 123, 211 and liquid. 149
7.5(b) Illustration of the liquidus surfaces. ml is the equilibrium peritectic
reaction liquidus point at Tp as in [1]. Point B is the liquidus point at the 123-liquid interface: the equilibrium liquid compositionbetween 211, 123 and liquid at TO. ABCD is the isothermal plan at TO.
BD is the liquidus line of 211 at TO. 211 liquidus surface is
7.6
Small element taken from region II (the semi-solid melt region)
which contains 211 particles and liquid. 151
7.7
Ternary phase diagram of Ba-Y-Cu-O system: PI-P
2is the
peritectic reaction (L+211 -> 123) liquidus line; m2-P4 is the
peritectic reaction (L + Y
20
3-> 211) liquidus line. It also shows t
he binary section along 211 and 123. ml is the liquidus point of
peritectic reaction (L +211 -> 123 ) in the binary system. 152
7.8
Calculated and measured growth rate for isothermal growth at
different solidification temperature. It can be seen that they are in agreement. The measured DT (17 °C) for thermal gradient
at 0.25 ptm/s is also plotted. 153
7.9
Calculated solute concentration distributions in the semi-solid
melt solidified at AT = 15 °C as a function of the distancefrom the 123 growth interface. It can be seen that both copper and yttrium concentration in the liquid change with the distance.
However, the copper concentration changes much more
than the yttrium concentration. 154
7.10
The measured CuO %(wt) and the calculated Cu) %(wt)
in the semi-solid melt.
155
7.11 Solidification path at AT = 15 °C, where A is the liquid composition at infinity and B is the liquid composition at the 123 growth interface. since the liquid in the semi-solid region is in equilibrium with 211 phase, the solidification path is the same as the metastable 211 liquidus line
Chapter 1
Introduction
§1.1 Application of High T
cSuperconductivity Technology
in the Electric Power Industry
High To superconductors have a variety of applications in different fields since
their special characteristics of superconductivity. Figure 1.1 schematically illustrates the
application fields of superconductivity technology in the electric power industry"'. It can
be seen that the applications of high T
csuperconductors consist of two major categories:
fV
New fields which
utilize the specialcharacteristics of
superconductivity
//Application of
Superconductivity
Technology
\
Spectacular
improvements in the performancecharacteristics of
existing electric
power device
Superconducting
fault current
limit
Superconducting
magnetic energy
storage
I Generator
Underground
Cable
Figure 1.1 Application fields
industry [t
of superconductivity technology in the electric power
Zero electricalIresistance
Strong pinning force (High Tcsuperconductors)
Superconductivity
levitated flywheel
efficiencyimprovement
Compactness
and weightreduction
QuenchI
the new field which utilizes the special characteristics of superconductivity and the
ordinary field where superconducting devices replace existing devices with spectacularly
improved performance.
§1.1.1 New Fields Which Utilize the Special Characteristics of Superconductivity
Utilizing the quenching phenomena of AC superconducting wires,
superconducting fault current limiter is one example of the applications of high Tc
superconductors. Figure 1.2 shows the current limiting characteristics of a fault current
2756A
/-L Volta
0.0
L7
,,-, 3464A8784V ,
Current
/ Resistance
-l
I
quench occurrence
I .. -.- - --.1.0
2.0
Time (msec)
Figure 1.2 Limiting operation wave form[']
limiter designed by TEPCO
[ ]. It can be seen that the resistance of coils occurs by
quenching when the fault current reaches to 2756A, and the fault current is limited to
L=2.0[mH}
3.0
v - __J w r - s | _ek < g _ l_ | .l --.__- _ _ .---| l __ __ f I. _ -u l __ i -_ t _.-i__ I i f I W_ . E he1 _ mo.. I_ I I 1 6.L
,.\
IT
I I'll__-3.9
-I .. __ .... , I3464A at about 0.5 msec after quenching, which is much faster than ordinary current
fuse.
Figure 1.3 shows a superconducting fault current system designed by TEPCO'],
which has three phase superconducting fault current limiter coils in a cryostat filled with
liquid helium, three pair of current leads cooled by gas helium and/or liquid nitrogen, and
two stage refrigerators. In order to make the refrigerator more compact, the reduction of
heat flow through the current lead from atmosphere and the reduction of AC loss in
ReHerwator
Id Htllum (269C)
Cols
CrYogenc Shield
Figure 1.3 A superconducting fault current limiter system designed by TEPCO(t]
superconducting coils are very important. The use of high Tc superconducting current
leads may be essential because of their low thermal conductivity. Figure 1.4 is several
different designs for the superconducting current leadt
1. Therefore, the technology to
manufacture superconducting fibers with high critical current density is essential in
making both the superconducting fault current limiter and the superconducting current
lead.
A low temperature superconductor (LTS) cooled below T
cgenerates an opposing
surface current to shield its interior from the imposed field, a phenomenon refereed to as
Meissner effect [2 ]. The thin sheath in which the shielding surface current circulates, theso-called penetration depth, are on the order of 1000 A. This opposing current (or
magnetization) is the origin of a repulsive magnetic force. However, LTS materials
usually exhibit small critical field (H
c) above which they become normal metals[3]. The
Desse eoatlluratlo CLrcle caitlrailio Tue colulgurati
effect ive
inner
eradius
circle
outer radius
raed
ius
re ius
Figure 1.4 Configuration of current leads
m'
critical magnetic pressure Pc
go HC
2 / 2 is only about 1 psi for a LTS with g0Hc = 0.2
Tesla (e.g., Nb at 4K). Such magnetic pressure is not high enough for realistic large-scale
applications such as superconductivity levitated flywheel. Unlike the traditional LTS,
high Tcsuperconductors provides a much wider range of applicable magnetic fields. HighTc superconductors can remain superconducting until an upper critical field (Hc2) is
reached; HC2 is about 10 Tesla at T = 77K and about 100 Tesla at 4K. Figure 1.5 shows11-f _ I F I I
1I
%-%- -. 0 V I Ithe ability of high T
csuperconductors to levitate small magnets[4].
However, applications
such as superconductivity levitated flywheel require high critical current density.
§1.1.2 Spectacularly Improved Performance by Replacing Existing Devices with
Superconducting Devices
Superconducting technology can improve the performance of existing device
spectacularly such as underground cable. For example, since the electric power demand
will be doubled within 25 years if it increases at a rate of 3% per year, it is necessary to
expand the cable ducts or tunnels in order to distribute these huge power by the
conventional underground cable. It is very difficult to do so since the large construction
cost. However, high Tc superconducting power cable which has a large current capacity
and a compact size can be installed in existing ducts of 150 mm in diameter thus the
construction cost can be reduced substantially
['. Therefore, long superconducting cables
with high critical current density are essential for the future electric power industry.
Figure 1.5 Photograph of a magnetically levitated rare earth magnet with a turbine disc
above high-temperature superconducting materials (YBa
2Cu30
7)
1'
§1.2 Objectives
As shown in § 1.1, important potential applications of high T
csuperconducting
oxides in the electric power industry require long (or large) conductors capable of
carrying high current density in moderate to high magnetic fields. However, progress
toward the much-expected major application of bulk T
csuperconductors has been
hindered by their low critical current density (Jc), especially in high magnetic fields. By
contrast, thin films epitaxially grown on single crystal substrates typically exhibit Jc
values in excess of 106 A/cm2 at 77 K. There are two major causes for the low criticalcurrent density at 77 K in bulk materials: weak links at the grain boundaries and flux line movement with the grains. The latter is due to insufficient flux pinning in Y-Ba-Cu-O.
Solidification processing of high temperature superconducting oxides is an
effective method of eliminating weak links, by generating textured microstructures and
introducing flux pinning by adding pinning centers through processing control. However,
little understanding is available of how those processes affect the microstructure and
hence the superconductivity.
The primary objective of the present research is to achieve better understanding of
the solidification behavior of BYC materials and therefore to be able to control the
solidified microstructures.
§1.3 Thesis Organization
This thesis is organized in 8 chapters. The literature is reviewed in Chapter 2. Different
solidification processing methods of BYC superconducting oxides are reviewed. Also
reviewed are the progresses in the growth mechanism of 123 single crystal.Chapter 3 describes the experimental apparatus used in this study. Also reported
are the general observations of the directionally solidified samples, including liquid
migration, solidified microstructures, initial transient region.
Chapter 4 reports the effect of growth rate on the solidification interface
morphology and microstructures. Different growth rates were applied to samples with
different amount of excess 211 content. A dendrite growth model is developed to
interpret the experimental results.
Chapter 5 reports the effect of the amount of excess 211 on the solidification
interface morphology of single crystal 123, with emphases on the growth mechanism of
the 123 phases and the peritectic reaction occurred during solidification.Chapter 6 reports the interface temperature measurement and the bi-fiber growth
experiments. Also discussed is the 123 growth mechanism at high excess 211 content.Chapter 7 develops a ternary solidification model to describe the solidification
behavior of this B-Y-C-O system. The solute distributions in the semi-solid melt is
calculated according to this model and compared with the experimental measurement.
Conclusions from this research work are presented in chapter 8.
§1.4 Reference
[1] S. Honjo and T. Hara, Proceedings of the US-Japan workshop on high Tc superconductors, edited by K. Salama et al., pp. 53-58, 1993.
[2]
ibid., pp.77-82.
[3] D. Shoenberg, Superconductivity, Cambridge University Press, pp. 17, 1962. [4] F.C. Moon, Superconducting Levitation, John Wiley & Sons, Inc., 1994.
Chapter 2
Background
§2.1 Phase Equilibrium in the Y-Ba-Cu-O System in Air
The pseudo-ternary section BaO-1/2(Y
20
3)-CuO was determined by a number of
investigators [1, 2,3,4,51 in the temperature range of 800 °C -900 °C. Published results are
in general agreement concerning the phase relations but have disagreements on the exact
temperature and composition for all invariant reactions. Figure 2.1 is the pseudo-ternary
section at 875 °C determined by Roth et al [1]. Two ternary compounds exist in the regionC2
I20
i/2(Y:) Mol 7. ',cIOs CuO
Figure 2.1 Pseudo-ternary section of the system 1/2(Y
20
3)-BaO-CuO in air, at
temperature around 850C.
at barium content below 50 mole %: the superconducting phase YBa
2Cu30
6+d (123) and
the "green phase" Y2BaCuO5 (211), which is a non-superconducting phase.
Figure 2.2 is the temperature-composition section corresponding to the lines al-a2
of the ternary section shown in figure 2.1. The compound 211 was found to melt
incongruently at 1275 ± 25 C into Y
20
3plus liquid. The compound 123 decomposed
into 211 plus liquid at 1000 2 C and then became fully liquid at 1258 + 2 C.
However, other researchers found a considerably higher liquidus temperature
[2].I'\ Y03 +' LXQ. '400 , 03 +-. La. ea 1200 (-1000 800 -203 + BY, Y203 + Y2 + ;2;1 Y203 + 62Y2 + 1 2:1 80 8o0: f2(Y203) 1.5 1:2:1 Uq. 1:2:1 + 2:1:3 + 8C 4- Uq. ,02t2 2:1:3 . n 4 tL -2:1 + Lq.
-'.1.3
'0 o n :~~~~~~~~~~~~~~~~~-C _ 21 I 2:1 14 4- 2:1:3 + Li. I I I 60 1 2:1 40 ol 7. Y203 20 2:1:3Figure 2.2 Temperature-composition section corresponding to the lines al-a2 of the
ternary section shown in figure 2.1.
EC + . 2:1:3 + C + CuO _ _ _ I 0 9aO:CuO 3:5 ---_ 4 11 .. .. _ - .. l i
.-\
1 Ann IEven though various sections of the ternary phase diagram of Y
20
3-CuO-BaO
have been published in large number, only a few three dimensional views of the liquidus surface have been reported. Figure 2.3 is one determined by Kosmynin et al [6]. The eutectic, peritectic and melting point reactions in figure 2.3 are described in table 2.1:
Table 2.1 Temperature of invariant reactions near 123 composition in air
Type
Temperature Phases Involved
E
920
YBa
2Cu
30
6+ + BaCuO
2+CuO -> Liquid
Pi 992 YBa2Cu306+6 + BaCuO2 -> Y2BaCuO5 + Liquid
P2 970 YBa2Cu306+6 + CuO -> Y2BaCuO 5+ Liquid
P3 1035 Y2BaCuO5 + CuO -> Y2Cu205 + Liquid
P4 1068 Y2BaCuO5 + Y2Cu2Os5 -> Y203+ Liquid
ml 1020 YBa2Cu306+8 -> Y2BaCuO5 + Liquid
m2
1295
Y2BaCuO5 -> Y203 + Liquid§2.2 Solidification Processing
Various processes have been employed for the fabrication of bulk
high-temperature superconductors. Sintering is common in ceramic processing and has various
advantages in making practical superconductors. However it has been unsuccessful in
producing high-J, materials
[7].The weak links at grain boundaries in bulk sintered
samples are believed to be the source of low Jc values [8].
Solidification from the semi-solid melt (211 plus liquid) has been found to be an effective way of reducing weak links through gain alignment and improving Jc values in YBCO, even at 77 K 9,10,11]. The various solidification processing methods can be
BaO
' a-'i Mol 7. CUO
2
BoaCuO2 O,
Figure 2.3 Top: Projection of the liquidus lines. Bottom: Three dimensional views of
liquidus surface of Y-B-C-O system in air.
Y-5
classed into two major categories, namely (i) non-directional solidification methods and
(ii) directional solidification methods.
§2.2.1 Non-directional Solidification Methods
Since the initiation of melt processing of BYC materials, significant progress has
been achieved in the development of non-directional solidification methods. The most
commonly used non-directional solidification method in processing of BYC materials are
melt-texturing methods. The resulting microstructures from melt-texturing method
consist of multiple domains, which are randomly directed with respect to their
neighbors[
121. The boundaries separating these domains are high-angle boundaries,
which frequently contain secondary phases. Jin et al.
[91developed the first method of melt
texturing of 123 called melt-texture growth(MTG), where sintered YBaCuO was melted
and slowly cooled in a thermal gradient. After melting, the sample was decomposed into
liquid plus 211 particles. During the slow cooling process, 123 phase was formedFigure 2.4 Optical Micrograph of a MTG processed YBaCuO. Grains were highly
textured, which can be confirmed by the orientation of the twin structures.through the peritectic reaction: liquid + 211 --> 123. A typical microstructure of MTG
processed BYC materials is shown in figure 2.4. It can be seen that the resulting 123
grains were needle shaped, typically 100-300 gm long and 5-20 ptm wide. The preferred
orientation for the grain growth was known to be in the a-b plane and thus the grains
were aligned along this direction. Due to the incompletion of the peritectic reaction, 211
particles of 2 - 20 gm size were typically observed in the microstructure. Transport Jr
values of the MTG sample exceed 104 A/cm2 at 77 K in zero field, indicating that grainalignment may have possibly eliminated the weak links. However, J values were still
small in magnetic fields, suggesting that flux pinning was insufficient.There are two approaches used to achieve 211 + liquid phase for subsequent
transformation to 123. One is decomposition of 123 phase, as in the case of the MTG process, and the other is reaction of Y203 with liquid of appropriate composition. Ina _I' D
oC
~ ~ o o o o 00
0 L O o. 0 L ° I0a
0 0 0 o L 0 0 L 0 00 a 0 0 a C 211 d 211Figure 2.5 Schematic Illustration of MPMG process. Corresponding microstructure at
each stage (a, b, c, d) is also schematically shown.In- b-e em> - ----
~~~Y-0
o -- -oEt '7 211+
L
a
\
I I 1 I I /~~~~~~~~~I
I . I"!/ jI -1
I V //
// A/ A 1 Iorder to decrease the 211 particle size and achieve a homogeneous distribution of 211
particles, Murakami et al['
3,14] developed processes termed quench and melt growth
(QMG) and melt powder melt growth (MPMG). Figure 2.5 shows a schematic illustration
of the MPMG (QMG) process. First the sintered sample was heated to the Y
20
3plus
liquid phase region and then quenched to get a mixture of Y
20
3particles and a matrix
consisting of quenched liquid. By crushing the quenched plates into powders and mixing
them well, the Y
20
3particles can be made finer and distributions more homogeneous.
Since Y
20
3was refined and its distribution is made more uniform, much smaller 211
particles were obtained in the solidified 123 matrix[
1 5]. therefore, higher Jc was achieved
in MPMG samples.
Recently, other methods based on the principle of slow cooling have been
developed. Several of these modifications were designed to compensate for the
deficiency in the yttrium supply and provide for a more homogeneous distribution of 211particles. These include the utilization of yttrium-rich starting composition and the
addition of small amount of Pt to samples
[16].Solidified yttrium-rich samples have been
found to be less micro-cracks. The presence of small amount of Pt was believed to alter
the interfacial energy of the 211-liquid interface, resulting in a suppressed coarsening rate
and a decrease of 211 particle size[
171. Another modification to the melt-texturing method
involves MTG in the presence of a strong magnetic field in an effort to align the 123
nuclei with the melt during initial stage of solidification
[ 18]. The results of this nuclei
realignment was multiple-oriented domains that had smaller disorientation angles. Most
recently, Jeong developed an infiltration-reaction process to obtain microstructures with a
fine dispersion of 211 particles in the 123 grains without residual liquid phase [191.
211
powder compacts were placed on the top of 123 powder compact and heated at 1030 C.The liquid appearing in the 123 compact infiltrated into the 211 compact and the
peritectic occurring during cooling resulting in uniform distribution of 211 particles and
much higher pinning effect than conventionally melt-grown specimens.
For most applications, one needs bulk materials fabricated in usable shapes of
large size. The control of crystal orientation is also desirable since the superconductivity
of oxide superconductors is highly anisotropic. It has been demonstrated that other rare
earth 123 crystals such as SmBa
2Cu
30x, which have higher melting points than Y123,
can work as seeds for the crystal growth of 123 and thus make it possible to control the
product crystal's orientation. When a small amount of these materials is placed on top of a
sintered 123 sample, which is then subjected to non-directional melt texturing, grain
growth of 123 around the seeding crystal is greatly enhanced. During the slow cooling
process, they can act as heterogeneous nucleation centers. Larger crystals with controlled
orientation have been fabricated by this technique[2 0, 21, 22]§2.2.2 Directional Solidification
Melt-texturing methods can be used to produce regions of aligned grains (or
"domain" of texture) in the absence of a temperature gradient. However, without a
temperature gradient, domains tend to nucleate and grow at multiple sites throughout a
sample. Although large textured regions can be produced and then sectioned from a
sample for characterization and testing, there will be high-angle boundaries and copper
rich phases between domains which limits the transport of current between domains even
though the transport properties of individual domains are extremely good. On the other
hand, although the seeding method can produce relatively large single crystal, the sizes
attainable may be limited.
Directional solidification of the Y-Ba-Cu-O system has been investigated by a
number of researchers over the past a few years because of its unique advantages of
producing well textured microstructures or even single crystals and the ability to fabricatelong conductors as required in application. Directional solidification is a versatile
melt-texturing process which employs the motion of a sample relative to a temperature
gradient to achieve textured microstructures
[23].The movement of the sample is
desirable from a commercial standpoint, because it permits long samples to be processed
in a semi-continuous fashion. A variety of means have been used to generate the
temperature gradient, including laser and resistance heated furnaces. In the zone melting
method used by Mcginn et all[
24], thin extruded samples were sintered and directionally
solidified in a vertical tube furnace in air. Localized heating of the sample was provided
by a resistance coil where typical hot-zone temperature is between 950 °C to 1050 °C,
and the solidification rate was controlled by the traveling rate of the sample. A-b plane
alignment along the sample axis had been achieved for samples of this size.
Superconductors of larger cross-sectional area have been directionally solidified by Meng
et al
[25].In their semi-continuous method, a multi-zone horizontal tube furnace with a
prescribed temperature profiles employed. A sintered 123 sample was transported
through the furnace at a travel rate that was chosen according to the temperature profile.By doing so, various parts of the sample were heated to 1100°C for a short duration,
rapidly cooled to 1050 °C and slow cooled at different times. Samples of 2.5x5x40 mm
3have been fabricated by this method.
Figueredo et al.
[26]has successfully grown 123 single crystal using a laser-heated
floating zone furnace, which consists of a 100-W C02 laser, two-beam heating optics,
and a controlled atmosphere crystal grower with a cold wall chamber, operated at
pressures ranging from vacuum to 1.3 atm. Direct and indirect current density
measurements yielded current density value along the ab planes in excess of 105 A/cm2 at77.3 K.
Most recently, Shiohara et al.[
361developed a crystal-pulling process (Solute Rich
Liquid Crystal Pulling , SRL-CP method) to grow a single crystal continuously along
either a-axis or c-axis and reported that large faceted (1.6 cmxl.6 cmx0.9 cm) YBCO
crystals were continuously pulled at about 0.1 mm/h of the pulling rate. In doing this
experiment, the 211 phase powder was first placed as a solute at the bottom of the
crucible which are made of polycrystalline Y
20
3or single or polycrystalline MgO.
According to the mass balance, the solvent of 3Bao-5CuO or Bao-3CuO was put on the
layer of the solute. Heating was supplied by a resistance heater to keep a constant
temperature gradient, which is several degrees higher at the bottom than the surface of
the melted solvent and the surface temperature was kept constant at about 900-1050 °C,
depending on the growth direction and growth rate. The seed crystals used are a single
crystal MgO with appropriate surface treatment or 123 single crystal produced separately.
Rotation of the seed crystal was 20-150 rpm which is relatively fast to other crystal
pulling techniques. The typical pulling rate was about 0.1 mm/hour.
§2.3 Growth Mechanism of 123 Phase and Peritectic Reaction
From the beginning of the investigations on solidification processing of 123, the
peritectic growth mechanism of 123 crystal has been one of the main topics. Both
directional and non-directional solidification techniques have been used to investigate the
growth mechanism of 123 and the peritectic reaction occurred during solidification
process.
Melt-texturing methods usually involve the heating of 123 above its peritectic
temperature, which is approximately 1000 °C in air. When 123 is heated above this
temperature, it incongruently melts into 211 and a liquid phase according to the reaction123 --- > 211 + liquid (2.1)
On subsequent slow cooling of the semi-solid melt, oriented-grains of 123 form with 211
inclusions distributed throughout the superconducting matrix. The microstructure of
melt-textured 123 obtained by slow cooling through the peritectic temperature, however, is
different from the typical microstructures resulting from traditional peritectic reaction and
transformation. Instead of small randomly oriented grains due to multiple nucleation sites
in the high temperature 211 phase, melt-textured 123 grains are extensive in the a-bdirection. Rodriguez at al.
[27]analyzed the formation of textured 123 from the liquid
using real-time analysis techniques of high temperature x-ray diffraction, high
temperature optical microscopy and environmental scanning electron microscopy. They
concluded that the presence of crystalline 211 primarily acts as a source of yttrium, and
that the slow dissolution of 211 into the yttrium deficient liquid phase is the rate
controlling step in the formation and growth of textured 123. Morita et al.
[281investigated the growth process, crystallization and growth mechanism of 123 using a
seeding technique and found that there was anisotropy of the growth rate between a and c axis. They considered that yttrium were diffusing along the facets rather than diffusing inthe liquid phase from 211 to 123 while the growth of QMG crystal proceeds.
From the yttrium diffusion controlled growth mechanism of 123, Cima et al.[
29 ]developed a solidification model which not only is able to interpret this experimental
observation but also shows that growth rate strongly affects the ability to obtain the
desirable plane front interface, and that thermal gradient has only a small effect. Izumi et
al.[30
] proposed a simple solidification model considering the interface curvature of 211
as the only driving force for the growth of 123 phase. Schmitz et al.[3
1lproposed a
diffusion model for the growth of 123 taking into account the engulfment process of the
211 particles by the solidifying 123 interface. Bateman et al.[321 proposed that the alignedgrain structure is formed by sympathetic nucleation of new 123 grains on existing grains.
Recently, Chen[
3 3]reported that the undercooling temperature is a critical parameter
which controls the final morphology of 123 in the case of non-directional solidification.
Large amounts of undercooling result in a microstructure characterized by
randomly-oriented dendrite needles or plates, while a low degree of undercooling yields large,
blocky domains of oriented 123.
Cima et al.
[29]measured the solidification interface temperature for samples
directionally solidified at different growth rates (from 0.1 to 0.5 gm/s). They found the
interface temperature depression ATp
(=1000 °C - Tinteface)
wasabout 33 °C at 0.5
,rm/s.Endo et al. [211
measured the growth rate for samples isothermally solidified at different
temperatures. They found that ATp was about 15 C at 0.09 gm/s. The magnitude of the
interface temperature depression is large, given what is known about the phase
equilibrium in the BYCO system. Cima et al. [29] shows that the maximum constitutional undercooling ATsin the semi-solid melt may be much less than ATp. This may be seen byfollowing equation[2 9]:
Tp = ( mL
A
GTs
I
(2.2)
where mL and mLY are the slopes of the equilibrium y (123) and metastable ca (211)
liquidus; G is the thermal gradient; 1 is half spacing of 211 particles. It can be seen that
ATp is much larger than ATs when mLa - mLr Therefore, single crystal growth can beachieved even at large interface temperature depression such as 33 °C since the
constitutional undercooling ATsis actually very small.Although 123 can grow rapidly in the [110] direction, growth along the C axis appears to be much slower. Scheel at al. [34] studied the growth mechanism of (100) and
(001) faces, especially near edges and corners using a scanning tunneling microscope
combined with SEM and found these two faces of 123 have a different growth
mechanism. Lin et al. [351 studied the crystallographic defects in (001), (100)/(010) and(011) faces of 123 single crystal by chemical etching with acetic acid, as well as mixed
solutions of acetic acid, nitric acid and methanol. and found clear evidence for growth
hillocks and steps on these faces. Three types of etch pits are observed: type I is a squarepyramid with growth steps along the <100> and <010> directions; type II is an octagonal
pattern of the above square truncated along the <110> direction, and type III is a shallow
ellipse with long and short axes in the <100>/<010> and <001> direction, respectively.
Due to their spiral growth feature types I and II are designated screw dislocation etch pits
and type III is to be of Hopper-like morphology, on the basis of the growth mechanism.§2.4 Reference
[1] R.S. Roth, G.J. Rawn, F. Beech, J.D. Whitler, J.O. Andersson, Ceramic
Superconductors II, M.F. Yan (ed.), Am. Ceram. Soc., Westerville, OH (1988). [21 J.D. Whitler and R.S. Roth, Phase Diagrams for high -Tc Superconductors, Am.
Ceram. Soc., Westerville, OH (1991).
[3] B.T. Ahn, V.Y. Lee, R.Beyers, T.M. Gur, and R.A. Huggins, Physica C 162-164, (1989).
[4] B.T. Ahn, V.Y. Lee, R.Beyers, T.M. Gur, and R.A. Huggins, Physica C 167, (1990).
[5] T.B. Lindemer, F.A. Washburn, and C.S. Macdougall, Physica C 196, (1992). [6] A.S. Kosmynin, G.E. Shter, I.K. Garkushin, A.S. Trunin, V.A. Balashov and A.A.
Fotiev, Sverkhprovodimost; Fiz. Khim. Tekh., 3 [8], 1989. [7] D.C. Larbalestier, Physics Today6, 1991
[8] D.C. Larbalestier, S.E. Babcock, X. Cai, M. Daeumling, D.P. Hampshire, T.F. Kelly, L.A. Lavanier, P.J. Lee and J. Seuntjens, Physica C 153-155, 1988.
[9] S. Jin, T.H. Tiefel, R.C. Sherwood, M.E. Davis, R.B. van Dover, G.W. Kammlott, R.A. Fastnacht and H.D. Keith, Appl. Phys. Lett. 52, 1988.
[10] J.W. Ekin, K. Salama and V. Selvamanickam, Appl. Phys. Lett. 59, 1991. [11] K. Tatsuhara, N. Miura, M. Murakami, N. Koshizuka and S. Tanaka, Physica C
185-189, 1991.
[13] M. Murakami, Mod. Phys. Lett. B 4, 1990
[14] M. Murakami, S. Gotoh, H. Fujimoto, K. Yamaguchi, N. Koshizuka and S. Tanaka, Supercond. Sci. Technol. 4 S49, 1991.
[15] M. Murakami, Supercond. Sci. Technol., 1992
[16] D.F. Lee, X. Chaud and K. Salama, Japan. J. Appl. Phys. 31, 1992 [17] T. Izumi, Y. Nakamura and Y. shiohara, J. Mater. Res., 1994
[18] M.R. Lees, D. Bourgault, D. Braithwaite, P. de Rango, P. Lejay, A. Sulpice and R. Tournier, Physica C 191, 1992.
[19] I. Jeong and D. Kim, Physica C 217, 1993.
[20] M. Morita, "The international Workshop on HTSC", 1992.
[21] A. Endo, H.S. Chauhan, Y. Nakamura, Y. Shiohara, Solidification Processing for the 21st Century, Lenox, Massachusetts, 1994
[22] S. Honjo, M.J. Cima, M.C. Flemings, J.S. Haggerty, H. Shen, K. Riby, T. Sung, in preparation.
[23] M.C. Flemings, "Solidification Processing", McGraw-Hill, 1974.
[24] P. McGinn, W. Chen, N. Zhu, M. Lanagan and U. Balachandran, Appl. Phys. Lett. 57, 1990.
[25] R. Meng, C. Kinalidis, Y.Y. Sun, L. GAo, Y.K. Tao, P.H. Hor and C.W. Chu, Nature, 345, 1990.
[26] A.M. Figueredo, PhD Thesis, MIT, 1993
[27] M.A. Rodriguez, B. Chen and R. Snyder, Physica C 195, 1992.
[28] Morita et al., The International Workshop on Superconductivity, Honolulu, 1992. [29] M.J. Cima, M.C. Flemings, A.M. Figueredo, M. Nakade, H. Ishii, H.D. Brody,
and J.S. Haggerty, J. Appl. Phys., 72 (1), 1992
[30] T. Izumi, Y. Nakamura, and y. Shiohara, J. Mater. Res., Vol. 7, No. 7, 1992. [31] G.J. Schmitz, J. Laakmann, Ch. Wolters and R. Rex,
[32] C.A. Bateman, L. Zhang, H.M. Chan, and M.P. Harmer, J. Am. Ceram. sco. 75(5), 1992.
[33] B.J. Chen, M.A. Rodgriguez, S.T. Misture and R.L. Snyder, Physica C 217, 1993 [34] H.J. Scheel and Ph Niederhann, J. Crystal Growth, 94, 1989
[35] C.T. Lin, W.Y. Liang, Physica C 223, 1994
Chapter 3
Experiments
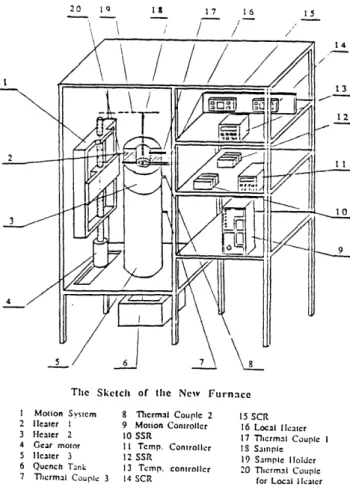
§3.1 Experimental Apparatus
Figure 3.1 is a schematic diagram of the apparatus built for this study. It consists of a motion system and a zone melting furnace. The details of the furnace are shown in figure 3.2. Two conventional electrical heating elements with length of 5 cm and inside
Tlic Sketch of tle New Furnace
I Motion System 8 Tlcrmal Coupl 2 15 SCR
2 Heater 1 9 Motion Controller 16 Local Ileatcr
3 Heater 2 10 SSR 17 Thcrmal Coupic I
4 Gear motor 11 Temp. Controller IS Sample
5 lcater 3 12 SSR 19 Sample Holder
6 Quench Tankl 13 Temp. controller 20 Tlermn1 Couple
7 Thlcrml Couple 3 14 SCR for Local Hlcatcr
diameter 1.5 cm were arranged end-to-end and insulated. Located between the upper and
lower heating elements was a smaller local heater used to control the shape of the
temperature profile. The local heater was made by a coiled electric resistance wire which
is commercially available (Kanthal®). A heating element with the same inside diameter
n
Figure 3.2 The details of the zone melting furnace
(1.5 cm) and longer length (20 cm) was placed below those two heating elements and one