HAL Id: hal-01599191
https://hal-brgm.archives-ouvertes.fr/hal-01599191
Submitted on 1 Oct 2017
HAL is a multi-disciplinary open access
archive for the deposit and dissemination of
sci-entific research documents, whether they are
pub-lished or not. The documents may come from
teaching and research institutions in France or
abroad, or from public or private research centers.
L’archive ouverte pluridisciplinaire HAL, est
destinée au dépôt et à la diffusion de documents
scientifiques de niveau recherche, publiés ou non,
émanant des établissements d’enseignement et de
recherche français ou étrangers, des laboratoires
publics ou privés.
of a CO2 Saturated Solution in a Carbonate Reservoir:
Application to the CO2-DISSOLVED Concept
Combining CO2 Geological Storage and Geothermal
Heat Recovery
A. Randi, J. Sterpenich, Dominique Thiéry, Christophe Kervévan, J. Pironon,
C. Morlot
To cite this version:
A. Randi, J. Sterpenich, Dominique Thiéry, Christophe Kervévan, J. Pironon, et al.. Experimental
and Numerical Simulation of the Injection of a CO2 Saturated Solution in a Carbonate Reservoir:
Application to the CO2-DISSOLVED Concept Combining CO2 Geological Storage and Geothermal
Heat Recovery. International Conference on Greenhouse Gas Control Technologies, GHGT-13, Nov
2016, Lausanne, Switzerland. pp.2942 - 2956, �10.1016/j.egypro.2017.03.1423�. �hal-01599191�
1876-6102 © 2017 The Authors. Published by Elsevier Ltd. This is an open access article under the CC BY-NC-ND license (http://creativecommons.org/licenses/by-nc-nd/4.0/).
Peer-review under responsibility of the organizing committee of GHGT-13. doi: 10.1016/j.egypro.2017.03.1423
Energy Procedia 114 ( 2017 ) 2942 – 2956
ScienceDirect
13th International Conference on Greenhouse Gas Control Technologies, GHGT-13, 14-18
November 2016, Lausanne, Switzerland
Experimental and numerical simulation of the injection of a CO2
saturated solution in a carbonate reservoir: application to the
CO2-DISSOLVED concept combining CO2 geological storage and
geothermal heat recovery
A. Randi
1*, J. Sterpenich
1, D. Thiéry
2, C. Kervévan
2, J. Pironon
1, C. Morlot
11Université de Lorraine, CNRS, CREGU, GeoRessources laboratory, BP 70239, 54506 Vandœuvre-lès-Nancy, France 2
BRGM, 3 av. Claude-Guillemin, BP 36009, 45060 Orléans Cedex 2, France
Abstract
The CO2-DISSOLVED project explores the technical and economic feasibility of a promising concept combining CO2 storage and geothermal heat extraction. The CO2 released by low CO2 emitters is dissolved in the extracted brine via a doublet heat exchanger system. To study the effect to CO2-rich and thus acidic solution in the geothermal doublet, three reactive flow-through experiments mimicking the injection of a CO2 rich solution were performed. The chemical interactions in the near-injection well area between the reservoir rock, the cement phases and the acidic CO2-rich solution was investigated under geothermal reservoir conditions. The main results are i) the formation of a highly permeable network due to specific dissolution pattern called wormholes, and ii) the preservation of mechanical cohesion the cement/rock interface despite the cement carbonation. The experimental results are compared with those obtained by chemical-transport modelling with the coupled PHREEQC-MARTHE codes.
© 2017 The Authors. Published by Elsevier Ltd.
Peer-review under responsibility of the organizing committee of GHGT-13.
Keywords: geological storage; geothermal energy; dissolved CO2; limestone; class G Portland cement; wormhole, numericla simulation
* Corresponding author. Tel.: +33 3-83-68-47-07; fax: +33 3-83-68-47-01.
E-mail address: [email protected]
Available online at www.sciencedirect.com
© 2017 The Authors. Published by Elsevier Ltd. This is an open access article under the CC BY-NC-ND license (http://creativecommons.org/licenses/by-nc-nd/4.0/).
1. Introduction
To tackle the issue of climate change, a lot of Carbon Capture and Storage (CCS) projects [1] have been launched to develop strategies and technologies that safely and permanently store carbon dioxide (CO2). CCS involves a combination of technologies to capture CO2 from large emission sources like fossil fuel plants and industrial facilities, transport it to a suitable location and bury it into deep geological formation. These projects generally plan for the injection of CO2 under supercritical state, thus maximizing the stored quantities that can reach several millions of tons per year. Novel CCS concepts emerge and consist in injecting dissolved CO2 in brine instead of supercritical phase. This option offers substantial benefits in terms of lower brine displacement risks, lower CO2 escape risks, lower to none pressure buildup in the storage aquifer, and the potential for more rapid mineralization. Thereon, the synergy between geothermal heat recovery and CCS appears as a promising alternative as it offers a way to offset some of the cost of storage [2]. The CO2-DISSOLVED concept [3-4] combines the injection of dissolved CO2 close to an emitting source and the recovery of the geothermal heat from the extracted brine. The proposed project opens new potential opportunities for local storage solutions dedicated to low emitters (< 150 000 t/years) and constitutes an interesting way of valorizing the brine reinjection, demonstrating that an actual synergy between CO2 storage and geothermal activities may exist. This approach relies on the geothermal doublet technology (commonly used in the Paris Basin, France), where the warm water is extracted at the production well and the cooled brine re-injected in the same aquifer via a second well (injection well).
The acidification of the brine caused by the presence of dissolved CO2 involves complex phenomena in the near wellbore region that should be accounted for the design and the sizing of the whole system. Indeed, the injection of CO2-rich acidified water has an effect on the chemical reactivity of fluid and solid phases resulting in dissolution and potentially, carbonate precipitation [5,6,7,8,9,10]. The CO2-saturated brine-limestone reactions provokes changes in petrophysical properties of the host formation which are characterized by an increase of porosity and permeability [6,11,12,13,14] especially at the immediate vicinity of the injection well. The long term behavior of the reservoir will be modified in term of injectivity, storage efficiency and integrity. Similarly, acidified water will be much more aggressive for the well casing than standard cold brine in classical geothermal doublets. It could also induced mechanisms of chemical alteration of well cement weakening the mechanical cohesion between the different interfaces (cement-rock and cement-steel tube). Well integrity can be thus compromised because of the potential development of leaks [15,16,17,18].
A good understanding of the mechanical impact near the injection well induced by the injection of CO2 acidified solution is essential for producing reliable model for risk assessment. Specific work, focusing on the near-injection well area and relying on both new experimental and modeling approaches are carried out in the framework of the CO2-DISSOLVED project. The so-called MIRAGES2 (acronym, in French, for “Radial Model for Greenhouse Gas Injection”) experimental device is designed by the GeoRessources laboratory for injection of a CO2-rich aqueous solution in an injection well at the centimeter scale under realistic storage conditions (60°C – 120 bar) [19]. Three flow-through reactive experiments were performed on cylindrical samples composed of Lavoux limestone, a class G Portland cement and a well casing made of stainless steel in order to quantify the effect of CO2-enriched solution on reservoir and well properties. The main transformations of the materials (cement, steel and limestone) were investigated in terms of mineral dissolutions, precipitations, and petrophysical properties. The ongoing monitoring of injection and confining pressures and temperatures as well as the flowrate of the injected solution and the pH of the solution outside of the core plug were implemented. The evolution of the porous network in samples was also investigated after each experiment using 3D X-Ray micro-tomography. The evolution of the cement phase, its carbonation, and the different interfaces were analyzed using the Scanning Electron Microscopy (SEM). The Raman spectroscopy enabled the determination of the nature of the calcite polymorphs precipitated in the cement phase during experiments.
Simultaneously of the experiments, geochemical modelling were performed using the coupled MARTHE-PHREEQC codes [20,21]. The data gathered during experiments were compared with results from numerical reaction-transport codes used to predict the behavior of the geothermal doublet with time. This study combining experimentation and modelling carrying out at the laboratory scale is very important in understanding and predicting the rock behavior at the reservoir scale.
2. Experimental methodology 2.1. Sample description
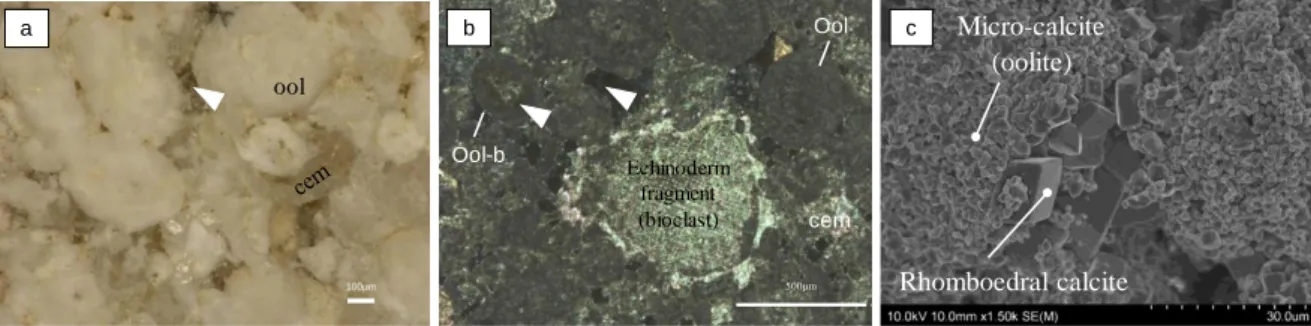
The Lavoux limestone is a Dogger (Mid-Jurassic) oolitic limestone from the Oolithe Blanche Formation of the Paris Basin. Due to its high storage capacity, the deep formation of the Dogger of the Paris Basin was identified as a relevant target for supercritical CO2 storage [24,25] and has been used for hydro-geological and geothermal purposes for 40 years. This study was carried out on plugs sampled on quarry in Chauvigny in the Southwest of the Paris basin. From a structural point of view, the Lavoux limestone is a packstone to grainstone mainly composed of oolites, peloids, and bioclasts linked by a CaCO3 cement (Fig. 1). The oolitic carbonate contains a micritic matrix. Locally, the cement is made up by large size syntaxial sparites (100 – 200µm) and moderate size rhomboedral calcites (10 – 50 µm, Fig. 1c). Petrophysical analyses are performed with focus on porosity and permeability parameters. The total bulk connected porosity is 25.38%. The porosity is mainly composed of pores of 0.03 to 1.46 µm corresponding to the inter-oolites pores. Two other families of pores of about 3 µm and 200 µm correspond to the inter-oolitic porosity (or macroporosity). The permeability of the rock is of 1.1 x 10⁻¹³ m² (88.2 mD). From a chemical viewpoint, the Lavoux limestone is composed of 98% of calcium carbonate (calcite and low magnesium calcite). This sample was selected as being representative of a potential good candidate area for a future implementation of the CO2-DISSOLVED concept.
Fig. 1: Illustration of the oolitic facies: Microscopic view of the rock surface (a). Cathodoluminescence image of thin section of the limestone with the oolites (ool), the syntaxial cementation (cem) in polarized-analyzed light, the oolitic belt (ool-b) and the porosity (arrow). (b). SEM
image (Secondary Electrons) of LAVOUX limestone showing micritic crystals and cement.
Concerning the well material, the cement is a class G Portland cement commonly used for deep well applications. After hydration the cement is mainly composed by portlandite (Ca(OH)2), calcium silica hydrate (CSH), non-hydrated bi/tri calcic silicate (C2S and C3S) and other minor phases containing aluminium and sulfates (ettringite) and iron. The steel used in our experiment is an austenitic stainless steel 316 (EN standard steel name X5CrNiMo17-12-2).
The core assemblage used to reproduce a scaled-down injection well (Fig. 2) is described in Randi et al. [19]. It is made of the steel tube that is fixed to the core plug with the class G Portland cement.
500µm b Ool-b Echinoderm fragment (bioclast) a ool Micro-calcite (oolite) Rhomboedral calcite c cem Ool
Fig. 2: Schematic view of the injection well of the MIRAGES-2 experiment. Dimensions are given in millimeters.
2.2. Experimental conditions
The so-called MIRAGES2 experimental device is extensively described in Randi and al. [19]. It allows to perform continuous and constant injections of CO2 dissolved in aqueous solution (pure water or brine) under pressures and temperatures representative of CO2 storage conditions in the Dogger formations of the Paris basin at 1500 m depth. The core plug samples of limestones are loaded into a 2 Liters “injection autoclave”. The injection of the CO2-enriched fluid is performed at constant flow rate using a double syringe pump coupled to a liquid mass Coriolis flow meter. A mixing autoclave located upstream of the continuous flowrate injection system provides a controlled mixture of dissolved CO2 in solution. During the experiments, regular measurements of the pH are carried out with in situ probes at the inlet and the outlet of the samples. The experimental procedure consists in two steps: i) a cure period during which the sample is subjected to reservoir conditions in a close system. This period lasts approximately 10 days and allows the hydration of the cement phase under the reservoir conditions. ii) a 21 days injection period in which the fluid is injected radially in the injection zone of the rock sample (Fig. 2).
A set of 3 experiments forcing the cores samples to different regimes of injections of specific fluids are performed at 60°C and 120 bar total pressure with a constant rate of 150g.h-1. The first experiment is carried out with pure water in equilibrium with atmospheric CO2 corresponding to the blank experiment (exp #1). The second one is a short-term experiment with the injection of a CO2-rich solution (exp #2), and the third one is a long-term experiment, also with the injection of a CO2-rich solution (exp #3). CaCO3 is added to pure water in order to limit the dissolution of the core-plug during the cure period. Finally, the CO2 concentration in the injected solution is always kept below the limit of solubility of CO2 in the solution in the experimental conditions. This step keeps the injected phase monophasic and prevent from any CO2 bubbling in the “injection autoclave”. The conditions of performed experiments are summarized in Table 1.
Table 1. Overview of experimental conditions Experimental conditions Exp #1:
21 days water
Exp #2 : 2.5 days CO2/water
Exp #3 : 21 days CO2/water
Chemistry of the injected
solution pure water
equilibrated water (15mg.kg-1 CaCO 3) equilibrated water (15mg/kg-1 CaCO 3)
CO2 concentration in the injected
solution (P/T) equilibrated with atmosphere 0.93 mol.kg-1 (30 bar / 20°C) 0.93 mol.kg-1 (30 bar / 20°C) Time of cure 9.1 days 10.5 days 9.9 days Time of injection 21.0 days 2.5 days 20.9 days
2.3. X-ray tomography
The X-ray computed microtomography (CT) is a non-destructive technique used to explore the architecture of a solid sample with a resolution of tens of microns for our samples. This technic produces a 3D-imagery of the internal structure of the sample measuring the X-ray attenuation of the material. In this study, the whole core-plugs with 100×100 mm dimensions are analyzed before and after injection. The several different parameters of acquisition are defined depending on the sample (Table 2). These configurations allow the acquisition of images with a final resolution between 59 and 105 µm.voxel-1. The 3D reconstruction of the sample is performed using the Datos-Rec software. The CT images are interpreted in terms of porous (voids) and solid phases by segmentation thanks to the Interactive thresholding module on the AVISO© software.
The data acquisition are performed at the GeoRessources laboratory using a Nanotom Phoenix (GE).
Table 2: Acquisition parameters for X-ray tomography of the whole core-plug for the different experiments. The resolution (µm.voxel-1) depends
on the span length between the X-Ray source and the sample; the radiography number is the number of images acquired by the detector, it depends on the angular interval between two successive radiographies.
EXPERIMENTS Resolution (µm/voxel) Angular interval (°) radiographies number Exposure time (ms) X-ray tube of nanofocus tension (kV) Beam intensity (µA) Exp #1 100 0.24 1500 1250 110 100 Exp #2 105 0.35 1020 1250 110 50 Exp #3 59.57 0.24 1500 1000 145 300 3. Modelling approach
The experiments of dissolution of a calcite core have been modelled with the MARTHE-PHREEQC numerical code [20]. This code results from the coupling of the MARTHE code [21, http://marthe.brgm.fr/] for flow and transport in porous media, and PHREEQC modules for geochemistry [22,23].
In the first modelling, as a simplifying assumption, the cement has been assumed to be impermeable and non-reactive. In the second modelling, the reactions with the Portland cement have been considered. Both simulations have been performed with a radial grid, supposing a radial symmetry around the well. This makes it possible to greatly reduce the number of cells and hence the calculations time, which is quite long, as it will be shown.
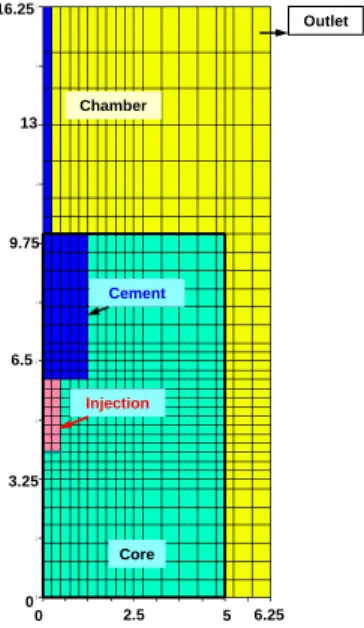
3.1. Geometry of the core and the chamber
The modelled chamber (injection autoclave) is a cylinder of radius 6.25 cm and 16.25 cm height (volume 1.99 liter). The modelled sample is a cylinder of radius 5.0 cm and 10.0 cm height (volume 0.78 liter). The radial irregular grid comprises 35 rows of 19 columns (665 cells). The rows represent circular slices in the vertical direction, and the columns represent the widths in the radial distance. The vertical slice thickness ranges from 0.25 cm to 1.25 cm, and the radial width from 0.25 cm to 0.50 cm. The model grid is displayed in fig.3.
Fig. 3. Modelling radial grid. (Dimensions are in cm). The horizontal axis is the radial distance.
3.2. Flow and transport parameters The hydraulic parameters are:
x Calcite sample: porosity 10 %, hydraulic conductivity 1 mD x Cement: porosity 28 %, hydraulic conductivity nearly 0 (10-20 mD)
x Injection and external chamber: porosity 100 %, hydraulic conductivity = 50 mD
The flow is injected at a rate of 9.375 cm3/hour in each of the 16 cells representing the injection chamber (total flow is 150 cm3/hour). The outlet is set in the upper right corner with a prescribed arbitrary hydraulic head of 20 cm (0.2 bar). The hydro-dispersive parameters are: molecular dispersion = 10-9 m2/s, dispersivity = 1 cm
4. Results
4.1. Evolution of the limestone reservoir
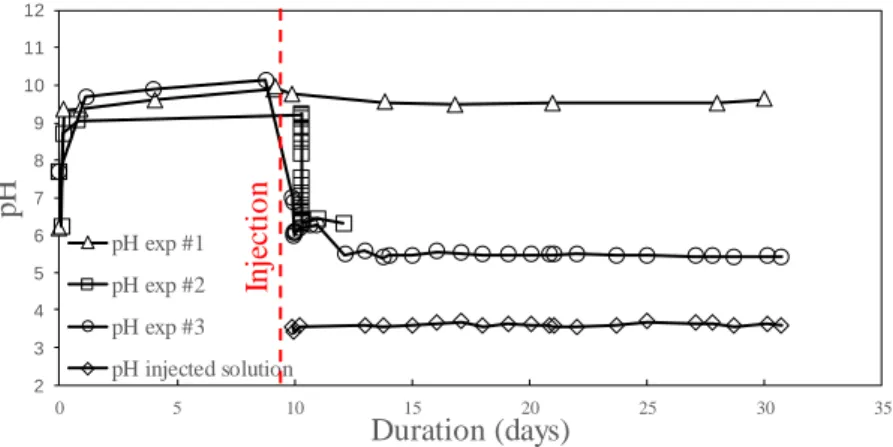
The in situ measurements of pH during experiments (Fig. 4) indicate an increase during the cure period up to values between 9.2 and 10 depending on the experiments. The ettringite and the portlandite of the cement phase act as a buffer and control the pH of the solution.
0 Chamber Core Cement Injection Outlet 6.5 13 3.25 16.25 0 2.5 5 6.25 9.75
For the blank experiment (exp #1), a slight decrease of the pH occurs during the 8 first days of the injection in the core-plug of pure water at equilibrium with the atmospheric CO2 with a value dropped from 9.8 to 9.4. The pH then remains relatively constant until the end of the experiment. For experiments with dissolved CO2 (exp#2 and #3), as soon as the CO2-rich acidified solutions with a pH value of 3.6 is injected, the pH at the outlet of the core-plug dropped to 6 during the first 30 minutes of injection due the formation and dissociation of the carbonic acid. Then a sill lasting 1 or 2 days is followed by a new acidification with values reaching 5.4. This phenomenon demonstrates a competition between the carbonates and the cement phases to control the pH.
Fig. 4: pH measurements of the injected solution and of the solution at the outlet of the core-plug during the different experiments. The pH of the injected CO2-rich solution is given for comparison.
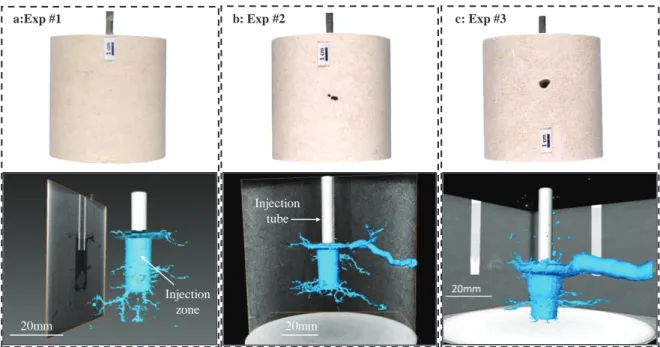
The observations of the core-plug removed from the autoclave after experiment with pure water does not reveal visible changes neither apparent trace of dissolution on the outer part of the sample (Fig. 5a). Experiments #2 and #3 with CO2-rich solutions lead to the formation of millimetric to centimetric holes visible on the wall of the core plug. These holes appear after only 2.5 days of injection (Fig. 5b) and increase in diameter when the alteration time increases (Fig. 5c).
The CT analysis shows the development of a radial porous network induced by the injection of the different fluids (Fig 5). Despite the alkaline environment, a dissolution pattern resulting on the injection of pure water is observed and corresponds to a ramified and complex wormhole structure mainly at the bottom of the injection point (Fig 5a bottom part). These wormholes can be defined as dominant with branches formation. No modification of the well geometry is noticed at the injection point. After 2.5 days of injection of aggressive fluid (exp #2), significant dominant wormhole structure is also observed at the bottom of the injection point. However, in this case, a main wormhole forms from the upper part of the well to the outer part of the core-plug. Secondary channels branching from the predominant channel of dissolution are also visible (Fig. 5b bottom part). The appearance of this large diameter wormhole after 2.5 days of injection demonstrates that the injection of the acidic solution leads to a rapid and directional dissolution of the carbonate minerals. However, after this experiment, the geometry of the well has not changed near the injection point. The continuous renewal of the acidic fluid during 21 days (exp #3) increases significantly the diameter of the main wormhole at the upper part of the well (from 9.8 mm after 2.5 days to 13.3 mm after 21 days, on average). Radial channel branching is also present at the bottom of the well with a radial extent length similar to exp #2. This largest wormhole carries the majority of the injected fluid, resulting in a constant and rapid increase of its diameter at the expense of the shorter wormhole [26] located at the bottom of the well that seems to stop growing and eventually to close up. After 21 days of injection, the well with initial cylindrical shape becomes conical. 2 3 4 5 6 7 8 9 10 11 12 0 5 10 15 20 25 30 35
pH
Duration (days)
pH exp #1 pH exp #2 pH exp #3 pH injected solutionIn
je
ctio
n
Fig. 5: View of the samples after experiment and after drying for 24h at room temperature (upper part) and comparison of dissolution patterns (3D models) based on results of X-ray computed tomography (CT) (bottom part) for (a) pure water in equilibrium with atmospheric CO2 (exp #1),
(b) short-term experiment with CO2-rich solution (exp #2) and (c) long-term experiment with CO2-rich solution (exp #3).
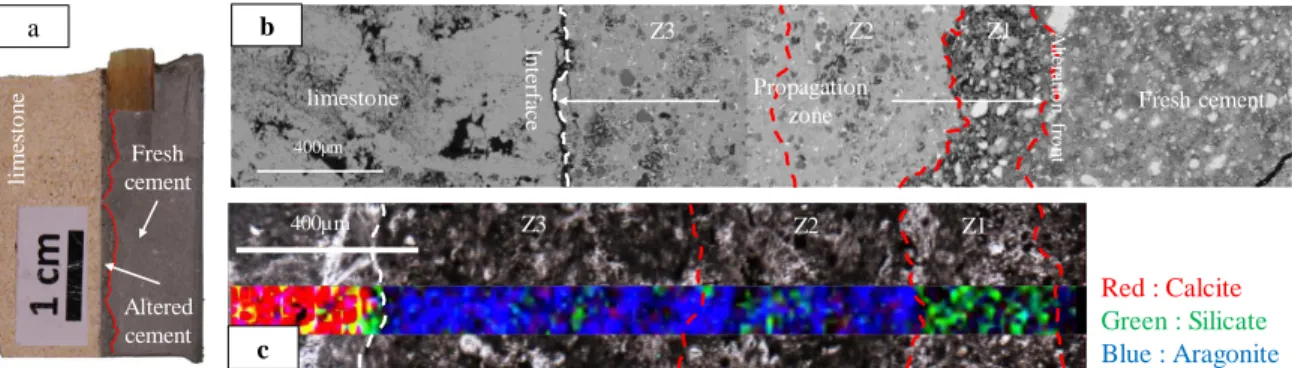
4.2. Results of the cement/rock interface evolution.
Observation of the cement/rock interface is realized from polished cross sections of the core-plugs. Experiments exp #1 (Fig. 6) and exp #3 (Fig. 7) with the same duration of alteration are compared. The detail observation of the interfaces reveals a good mechanical cohesion and the absence of fractures or cracks between the cement and the limestone for both experiments. Nevertheless, a reactive zone parallel to the interface develops from the interface into the cement zone. The optical images of the thin sections (Fig.6b and 7b) highlight this zone (red line).
Fig. 6: Experiment exp #1 (pure water): a) Sampling at the rock/cement interface, b) SEM (BSE) picture showing the cement alteration and the cement/limestone interface and c) Raman mapping at the rock/cement interface shows a limited calcite precipitation in the cement phase. In the blank experiment (exp #1), the thickness of the alteration zone is about 450 µm corresponding to an averaged alteration speed of 0.88µm.h-1. The SEM observations reveal an increase of the porosity of the cement matrix at the
cement/limestone interface (dissolution zone, Fig. 6b). This is due to the leaching of the calcium bearing phase (C2S, C3S and CSH) of the cement by the injected solution. The Raman mapping shows also a limited carbonation of the cement phases (red dots in the cement).
20mm a:Exp #1 20mm b: Exp #2 c: Exp #3 Injection tube Injection zone Fresh cement limestone dissolution zone A lte ra tio n fr o n t cement 100µm limestone In te rfa ce Red = calcite Green = silicate
Black : No characteristic signal b a c cement lim es to n e
In the case of the injection of the acidic solution (exp 2 and #3), the thickness of the alteration front is around 457 µm after 2.5 days of injection and 1,518 µm after 21 days corresponding to an average speed of alteration of 7.61 and 3.03 µm.h-1 respectively. The reaction zone can be subdivided in 3 zones corresponding to different chemical processes (Fig. 7). A first zone (Z1), with a higher porosity, where the CSH matrix is dissolved, can be identified. The Raman mapping shows the presence of the C2S and C3S silicate phases (green dots in the cement). In the two other zones (Z2 and Z3), the SEM observation (Fig. 7b) reveals a dense CSH matrix with a precipitation intimately related to the matrix. Raman analysis indicates that this secondary precipitation corresponds to aragonite (Fig. 7c). In Z2 and Z3, the C2S and C3S are replaced by an amorphous silica phase. The area close to the interface with the rock (Z3) appears more porous than the intermediate zone (Z2).
Fig. 7: Experiment #3 (CO2-rich solution): a) Sampling at the rock/cement interface with an altered zone of the cement delimited by the red line,
b) SEM (BSE) picture showing the cement alteration divided in three zones and c) Raman mapping at the rock/cement interface showing a strong carbonation of the cement with aragonite precipitation.
5. Discussion
5.1. Dissolution of the limestone reservoir
The thermodynamics instability triggered by the massive injection of dissolved CO2 into a carbonated reservoirs induces a dissolution front at the vicinity of the injection well. The acidic solution in contact with the rock formation reacts with the porous matrix and leads to the increase of the local permeability and thus of the mass transfer resulting in an increasing of porosity. Conversely, precipitation phenomenon can be observed due to an enrichment in cations, especially Ca2+, induced by carbonate dissolution and a local oversaturation of the solution with respect to carbonates. The prominence of the processes depends on reactive transport mechanisms, i.e. on the coupling between dissolution/precipitation and diffusion/advection. An anisotropic evolution of the system was highlighted during experimental studies and was dependent on different factors as the intrinsic characteristics of the rock (nature, permeability, heterogeneity, reactivity,…), the process parameters (injection flowrate, CO2 concentration,…) and thermodynamics conditions (Pressure, Temperature). Percolation experiments of a CO2-enriched fluid through a core-flood carbonated rock sample have been performed in geological reservoirs conditions closed to our experiments by different authors [6,8,9,10]. These results underline the diversity of the dissolution patterns as a function of the operating conditions influencing the mass transfer in the geological environment. A high flowrate generally stimulates the growth of a very localized dissolution with the appearance of highly conductive channels, referred as wormholes. The distribution and the geometry of these channels are controlled by the heterogeneity of the pore structure. The wormhole leads to a preferential flow path at the expense of the porous matrix [10]. It is important to remark that acidic solution penetrates predominantly within local domains of pre-existing fractures [27,28] and vuggy carbonates [29]. Moreover, depending on the PCO2 in the system, uniform dissolution can also be observed [6] far from the injection point. The determination of the dissolution pattern and the impact on the petrophysical properties of the host reservoir remains complex mainly because of the competition of the acidic effect (decrease of the pH) induced by the injection of a CO2-rich solution and the transport phenomena which can lead to local oversaturation. Dimensionless numbers (the Péclet-Damköhler numbers) characteristic of the reactive transport problem can help to characterize the
limestone Fresh cement
400µm A lterati o n fro n t Propagation zone Red : Calcite Green : Silicate Blue : Aragonite 400µm Z3 Z2 Z1 In te rfa ce Z3 Z2 Z1 b a c Altered cement Fresh cement lim es to n e
dissolution regimes. The Péclet number Pe represents the significance of the advective rate on the diffusion rate and is defined as:
D
Pe
X
u
l
where l (cm) is the representative pore lenght and could be taken as the square root of the permeability, D is a coefficient of effective molecular diffusion (cm-2.s-1), and X is the interstitial velocity (cm.s-1) defined here as the Darcy velocity Q (cm.s-1) divided by the porosity I.
The Damköhler number represents the ratio of the dissolution to the advective rates and is defined as:
X
l
k
Da
u
where, k is a reaction rate (s-1). The k constant is calculated multiplying the mineral dissolution rate R (mol.cm-2.s-1) by the specific surface area Sspec of the calcium carbonate (cm2.mole-1). According to our experimental conditions, the calculated Péclet number ranges from 0.0152 to 0.1 with a diffusion coefficient for Ca2+ ranging from 7.5 x 10⁻⁶ cm2.s -1 [6] to 2 x 10⁻⁵ cm2.s-1 [8]. For the determination of the Damköhler number, the kinetic constant is determined using the empirical law of Pokrovsky et al [30], k=10-7.51 mol.cm-2.s-1 and a specific surface area from 106 to 1.5 × 106 cm2.mole-1 [31]. The calculated values range from Da = 0.033 to 0.05.
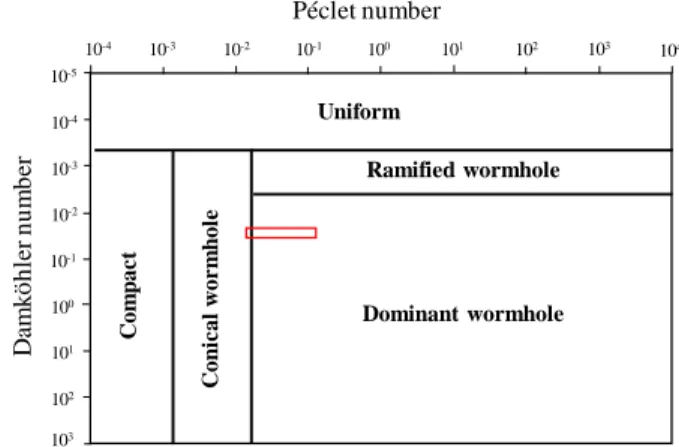
According to the Peclet/Damköhler diagram obtained from Golfier et al [32] in a system close to our experiments (Fig.8), the results tend to indicate that a dominant wormhole dissolution and potentially conical wormhole pattern could be initiated at small scale near the injection point. Initiation of compact or uniform dissolution pattern seems less probable because the transport mechanism is strongly dominated by advection rather than diffusion.
The development of the shape of the wormholes is mainly subjected to a dominant advection effect at the early stage of the injection. Once the big wormhole crosses the core plug radius, the diffusive effect tends to erode its walls inducing an increase of the channel diameter and the modification of the shape of the well in a conical aspect.
It is important to underline that prominent anisotropy of the multilevel dissolution pathways are observed, while the injection process is basically isotropic from the bottom hole. Different assumptions can explain this anisotropic patterns. The first assumption is the presence of an initial anisotropy of the porous network. This phenomenon could be also induced by the mechanical consequences of the sample preparation procedure or could be due to the regional stress field linked to the geological history of the Lavoux formation. Another explanation could be the geometry of the experimental test bench constraining a preferential pathway for the fluid circulation. Anyway, the injection of aggressive fluids induces a dominant dissolution regime that will be responsible for the modification of the porosity and permeability of the rock at a large scale.
Fig. 8: Diagram representing the dissolution regime and pattern depending on Péclet and Damköhler numbers in a system close to our experiment. [29] The red box corresponds to the dissolution pattern expected in our experimental conditions.
Uniform Ramified wormhole Dominant wormhole C om p ac t C o n ica l w o rm h o le Péclet number D am k öhle r num be r 10-4 100 101 102 10-1 10-2 10-3 10-4 10-3 10-2 10-1 100 101 102 103 104 10-5 103
5.2. Evolution of the cement/limestone interface
The injection of the fluids, pure or CO2-rich water, in the rock during 21 days doesn’t alter the mechanical cohesion between the cement and the limestone. However, a reactive zone parallel to the interface appears in the cement phase. During the week of cure, the cement phase is hydrated under geological conditions of pressure and temperature and imposes, together with the limestone, an alkaline environment to the system with initial pH around 10. The injection of water, more or less acidic as a function of the experiment, induces chemical reactions with calcium silicate phases of the Portland cement. The reactivity leads to the dissolution of portlandite and a part of the CSH phases, the leaching of C2S and C3S and the precipitation of carbonates in the cement matrix. All these chemical reactions imply petrographic changes mainly in the cement phase close to the interface with the limestone. Porous zones are the result of dissolution processes and are adjacent to carbonates zones, where aragonite precipitate, clogging the porosity between the CSH.
SEM microscopic observations and Raman mapping highlight three different alteration zones (Z1, Z2 and Z3) widely described in the literature and corresponding to the different processes described above. The portlandite (CH) of the cement matrix is dissolved by the CO2-enriched solution and is responsible for calcium release in solution. Another calcium contribution comes from the dissolution of CSH and the leaching of C2S and C3S leading to the development of the zone Z1. The diffusion of the calcium coupled to the diffusion of the carbonate ions induces the precipitation of secondary carbonates, mainly aragonite, responsible for the low permeability and carbonated zones Z2 and Z3. The zone Z3 located at the rock/limestone interface undergoes, in a second step, the action of the renewed acidic solution and thus the partial dissolution of the secondary carbonates. This secondary dissolution implies a localized increase of the porosity by comparison with zone Z2.
Despite the chemical reactivity of the Portland cement used in the experiment, the interface between cement and limestone keeps a good mechanical cohesion. The carbonation processes don’t seem to damage the physic-chemical properties of the cement, with a possible profitable effect linked to the decrease of the porosity of the carbonated zones. Moreover, it has been shown that the mean rate of cement alteration decreases with the duration of the experiment, likely because the carbonated zone plays the role of a diffusion barrier. However, the zone Z3 has to be carefully studied since a secondary dissolution is observed, which could lead to a possible opening of the interface. This zone could be a weakness of the injection well.
5.3. Chemical-Transport modelling
The modelling will explore thee aspects to compare to experimental results. This is the general dissolution of the limestone reservoir, the wormholing phenomenon and the influence of the Portland cement.
5.3.1. Results from the flow modelling
The computed hydraulic pressure difference between inflow and outflow is 5.2 bar.
The residence time in cells in the radial direction from the center of the injection chamber depends on velocity and also on the cell size. This residence time is 7.8 seconds in the cell at 0.5 cm from the injection, 11 seconds in the cell at 0.75 cm and 28 seconds in the cell at 2 cm. The total residence time in the sample in the radial direction is 1050 seconds.
5.3.2. Reactive transport modelling with kinetic: limestone only
For this simulation MARTHE-PHREEQC has been used, with parallel computation of the chemical reactions. In the simulation it has been assumed, for simplification purpose, that there is no coupling between the progressive mineral dissolution and the variation of flow due to the modification of porosity and of permeability.
The chemical database which has been used is “Phreeqc Thermoddem” (release 1.10, 12/11/2014) developed at BRGM (French Geological Survey).
The initial solution in the sample has a temperature of 60°C, a pH of 8.23, and a CO2(g) saturation of -3.45. The injected acidified solution contains 0.93 mol of CO2 per kgw at a temperature of 60°C, resulting in a pH of 3.165.
In order to get accurate results it is very important to use an adequate calculation time step. A first guess is on the order of the residence time in the cells, which corresponds to a Courant number equal to unity. It has been seen that this residence time ranges from 8 seconds, near the injection chamber to 30 seconds 2 cm away. The adequacy of the time step has been verified by decreasing it until results do not vary significantly. It has been found that a value of 2.4 seconds gives accurate results. The total simulation period being 20 days, this corresponds to 0.72 million calculation time steps which is considerable. With a 9 processors 2015 workstation the duration of the calculation is 27 hours, (82 % of it for the geochemistry calculations).
The calculation shows that after 10 days the calcite is dissolved in a radius of about 2.0 cm, i.e. 1.5 cm from the injection chamber (Fig. 9) which is coherent with the observations. The profile is relatively sharp, however attenuation is observed due to dispersion and dissolution kinetics.
Fig. 9. Calcite concentration in the sample calculated after 5 days (left) and 10 days (right). Dark blue = Fully dissolved, Orange color = No dissolution.
5.3.3. Modelling with channeling effects
In order to address the channeling effect due to heterogeneity which has been observed in the laboratory experiments, a simulation has been performed with a radial zone with a higher permeability. The higher permeability induced a higher velocity (and a higher dispersion) which pushed away more rapidly the water enriched in Ca ions resulting from the calcite dissolution. In this zone the dissolution is then faster.
For this modelling, in order to simulate a fracture or a fissured zone, the hydraulic conductivity has been increased in a radial slice of vertical thickness of 2.5 mm intercepting the injection chamber. In this slice the hydraulic conductivity was increased by a factor of 100.
Fig 10 shows calcite concentration after 2 days, 5 days, 10 days and 15 days. It appears that the dissolution is fast. After 10 days, the calcite has already been totally dissolved into the circular “fracture”. The dissolution near the injection chamber is decreased, obviously because it is concerned by less flow.
Fig. 10: Modelling of the channeling effect: calcite concentration in the sample after 2 days, 5 days, 10 days and 15 days. Dark blue = Fully dissolved, Orange colore= No dissolution.
0 2.5 5
3.25 9.75
6.5
5.3.4. Reactive transport taking into account the cement
For this simulation, the cement is taken into account assuming a 100% Portlandite composition. The calculated pH of the initial equilibrated solution in the portlandite is 11.37. In order to speed up the calculations, the dissolution kinetic of the minerals has been neglected which is acceptable as it has been verified in preliminary simulations.
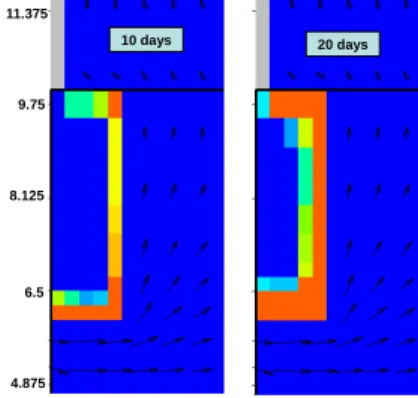
The portlandite dissolution calculated after 10 days and 20 days is displayed in Fig. 11. The calcite concentration calculated in the sample with reaction with the cement is quite similar to the simulation results considering only calcite. However it appears that, as was expected, there is calcite precipitation near the border of the zone where portlandite was present.
Fig. 11. Portlandite dissolution in the sample calculated after 10 days (left) and 20 days (right). Dark blue = No dissolution, Red = Fully dissolved (21.96 mol/L of sample).
6. Conclusion and perspective
The MIRAGES2 experiment is designed to perform the injection of CO2-rich solutions under the geological conditions of a combined “geothermal heat recovery/CO2 sequestration” site. This 1/20th scale model of an injection is used to perform experiments under realistic conditions of injection and gives important information on i) the evolution of the reservoir, in terms of petro-physical properties, ii) the reactivity of the well materials, Portland cement and steel, submitted to an aggressive fluid, and iii) the evolution of the cement/rock interface which could be a source of leakage in case of weakness. The experiments performed at 60°C and 120 bar, with CO2 aqueous concentration up to 0.93 mol.kgw-1, have shown that i) the main dissolution process in the limestone reservoir is wormholing, ii) the carbonation of the Portland cement does not seem to damage the physico-chemical properties of the cement, iii) despite a strong dissolution of the reservoir, the cement/rock interface remains cohesive all along the duration of the experiments. However, the interface between rock and cement has to be studied on longer periods since secondary dissolution of carbonated cement can occur at this interface implying a possible weakness.
The MIRAGES2 laboratory experiments have been modelled with the MARTHE-PHREEQC code [21] from BRGM. The numerical simulations reproduce reasonably well the experimental observations. This validates the use of the MARTHE-PHREEQC code for this experiment modelling to contribute in the prediction of the long term effects of the injection of a CO2-rich aqueous solution in a limestone aquifer.
Acknowledgements
This study was financially supported by the French National Research Agency (ANR CO2-DISSOLVED-12-SEED-0009).
References
[1] D’Aprile A. Advances and slowdowns in Carbon Capture and Storage technology development. ICCG Reflection No. 48, May 2016 [2] Basava-Reddi L. IEAGHG, "Geothermal Energy and CO2 Storage", 2010/TR3, August, 2010
4.875 9.75 6.5 8.125 10 days 20 days 11.375
[3]Kervévan C, Bugarel F, Galiègue X, Le Gallo Y, May F, O’Neil K, Sterpenich J. -CO2-DISSOLVED- A Novel Approach to Combining CCS and Geothermal Heat Recovery. Ed In: EAGE, Sustainable Earth Sciences, Technologies for Sustainable Use of the Deep Sub-surface, Pau, France,.30 Sept.- 4 Oct. 2013.
[4] Kervévan C, Beddelem M. H, and O'Neil K. -CO 2-DISSOLVED- A novel concept coupling geological storage of dissolved CO2 and geothermal heat recovery. Part 1: Assessment of the integration of an innovative low-cost, water-based CO2 capture technology. Energy Procedia 63; 2014. p. 4508–4518.
[5] Fredd CN, Fogler HS. Influence of transport and reaction on wormhole formation in porous media. AIChE J. 44 (9); 1998. p. 1933–1949. [6] Luquot L, Gouze P. Experimental determination of porosity and permeability changes induced by injection of CO2 into carbonate rocks. Chem
Geol 265; 2009. p. 148–59.
[7] Noiriel C, Luquot L, Madé B, Raimbault L, Gouze Ph, Van der Lee J. Changes in reactive surface area during limestone dissolution: an experimental and modelling study. Chem. Geol. 265 (1–2); 2009. p. 160–170.
[8] Smith MM, Sholokhova Y, Hao Y, Carroll SA. CO2-induced dissolution of low permeability carbonates. Part I: Characterization and experiments. Advances in Water Resources 62, Part C; 2013. p 370–387.
[9] Gharbi O, Bijeljic B, Boek E, Blunt MJ. Changes in pore structure and connectivity induced by CO2 injection in carbonates: a combined pore-scale approach. Energy Procedia 37; 2013. p. 5367–5378
[10] Ott H and Oedai S. Wormhole formation and compact dissolution in single- and two-phase CO2-brine injections. Geophys. Res. Lett., 42; 2015.p. 2270–2276.
[11] Rosenbauer RJ,Koksalan T, Palandri JL. Experimental investigation of CO2–brine–rock interactions at elevated temperature and pressure: Implications for CO2 sequestration in deep-saline aquifers. Fuel Processing Technology 86; 2005. p. 1581–1597.
[12] Noiriel C, Bernard D, Gouze Ph., Thibaut X. Hydraulic properties and microgeometry evolution in the course of limestone dissolution by CO2-enriched water. Oil Gas Sci. Technol. 60 (1); 2005. p. 177–192.
[13]Le Guen Y, Renard F, Hellmann R, Brosse E, Collombet M, Tisserand D, Gratier J-P. Enhanced deformation of limestone and sandstone in the presence of high Pco2 fluids. Journal of geophysical research 112; 2007. 21pp.
[14] Grgic D. Influence of CO2 on the long-term chemomechanical behavior of an oolitic limestone. Journal of geophysical research 116; 2011. 22 pp.
[15] Kutchko BG, Strazisar BR, Lowry GV, Thaulow N. Degradation of Well Cement by CO2 under Geologic Sequestration Conditions. Environ. Sci. Technol. 41; 2007. p. 4787–4792.
[16] Carey JW, Svec R, Grigg Reid, Zhang Jinsuo, Crow W. Experimental investigation of wellbore integrity and CO2-brine flow along the casing-cement microannulus. International Journal of Greenhouse Gas Control 4; 2009. p. 272–282.
[17] Carey JW. Geochemistry of Wellbore Integrity in CO2 Sequestration: Portland Cement-Steel-Brine-CO2 Interactions. Mineralogy and Geochemistry 77; 2013. p. 505–539.
[18] Carroll S, Carey JW, Dzombak D, Huerta N, Li L, Richard T, Um W, Walsh S, Zhang L. Review: Role of chemistry, mechanics, and transport on well integrity in CO2 storage environments. International Journal of Greenhouse Gas Control 49; 2016. p. 149–160.
[19] Randi A, Sterpenich J, Morlot C, Pironon J, Kervévan C, Beddelem MH, Fléhoc C. CO2-DISSOLVED: a Novel Concept Coupling Geological Storage of Dissolved CO2 and Geothermal Heat Recovery - Part 3: Design of the MIRAGES-2 Experimental Device Dedicated to the Study of the Geochemical Water-Rock Interactions Triggered by CO2 Laden Brine Injection. Energy Procedia 63; 2014. p. 4536–4547.
[20] Thiéry, D. – Modélisation 3D du Transport Réactif avec le code de calcul MARTHE v7.5 couplé aux modules géochimiques de PHREEQC. Rapport BRGM/RP-65010-FR ; 2015. 164 p., 88 fig.
[21] Thiéry, D. – Code de calcul MARTHE - Modélisation 3D des écoulements dans les hydrosystèmes - Notice d’utilisation de la version 7.5. Rapport BRGM/RP-64554-FR; 2015. 306 p., 150 fig.
[22] Parkhurst, D.L. and Appelo C.A.J. - Description of Input and Examples for PHREEQC Version 3 - A Computer Program for Speciation, Batch-Reaction, One-Dimensional Transport, and Inverse Geochemical Calculations. U.S. Department of the Interior, U.S. Geological Survey Techniques and Methods 6–A43; 2013.
[23] Parkhurst D.L. and Wissmeier L. - PhreeqcRM: A reaction module for transport simulators based on the geochemical model PHREEQC. Advances in Water Resources 83; 2015. p 176 189.
[24]Vidal-Gilbert S, Nauroy J-F, Brosse E. 3D geomechanical modelling for CO2 geologic storage in the Dogger carbonates of the Paris Basin. International Journal of Greenhouse Gas Control (3); 2009. p. 288–-299.
[25] Brosse E, Badinier G, Blanchard F, Caspard E, Collin PY, Delmas J, Dezayes C, Dreux R, Dufournet A, Durst P, Fillacier S, Garcia D, Grataloup S, Hanot F, Hasanov V, Houel P, Kervévan C, Lansiart M, Lescanne M, Menjoz A, Monnet M, Mougin P, Nedelec B, Poutrel A, Rachez X, Renoux P, Rigollet C, Ruffier-Meray V, Saysset S, Thinon I, Thoraval A, Vidal-Gilbert S. 2010. Selection and Characterization of Geological Sites able to Host a Pilot-Scale CO2 Storage in the Paris Basin (GéoCarbone-PICOREF). Oil & Gas Science and Technology – Rev. IFP, Vol. 65, No. 3; 2010. p. 375–403.
[26] Hoefner M.L, Fogler HS. Pore evolution and channel formation during flow and reaction in porous media. AIChE J. 34 (1); 1988. p. 45–54. [27]Detwiler RL, Glass RJ, Bourcier WL. Experimental observations of fracture dissolution: The role of Peclet number on evolving aperture
variability. Geophysical Research Letters vol 30 n°12 1648; 2003. p. 50-1–50-4.
[28] ElkhouryJE, Ameli P, Detwiler RL. Dissolution and deformation in fractured carbonates caused by flow of CO2-rich brine under reservoir conditions. International Journal of Greenhouse Gas Control 16S; 2013. p. S203–S215.
[29] Izgec O, Zhu D, Hill AD. Numerical and experimental investigation of acid wormholing during acidization of vuggy carbonate rocks. Journal of Petroleum Science and Engineering 74; 2010.p 51–66.
[30] Pokrovsky OS, Golubev SV, Schott J, Castillo A. Calcite, dolomite and magnesite dissolution kinetics in aqueous solutions at acid to circumneutral pH, 25 to 150 °C and 1 to 55 atm pCO2: New constraints on CO2 sequestration in sedimentary basins. Chemical Geology 265; 2009. p 20–32.
[31] Holford ICR and Mattingly GEG.Surface areas of calcium carbonate in soils. Geoderma 13; 1975. p 247--255
[32] Golfier F, Zracone C, Bazin B, Lenormand R, Lasseux D, Quintard M. On the ability of a Dracy scale model to capture wormhole formation during dissolution of a porous medium. J. Fluid Mech. 457; 2002. p 213–254.