HAL Id: hal-02333171
https://hal.archives-ouvertes.fr/hal-02333171
Submitted on 25 Oct 2019HAL is a multi-disciplinary open access archive for the deposit and dissemination of sci-entific research documents, whether they are pub-lished or not. The documents may come from teaching and research institutions in France or abroad, or from public or private research centers.
L’archive ouverte pluridisciplinaire HAL, est destinée au dépôt et à la diffusion de documents scientifiques de niveau recherche, publiés ou non, émanant des établissements d’enseignement et de recherche français ou étrangers, des laboratoires publics ou privés.
Multiple parapatric pollinators have radiated across a
continental fig tree displaying clinal genetic variation
Hui Yu, Enwei Tian, Linna Zheng, Xiaoxia Deng, Yufen Cheng, Lianfu Chen,
Wei Wu, Wattana Tanming, Dayong Zhang, Stephen Compton, et al.
To cite this version:
Hui Yu, Enwei Tian, Linna Zheng, Xiaoxia Deng, Yufen Cheng, et al.. Multiple parapatric pollinators have radiated across a continental fig tree displaying clinal genetic variation. Molecular Ecology, Wiley, 2019, 28 (9), pp.2391-2405. �10.1111/mec.15046�. �hal-02333171�
Multiple parapatric pollinators have radiated across a continental fig tree displaying clinal genetic variation
Hui Yu1,6 Enwei Tian1, Linna Zheng1, Xiaoxia Deng1, Yufen Cheng1, Lianfu Chen1, Wei Wu1, Wattana Tanming2, Dayong Zhang3, Stephen G. Compton4, Finn Kjellberg5
Abstract
The ways that plant-feeding insects have diversified are central to our understanding of terrestrial ecosystems. Obligate nursery pollination mutualisms provide highly relevant model systems of how plants and their insect associates have diversified and the over 800 species of fig trees (Ficus) allow comparative studies. Fig trees can have one or more pollinating fig wasp species (Agaonidae) that breed within their figs, but factors influencing their number remain to be established. In some widely distributed fig trees, the plants form populations isolated by large swathes of sea, and the different populations are pollinated by different wasp species. Other Ficus species with continuous distributions may present genetic signatures of isolation by distance, suggesting more limited pollinator dispersal, which may also facilitate pollinator speciation. We tested the hypothesis that Ficus hirta, a species for which preliminary data showed genetic isolation by distance, would support numerous pollinator species across its range. Our results show that across its range F. hirta displays clinal genetic variation and is pollinated by nine parapatric species of Valisia. This is the highest number of pollinators reported to date for any Ficus species, and it is the first demonstration of the occurrence of parapatric pollinator species on a fig host displaying continuous genetic structure. Future comparative studies across Ficus species should be able to establish the plant traits that have driven the evolution of pollinator dispersal behaviour, pollinator speciation and host plant spatial genetic structure.
KEYWORDS
Co-evolution, dispersal, gene flow, mutualism, plant growth form, speciation
1Guangdong Provincial Key Laboratory of Digital Botanical Garden and Key Laboratory of Plant Resource Conservation and Sustainable Utilization, South China Botanical Garden, The Chinese Academy of Sciences, Guangzhou, China; Centre for Plant Ecology, CAS Core Botanical Gardens, Guangzhou, China
2 Queen Sirikit Botanic Garden, Chiang Mai, Thailand
3 State Key Laboratory of Earth Surface Processes and Resource Ecology and MOE Key Laboratory for Biodiversity Science and Ecological Engineering, College of Life Sciences, Beijing Normal University, Beijing, China
4 School of Biology, University of Leeds, Leeds, UK
5 CEFE, CNR, EPHE, IRD, Université de Montpellier, Université Paul-Valéry Montpellier, Montpellier, France
Correspondence
Hui Yu, South China Botanical Garden, The Chinese Academy of Sciences, Guangzhou, China; Centre for Plant Ecology, CAS Core Botanical Gardens, Guangzhou, China.
Email: yuhui@scib.ac.cn
Funding information
National Natural Science Foundation of China, Grant/Award Number: 31670395, 31630008 and 31370409; Guangzhou
Science and Technology Plan Project, Grant/Award Number: 201707010351; External Cooperation Program of Bureau of International Co-operation Chinese Academy of Sciences,
Grant/Award Number: GJHZ201321; CAS President's International Fellowship Initiative, Grant/Award Number: 2018VBA0040; Vietnam National Foundation for Science and Technology Development, Grant/Award Number: 106.11 -2012.82
1 INTRODUCTION
Insects feeding on plants represent one of the most common forms of trophic interaction seen in terrestrial ecosystems, and the relationship between plants and insects has generated the most species -rich animal taxa ever seen on the planet (Price, 1980, 2002). These insects are typically associated with one or a few related host plants, so different plants host different insects
(Strong, Lawton, & Southwood, 1984). Processes such as local adaptation, the geography of speciation and the consequences of secondary sympatry are key issues in understanding the dynamics of community diversification (Mittelbach & Schemske, 2015). However, almost no studies have explored how the insect community on a plant changes across its geographic range (Lawton, Lewinsohn, & Compton, 1993; Leather, 1986; Lewinsohn & Roslin, 2008). A study across Papuan rainforests found little variation in herbivorous insect communities over distances of up to 1,000 km (Craft et al., 2010; Novotny et al., 2007), while a study of
nonpollinating fig wasps on Ficus rubiginosa Desf. ex Ventenat in Australia detected, within a set of seven widespread morphospecies, four pairs of parapatric cryptic species, along a 2,000 -km transect (Darwell & Cook, 2017).
In nursery pollination mutualisms, pollinating insects breed in floral structures of the plants they pollinate (Dufaÿ & Anstett, 2003). Insects involved in nursery pollination mutualisms constitute particularly favourable biological models for investigating the geographic variation of diversity on a host plant as the insect's prevalence on a host is high and their presence is easy to detect. Furthermore, some of these mutualisms are species rich allowing comparative studies. Nursery pollination systems, such as those involving Yucca and Yucca moths (Pellmyr, 2003), Glochidion and Epicephala moths (Kawakita, 2010) and fig trees (Ficus) and fig wasps
(Agaonidae) (Cook & Rasplus, 2003), were initially envisioned as systems in which a single species of pollinating insect breeds in and pollinates a single host plant species. This simple pattern is now largely rejected because of accumulating examples where one insect species pollinates several host species (Cornille et al., 2012; Hembry et al., 2018; Pellmyr, 1999; Wachi, Kusumi, Tzeng, & Su, 2016; Wang, Cannon, & Chen, 2016), or cases where several insect species pollinate a single host (Darwell, al -Beidh, & Cook, 2014; Li, Wang, & Hu, 2015; Yang et al., 2015). A general model of plant–insect diversification in these nursery pollination mutualisms must therefore take into account the factors influencing their relative rates of speciation and explain why some of the plants have a single pollinator when others have two or more.
Fig trees (Ficus) represent the most species-rich group of plants offering nursery pollination rewards and the most diversified lineage within the Moraceae (Brunn -Lund, Verstraete, Kjellberg, & Rønsted, 2018). Fig trees are pollinated by female fig wasps that enter Ficus inflorescences to lay their eggs. Because fig wasps carry pollen from their natal plants, they only transfer pollen from those plants in which their larvae can develop. This is a more direct link between suitability for offspring development and subsequent pollen transfer than in any other brood pollination mutualism and may favour co-adaptation (Anstett, Hossaert-McKey, & Kjellberg, 1997). However, a more rapid rate of speciation among fig wasps, compared with their hosts, is to be expected given their much shorter generation times (Petit & Hampe, 2006; Thomas, Welch, Lanfear, & Bromham, 2010). From this perspective, the long -held assumption that each fig tree was pollinated by a single species of pollinator was problematic.
More extensive sampling and molecular techniques that have facilitated separation of
with several pollinators (Darwell et al., 2014). However, we still know little about how genetic diversity is structured within Ficus species and how this is related to the distributions and genetic diversity among the fig wasp pollinators that it supports (Bain et al., 2016; Rodriguez et al., 2017; Wachi et al., 2016). Where several pollinator species share a single Ficus host, they are generally sister species (Yang et al., 2015). The recorded exceptions, where nonsister pollinator species occupy the same host species, have almost all been within two Ficus clades that have diversified recently, and this appears to have favoured host shifts (Cruaud et al., 2012; Jousselin et al., 2008; Machado, Robbins, Gilbert, & Herre, 2005; Yang et al., 2015). The main modes of fig wasp speciation therefore appear to vary across lineages.
Widely distributed plants grow in areas with a wide range of environmental conditions, which will vary in suitability for their associated insects, including their pollinators. Reflecting this, plant -eating insects usually only occupy a subset of the ranges of their hosts (Strong et al., 1984), but fig trees require an effective and specific pollinator to be present wherever they grow. Widely distributed Ficus species would therefore be predicted to support additional species of pollinator compared to species with narrow, more climatically homogeneous, ranges. Only a few widely distributed Ficus species have been sampled at multiple sites across their geographic ranges. Ficus racemosa L. is pollinated by a single fig wasp across India and by another in China and SE Asia, with additional sister species of pollinators in the island of Borneo and Australia (Bain et al., 2016; Kobmoo, Hossaert -McKey, Rasplus, & Kjellberg, 2010). More localized differentiation is evident among island populations of Ficus septica Burm. f., in the Philippines (Conchou, Cabioch, Rodriguez, & Kjellberg, 2014; Lin, Yeung, Fong, Tzeng, & Li, 2011; Rodriguez et al., 2017), and along elevation gradients (Segar et al., 2017; SoutoVilarós et al., 2018), where several different pollinators are present.
The absence of divergence among the pollinators of F. racemosa across large swathes of its continental range is likely to reflect their ability to disperse over large distances. Spatial genetic structuring across the range of a plant species provides an indication of the geographic extent of their gene flow, and in the case of Ficus, it has revealed a widely varying extent of dispersal among their pollinators. Paternity analyses have shown that some fig wasps transport pollen between large fig trees growing over 100 km apart (Ahmed, Compton, Butlin, & Gilmartin, 2009), whereas population structuring shows that other, smaller, species have much more localized gene flow (Chen, Zhu, Compton, Liu, & Chen, 2011; Liu, Compton, Peng, Zhang, & Chen, 2015). These differences in dispersal behaviour among the pollinators of different trees appear highly likely to influence differentiation and speciation of both their own populations as well as those of the host plants they pollinate.
Previous data have shown that Ficus hirta Vahl presents a pattern of spatial genetic structure suggesting genetic isolation by distance across continental South -East Asia (Yu & Nason, 2013). Here, based on extensive sampling, we describe the population genetic structure of F. hirta and its pollinating fig wasps across most of their continental range. We addressed the following questions: (a) To what extent is the population structure of the plant co -incident with that of its pollinator(s)—have they diversified at the same spatial scales - (b) Even in the
absence of major geographic barriers, is this widespread host tree pollinated by a diverse assemblage of fig wasps within its range - And (c) if so, what are the ecological
consequences—do individual plants have the chance to receive pollination services from more than one fig wasp species - This is the first study comparing spatial genetic structuring in a widespread fig species and its pollinating wasps that encompasses most of their ranges. It is also the first broad -scale study of joint genetic structuring between pollinator fig wasps and a fig tree species displaying genetic isolation by distance. We discuss the results in terms of the factors that may have resulted in the patterns of diversification we observed and what they suggest about modes of speciation.
2 MATERIALS AND METHODS 2.1 Study species
Like all Ficus species, F. hirta (family Moraceae, subgenus Ficus, section Eriosycea, Berg, 2003) has unique protogynous inflorescences called figs. These are hollow and lined internally with numerous tiny male and female florets. Pollination can only be achieved when pollen is carried by female fig wasps from their natal fig into receptive figs through a narrow aperture called the ostiole. Like about half of all Ficus species, F. hirta is functionally dioecious, with figs that differ in floral structure on “male” and “female” trees. Figs of the former support the development of the fig wasp offspring that when mature can transport pollen to receptive figs. In contrast, the figs on female trees develop seeds and no pollinator offspring. Ficus hirta is a species of secondary, disturbed habitats and typically grows as a shrub or treelet. It can reach a maximum height of about 5 m, but most mature individuals are much shorter (Berg & Corner, 2005). Its figs are small and produced in the leaf axils. Female figs ripen to a bright red and are mainly eaten by birds (Corlett, 2006). As many as 50 figs can be present on a tree, but their development is asynchronous, which reduces the peak numbers of figs available for pollination or dispersal at any one time and can also allow pollinator cycling between figs on the same male tree (Jia, Dan, Zhang, & Chen, 2007).
The distribution of F. hirta extends northwards from the island of Java (Indonesia) in the south to China in the north and westwards into northeast India, Nepal and Sikkim (Berg & Corner, 2005). This extensive geographic range (covering over 30° of latitude and 30° of longitude) encompasses a range of tropical and subtropical biomes. Berg (2007) restricted F. hirta to what was previously known as F. h. subsp. hirta. In the following, we will use the name F. hirta for F. hirta sensu Berg (2007). Following that definition, F. hirta has a disjunct
distribution. South of Thailand, it is absent from Peninsular Malaysia and it is only present in South Sumatra and North Java (Berg & Corner, 2005). Population genetic studies, mainly from China, detected some spatial genetic structuring across F. hirta populations and concluded that low nuclear differentiation, combined with high interpopulation differentiation and geographic structuring of chloroplast variation, indicated that gene flow via seed dispersal was more limited than via dispersal of pollen (Yu & Nason, 2013). Genetic differentiation in nuclear genes between populations of F. hirta on the Chinese mainland and Hainan Island has also been detected, and corresponding differences were also present between the populations of the tree's pollinators (Tian et al., 2015). Two morphologically distinguishable pollinator fig wasps have been described from the figs of F. hirta. Valisia javana javana Mayr was reared from F. hirta figs collected in Java, and a second subspecies, Valisia j. hilli Wiebes, was described from figs collected in Hong Kong (Wiebes, 1993).
2.2 Sampling
Between 2006 and 2014, we sampled the leaves of F. hirta (31 locations) and its pollinating fig wasps (32 locations) across mainland South -East Asia and south to the island of Java
(Supporting Information Table S1). The samples were up to 4,100 km apart (north–south) and reached the northern, eastern and southern limits of the range of F. hirta.
Within locations, F. hirta individuals were typically sampled at intervals of 3–5 m, with no individuals located more than 200 m apart. Their leaves were collected and dried in plastic bags containing silica gel. At each location, 10–30 figs containing mature fig wasp offspring were also removed from the plants and placed individually in fine -mesh bags, where the fig wasps were allowed to emerge. The pollinators were then separated from other species of fig wasps and preserved in 95% ethanol that was stored at -20°C until DNA extraction. A single female fig wasp per fig was used for genetic analyses.
2.3 Pollinating wasps
The mitochondrial genetic marker mtCOI was sequenced from an average of 9.9 individuals per location (range 1–28, total 330), and microsatellite loci were genotyped from an average of 18.9 other individuals from the same locations (range 2–32, total 568). To complement the data, the nuclear ITS2 nuclear gene was amplified for 201 individuals.
Genomic DNA was extracted from the whole body of each fig wasp using the EasyPure Genomic DNA Extraction Kit (TransGen, Beijing, China). A 681 bp fragment of the mtCOI gene was then sequenced following the protocol used in previous studies (Tian et al., 2015). A 689 bp fragment of the ITS2 gene was amplified in 201 individuals using the universal primer pair (ITSR 5 CGCCTGATCTGAGGTCGTGA 3 ITSF 5
-ATTCCCGCACCACGCCTGGCTGA -3 -; Lopez -Vaamonde, Rasplus, Weiblen, & Cook, 2001) and the same PCR amplification reaction volume as for the COI gene. The reaction was optimized and programmed on a MJ Thermal Cycler (PTC 200) as one cycle of denaturation at 94°C for 5 min, 35 cycles of 30 -s denaturation at 94°C, 30 s at a 55°C annealing temperature and 30 -s extension at 72°C, followed by 8 -min extension at 72°C. All amplified PCR products were purified using QIAquick spin columns (Qiagen) and were sequenced in an ABI 3730xl capillary sequencer using bigdye terminator V 3.1 chemistry (Applied Biosystems).
Previously published protocols were also used to genotype individuals at nine unlinked microsatellite loci (1–78, 1–141, A34, A80, A99, B30, C25, F17 and H33) that had been previously developed for Valisia j. hilli (Tian, Yu, Zhang, & Nason, 2011). The alleles used in the present study were the same as those used previously to analyse southeast China and Hainan populations (Tian et al., 2015).
2.3.2 Pollinating fig wasp sequence analysis
We did not detect any indications of pseudogenes, such as multiple peaks in chromatograms, stop codons or frameshift mutations (Song, Buhay, Whiting, & Crandall, 2008). Sequences were aligned using MUSCLE (Edgar, 2004) implemented in mega 6.0 (Tamura, Stecher, Peterson, Filipski, & Kumar, 2013) with manual corrections.
Previous work has shown that the fig wasp genus Valisia, including samples collected from F. hirta, is monophyletic (Cruaud et al., 2010). We downloaded from GenBank the COI sequences of the eight Valisia species available including one sequence (FJ619191) of V. javana.
Published phylogenies have shown that the genera Ceratosolen and Kradibia constitute an outgroup relative to all other pollinating fig wasps (Cruaud et al., 2010, 2012). We included representatives of these two genera (two species of Ceratosolen and 11 species of Kradibia) in the phylogenetic analysis.
Dated phylogenetic trees that included the downloaded sequences and all our sequenced haplotypes were estimated using Bayesian methods. The best -fit model, GTR+I+G, was selected by hierarchical likelihood ratio tests in the program modeltest 3.7 (Posada & Crandall, 1998), where GTR+I+G was favoured. We ran beast 2.3.1 (Bouckaert et al., 2014) to explore the best combinations of substitution, clock and population models, with 10 million
generations. Twice the difference in Ln harmonic mean of the likelihood of each model
combination (LnBF; Nicholls et al., 2010) was calculated with tracer 1.6 to assess the preferred models, based on the LnBF table (Kass & Raftery, 1995). Using the GTR+I+G model, we ran beast under a strict clock, an uncorrelated exponential relaxed clock or lognormal relaxed clock with each population model (constant size, exponential growth, yule process, birth–death process). Bayes factors indicated that the combination of an uncorrelated exponential clock and the exponential population growth model was the best (with LnBFs from 0.47 to 198.19 and most >15).
Two independent runs of 30 million iterations were performed, with genealogies and model parameters sampled every 1,000 iterations. The chain convergence was checked based on ESSs (effective sample sizes) viewed in tracer 1.6. All ESSs for each parameter had to be larger than 200. The phylogenetic tree was summarized by treeannotator 1.8.1 and then viewed by figtree
1.3.1 (Rambaut, 2006). The dates of the most recent common ancestor were scaled by a mutation rate of 1 because no suitable fossil record was available to calibrate node ages. We used the published 34.8 (46.5–24.2) Ma age for the crown group of the genus Valisia that had been estimated previously for a very similar set of Valisia species that used numerous genetic markers and a comprehensive set of species within Agaonidae (Cruaud et al., 2012). We used the phylogenetic tree to detect candidate species characterized by low within -clade genetic distances and much larger between -clade genetic distances.
We calculated Kimura 2 -parameter (K2P) distances within and between clades for COI haplotypes using mega 6.06. Tajima's D, Fu and Li's D, and Fu and Li's F (Fu & Li, 1993) were used to detect signatures of population expansion or selection using dnasp 5.0 (Librado & Rozas, 2009). We then explored the relationships of COI haplotypes within each clade using phylogenetic networks built separately for each clade with tcs 1.21 (Clement, Posada, & Crandall, 2000) using the 95% statistical parsimony criterion as a connection limit, with loops in the network resolved following Crandall and Templeton's methods (1993). Variation in COI sequences among populations within clades and within populations was partitioned using hierarchical analysis of molecular variance (AMOVA) implemented in arlequin 3.0 (Excoffier, Laval, & Schneider, 2005). Significance tests were based on 10,000 permutations.
We used jMOTU as a complementary method to detect molecular operational taxonomic units (MOTUs) using a range of threshold differences. All the COI sequences used in the phylogenetic analysis were analysed using jMOTU at cut -offs from 0 to 21 bases (Jones, Ghoorah, & Blaxter, 2011). The aggregation parameter was 97%, and the input minimum sequence percentage was set to 95%.
As ITS2 evolves more slowly than COI, we applied a simplified analysis of the data. We calculated K2P distances within and between clades as for COI haplotypes using mega 6.06, and we used a maximum -likelihood tree to reconstruct the phylogenetic relationships based on all ITS haplotypes. The ML tree was reconstructed using mega 6.06 (Tamura et al., 2013), and node supports were assessed based on 2,000 bootstrap replicates.
2.3.3 | -Pollinating fig wasp microsatellite data analysis
Classical indices of genetic diversity were estimated using genalex 6.1 (Peakall & Smouse, 2006). In order to represent the global data, we performed a factorial correspondence analysis following Nenadi - and Greenacre (2007) as implemented in Genetix (Belkhir, Borsa, Chikhi, Raufaste, & Bonhomme, 1996–2004). Because multiple locus population genetics data should not be analysed using phylogenetic trees, we constructed an unweighted neighbour -joining tree of multilocus microsatellite genotypes using darwin v6 (Perrier & Jacquemoud -Collet, 2006), thus grouping genotypes according to the numbers of shared alleles, without taking into account gene evolution. Bootstrap number was set at 2,000. Finally, we used Bayesian clustering to assign multilocus microsatellite genotypes to clusters using structure 2.2 (Pritchard, Stephens, & Donnelly, 2000). The admixture ancestry and correlated allele frequencies model were used with five independent runs each of 500,000 MCMC iterations and
500,000 burn -in steps. We ran structure with varying K values (the number of clusters) from 2 to 30 (the maximum number of populations available for microsatellite analysis) to explore how different values of K resulted in the assignment of species and populations to different clusters. The resulting assignment patterns were explored to detect co -occurrence of different clades within a sampling location. Results obtained from the factorial correspondence analysis, neighbour -joining tree and Bayesian clustering were compared.
The presence of a relationship between (log) geographic distance and genetic differentiation FST/(1 - FST) values (isolation by distance) was evaluated with genalex 6.1 within the two clades detected in the above analysis and for which data from more than three locations were available, using a Mantel test with 10,000 permutations. When structuring was detected within
clades, the distribution of pairwise FST values was explored to detect potential structuring into subclades.
2.4 Ficus hirta
2.4.1 Ficus hirta DNA extraction and amplification
We used previously published methodological details for cpDNA and nuclear microsatellite sequencing and genotyping (Yu & Nason, 2013), and re -used all the previously published cytoplasmic data. The set of analysed microsatellite loci was reduced to avoid some
amplification/reading problems, leaving seven microsatellite loci available: FS4 -11, Frub38, Frub398 and Frub436 (Yu & Nason, 2013), and FH3, FH10 and FH47 (Zheng, Nason, Liang, Ge, & Yu, 2015). Using these, we analysed plant microsatellite data from two locations in southeast China and two locations in Hainan, and cytoplasmic data from 14 locations in southeast China and Hainan. This was in addition to the microsatellite data and cytoplasmic data from 17 locations elsewhere within the range of the plant, so we had a total of 21 locations with microsatellite data and 31 locations with cytoplasmic data.
2.4.2 Ficus hirta cytoplasmic DNA analysis
The sequences of the two cpDNA regions were concatenated (1,367 bp) and then aligned using MUSCLE in mega 6.06 with manual corrections. A matrix of combined sequences for trnL -trnF and trnS -trnG was constructed, and haplotypes were distinguished on the basis of
nucleotide and insertion/deletion differences. The same procedures as for wasp COI data were used to determine polymorphism indices, detect signatures of population expansion and establish haplotype networks.
We used AMOVA to test the significance of cpDNA differentiation among populations (999 permutations) and tested for genetic isolation by distance by conducting a Mantel test of the correlation between FST/(1 - FST) and log -transformed geographic distance for all population pairs (999 permutations).
2.4.3 Ficus hirta microsatellite analyses
Parameters of genetic diversity were calculated as for pollinator microsatellite data. As with the pollinating wasp microsatellite data, we performed a factorial correspondence analysis, we build a neighbour -joining tree, and we used Bayesian clustering to assign multilocus microsatellite genotypes to clusters. The number of clusters was set to vary from 1 to 21. The relationship between FST and geographic distance was plotted to visualize genetic differentiation. The significance of the correlation between FST/(1 - FST) and the log geographic distance was evaluated as with the insects.
3 RESULTS
3.1 Pollinating fig wasps
3.1.1 Pollinating fig wasp gene sequences
After alignment and exclusion of sites with gaps, 502 bp long COI sequences were obtained for phylogenetic analysis. A total of 162 haplotypes were obtained and 267 COI polymorphic sites were identified from the 330 sequenced fig wasps (Supporting Information Table S2).
Haplotype sequences have been deposited in GenBank under Accession nos. KR873011– KR873047 and MF472722–MF472846. A 689 bp fragment of the ITS2 gene was amplified in 201 individuals. A total of 18 haplotypes were obtained. The sequences have been deposited in GenBank under Accession nos. MF467418–MF467426 and MF467428–MF467436.
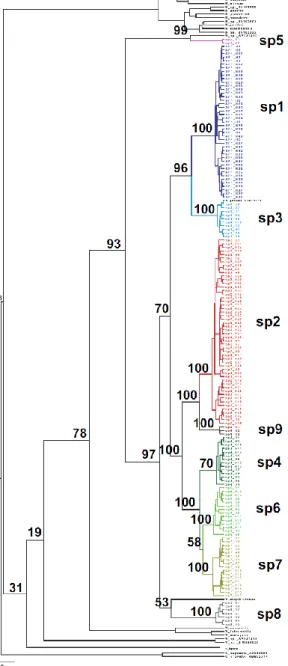
The Bayesian COI tree separated the F. hirta pollinating fig wasps into nine clades (Figure 1). Gene sequence differences were weak within clades (Kimura -2 -parameter = 0.001–0.014) and high between clades (0.064–0.272) (Figure 1, Supporting Information Figure S1, Supporting Information Table S3). The between -clade distances are similar to those between currently recognized Agaonidae species (Chen, Compton, Liu, & Chen, 2012; Yang et al., 2015).
The ITS2 maximum -likelihood tree separated the F. hirta pollinating wasps into seven clades (Supporting Information Figure S2, Supporting Information Table S4). ITS2 data were obtained for several individuals from each of 30 of the 31 locations for which COI data were obtained (Supporting Information Table S1). The ITS2 sequences grouped the genotypes according to sampling location (Supporting Information Table S5) in the same way as the
FIGURE 1 -COI Bayesian phylogenetic tree of the Valisia fig wasp pollinators associated with Ficus hirta, including all GenBank sequences of pollinating sp5 wasps reared from Ficus subg. Ficus sect. Eriosycea Miq. and some sequences of Ceratosolen and Kradibia used as outgroups. Posterior probabilities of the nodes are indicated as percentages
COI sequences (Supporting Information Table S2), except that the ITS2 sequences provided less resolution and pooled the locations that gave COI clade 2 and COI clade 9 and pooled the locations that gave COI clade 6 and COI clade 7. Hence, cytoplasmic and nuclear sequence data provided consistent location -level assignment to clades, although the ITS2 sequences provided less resolution.
The program jMOTU groups sequences into clades (molecular taxonomic units) so that the minimum difference, expressed in numbers of bases, between two different MOTUs is larger than the chosen cut -off value. With increasing cut -off values, the number of inferred MOTUs drops rapidly and then stabilizes when withinspecies variation is included within a single MOTU, before dropping again when closely related species are pooled. The number of clades inferred from the COI sequences dropped to 33 MOTUs for a cut -off value of 9 and remained constant up to a cut -off value of 11 (Supporting Information Figure S3). For these cut -off values, all the clades recognized in the COI tree were separated into single MOTUs except for clade 7, which was separated into three MOTUs and clade 6 that was also separated into 3 MOTUs. Starting at the cut -off value of 17 bases (which is the 2.5% cut -off threshold value proposed as a general rule -of -thumb for species discrimination with COI; Jones et al., 2011) and up to a cut -off value of 21 bases, jMOTU gave 29 MOTUs. Each of the nine clades recognized from the phylogenetic tree (Figure 1) was recognized as a single MOTU, and the two sequences of fig wasps (AY842415 and HM802690) collected from Ficus langkokensis grouped into a single MOTU. Hence, the jMOTU analysis supports the proposition that each clade recognized in the COI tree is a separate operational taxonomic unit, that is a species. Overall, the different analyses of sequence data support the conclusion that clades 1–9 can be considered as distinct species, and this conclusion is applied from here on (as sp1–sp9).
The pollinators collected in Singapore (sp5) formed part of a distinct clade that had the largest gene sequence differences relative to the other species pollinating F. hirta (for cytoplasmic COI, Figure 1, Supporting Information Table S3; for nuclear ITS2, Supporting Information Figure S2, Supporting Information Table S4). This clade included a COI GenBank sequence
(AY642456) of a fig wasp collected from F. androchaete Corner, a Ficus species endemic to Borneo, where F. hirta is absent (Berg & Corner, 2005). The other major clade comprised sp1– 4 and sp6–9 reared from F. hirta, plus the GenBank sequence for Valisia esquiroliana Chen & Chou. The dated tree obtained with beast (Supporting Information Figure S1) suggests that separation of sp5 from the remaining eight species associated with F. hirta began about 16 (11– 22) Ma and the two tightly knit subgroups of species (sp2 + sp9) and (sp4 + sp6 + sp7)
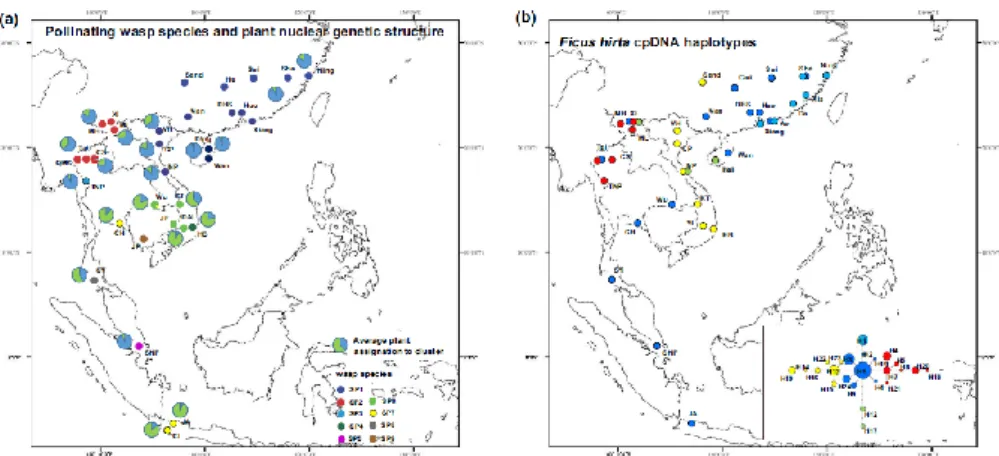
diverged from each other about 8 Ma (Supporting Information Figure S1). These two species groups were also recovered in the ITS2 phylogeny (Supporting Information Figure S2). The estimated dates of divergence among the taxa within these subgroups that we are recognizing as distinct species varied between 4.6 (sp2 + sp9 and sp4 + sp6 + sp7) and 6.0 (sp1 + sp3) Ma. A striking feature was the limited overlap in the distribution of species. We only observed examples of a pair of species occurring together in two locations, location CS (with sp2 and a low frequency of sp3) in north Thailand and Wu in northeast Thailand (with sp4 together with small numbers of sp7; Figure 2a). In addition, GenBank Accession no. FJ619191 belonged to sp3 and was recorded from XI in SW China, an area where we only collected sp2. Where species were collected from several sites, their distributions were generally geographically coherent, but sp7 has a disjoint distribution. It is present in east Thailand and in Java, but absent from peninsular Malaysia
FIGURE 3 -Neighbour -joining microsatellite genotype networks for (a) the pollinating wasps and (b) Ficus of F. hirta. Note the disjoint distribution of sp7, the allopatric distribution of the closely related (according to COI data) sp2 and sp9 and the parapatric distribution of the closely related (according to COI data) sp4, sp6 and sp7. For cpDNA, colours are used to show the localized distribution of haplotype H1 and of the different branches of the haplotype network hirta.
where its host plant is also absent and is apparently replaced in peninsular Thailand by sp8 (Figure 2a).
AMOVA revealed considerable haplotype variation within species, as well as within and among locations (Supporting Information Table S6). The exception was sp5, where haplotype diversity was strikingly low, with only two almost identical haplotypes represented in the 17 individuals (Supporting Information Figure S4). In the two more extensively sampled species, we observed negative deviations from neutral assumptions in both sp1 (Tajima's D value = -1.51, p = 0.055; Fu and Li's D = -2.75, p < 0.05; and Fu and Li's F = -2.69, p < 0.05) and sp2 (Tajima's D = -1.88, p < 0.05; Fu and Li's D = -3.49, p < 0.01; and Fu and Li's F = -3.40, p < 0.01). Deviations were not significant in the other species. The COI haplotype networks (Supporting Information Figure S4) revealed a subdivision in sp1 into a southeast China group of haplotypes, a Hainan Island group of haplotypes and a Vietnamese group of haplotypes, with some haplotype exchange between southeast China and Hainan Island.
3.1.2 Pollinating fig wasps microsatellite data
Diversity indices for microsatellite markers are given in Supporting Information Table S7. Pairwise genetic differentiation between location values (FST) is given in Supporting Information Table S8.
The first eight components of the discriminant analysis separated the nine species (Supporting Information Figure S5). The analysis also shows differentiation within sp1 according to
geographic origin (China, Hainan and North Vietnam), as suggested by the COI analysis (Supporting Information Figure S4). While ITS2 sequences did not allow separation of sp2 from sp9 and sp6 from sp7, the discriminant analysis of microsatellite data separates them without ambiguity on component 2. Hence, the discriminant analysis confirms the presence of nine nuclear genetic clusters corresponding to the species detected using the cytoplasmic COI sequences.
In the neighbour -joining tree (Figure 3a), the different species are again separated, except for sp5, which seems to be close to sp1 from Vietnam, a result that is not compatible with the nuclear and cytoplasmic sequence data. The subdivision of sp1 into three geographic entities is supported. The close proximity between sp4 and sp6 is also supported, as is the slight
separation within sp7 depending on geographic origin.
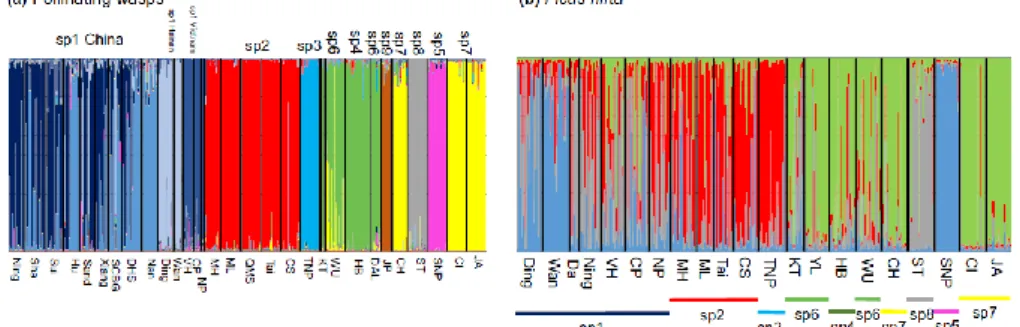
The bar plots of assignments of individuals to clusters using structure with variable numbers of clusters are presented in Supporting Information Figure S6a. Irrespective of the different values of K, assignments to clusters are generally strong, except for the south China locations for sp1 for which mixed assignments suggest the presence of some variation among locations. From K = 6 to 22, the populations of sp1 from Hainan island and Vietnam are each assigned to their own cluster. For K = 11, all the species are separated into different clusters except for sp4 and sp6 (Figure 4a). For K = 20 and above, sp4 and sp6 are separated into distinct clusters. For K = 22 and above, the individuals of sp7 collected in Thailand were perfectly separated from those collected in Java. Consistently, the separation of sp3 to sp9 is somewhat unstable across the different values of K. As with the COI data, and despite different individuals being used for COI and microsatellite analyses, the microsatellite data suggested assignment of one individual to sp3 in location CS and another individual to sp7 in location Wu.
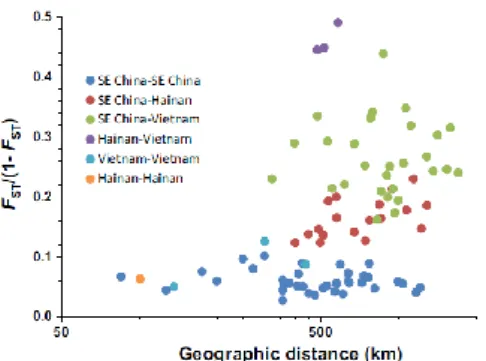
Genetic isolation by distance could only be explored for sp1 and sp2 as the other species were only sampled in 1–3 locations. There was significant isolation by distance, as shown by the relationship of FST/(1 - FST) with distance (Mantel test) in sp1 (R2 = 0.13, p = 0.008), but not in sp2 (R2 = 0.023, p = 0.459). However, the signature of isolation by distance in sp1 was generated by the differentiation of sp1 into the three genetically differentiated geographic entities already detected in the COI, in the discriminant and in the structure analyses (located in southeast China, Hainan and Vietnam, Figure 5), despite obtaining a single ITS2 haplotype for sp1 (with 33, 11 and 9 individuals genotyped, respectively). There was no genetic isolation by distance within any of these three geographic entities.
FIGURE 4 -Bar plots of membership probabilities of individuals to the different clusters (as vertical bars) from the structure analysis. (a) Genetic structure of the pollinating wasps obtained at K = 11; (b) genetic structure of the plant host, Ficus hirta, obtained at K = 4. For the
pollinator, sp1 genotypes from continental China present mixed assignments to two clusters suggesting genetic isolation by distance, while genotypes from Hainan and genotypes from Vietnam are each assigned to a particular cluster. For F. hirta, there is no clear global pattern of
clustering, suggesting clinal variation in gene frequencies. The Singapore genotypes (SNP) cluster with Hainan Island (south China) genotypes Ding and Wan
3.2 Ficus hirta
3.2.1 Ficus hirta cpDNA analysis
We detected 24 haplotypes (H1–H24). Sequences of the trnL -trnF and trnS -trnG regions have been deposited in GenBank under Accession nos. GQ452019–GQ452032 and MF467405– MF467416.
We did not detect any signature of selection or of population expansion on cpDNA sequences. The cpDNA network and the distribution of these haplotypes among populations are presented in Figure 2b and Supporting Information Table S9. The haplotype network is centred on haplotype H8, and no haplotype differed from H8 by more than six mutations (Figure 2b). Haplotype H8 was observed throughout the range of F. hirta. Haplotype diversity was high in the north -central part of our sampling zone, where sampling density was highest. AMOVA confirmed significant differentiation among populations (FST = 0.799; p < 0.001). The colours correspond to different branches of the network, and their geographic distribution suggests spatial structuring. The regression of population pairwise FST on the natural logarithm of geographic distance was also significant (R2 = 0.0472, p = 0.003, Mantel test), confirming that there was spatial genetic structure among populations of the plant.
3.2.2 Ficus hirta microsatellite analysis
Genetic diversity parameters are given in Supporting Information Table S10. Pairwise genetic differentiation between location values (FST) is given in Supporting Information Table S11. The first four components of the discriminant analysis organized the data along a north–south axis, except for the genotypes from Singapore, which were placed close to the northern
genotypes (Supporting Information Figure S7). The discriminant analysis suggests much more continuous genetic variation in F. hirta than in its pollinators (compare Supporting Information Figures S5 and S7).
As with the discriminant analysis, the neighbour -joining tree separates the data along a north–south axis (Figure 3b). The Singapore samples and the Trang samples each form highly homogeneous clusters. As in the discriminants analysis, the Trang samples are placed with southern locations while the Singapore samples are placed with northern locations.
The bar plots of assignments of individuals to clusters of varying total number using structure are presented in Supporting Information Figure S6b. For K = 2, genotypes from all northern locations plus Singapore were mainly assigned to cluster one and genotypes from southern locations were mainly assigned to cluster two (Supporting Information Figure S6b). The geographic distribution of assignments (Figure 2a) showed: (a) progressive geographic genetic variation of F. hirta along a north–south axis; (b) some geographic east–west geographic genetic structure; and (c) a placement of the Singapore samples that does not correspond to its geographic location. For K = 4, genotypes from the northern locations had mixed assignments to two clusters, supporting an east–west spatial genetic structure, genotypes from Singapore still clustered with genotypes from the north, and genotypes from Trang formed a distinct group (Figure 4b).
We also explored spatial genetic structure by plotting genetic differentiation between locations against geographic distance (Figure 6). Comparisons between locations showed a general pattern of genetic isolation by distance (R2 = 0.204, permutation test, p = <10 -3). Singapore was an exception, as it was most similar to the geographically distant northern locations.
Taken together, the factorial analysis, the structure assignments to clusters and the neighbour -joining tree all suggest that the genetic diversity of F. hirta is organized according to a pattern of genetic
FIGURE 5 -Spatial genetic structuring of the pollinator fig wasp sp1 based on nuclear
microsatellite data. Genetic differentiation between locations is plotted according to geographic distance. The colours indicate the geographic origin of the locations being compared. Dark blue: comparison between two locations from southeast China; red: comparison between a location in southeast China and one in Hainan Island; green: comparison between a location from southeast China and one from Vietnam; violet: comparison between a location from Hainan Island and one from Vietnam; light blue, comparison between two locations from Vietnam; orange: comparison between the two Hainan Island locations. The species is
structured into three genetic groups: southeast China, Hainan and Vietnam, the same structure as revealed by the cytoplasmic data (Supporting Information Figure S2)
isolation by distance. Despite their southern location, the Singapore genotypes belong with the northern genotypes. Furthermore, the local pollinator (sp5) is only distantly related to the other pollinator species.
4 DISCUSSION
4.1 Species status of the pollinators
Although different pollinating wasp individuals were genotyped using COI, ITS2 and microsatellites, the parapatric distribution of the wasp clades allows direct comparison of results obtained with the different markers. Cytoplasmic and nuclear markers subdivide the pollinating wasps into the same nine clades. The COI divergence between clades (ranging from 5.4% to 28%, with most values above 10%) is larger than the divergence previously reported between sister species of fig pollinating wasps that share the same host (2.4%–7.4%; Yang et al., 2015). Furthermore, the nine clades can be separated morphologically (Wiebes, 1993; J.Y. Rasplus, com. pers.) and we therefore conclude that F. hirta is pollinated by nine species of fig wasps in our study zone, which covered most but not all of the range of the plant.
Sp5 is not closely related to the other pollinators of F. hirta. It was recorded from Singapore, where our data confirm an earlier
FIGURE 6 -Pairwise genetic differentiation between locations in Ficus hirta, as a function of distance, based on microsatellite data. Red points: comparisons involving the Singapore location.
proposition that F. hirta is not native (Berg & Corner, 2005). We suggest that sp5 is the regular pollinator of another Ficus species that has colonized F. hirta in Singapore. Fig trees planted outside their native range are known to similarly be capable of supporting successful
development by fig wasps that usually breed in the figs of another Ficus species (Cook & Segar, 2010; Wang et al., 2016). Sequences from GenBank suggest that Valisia esquiroliana Chen & Chou is nested within the group of Valisia species associated with F. hirta. This fig wasp was described from Ficus triloba Buch. -Ham. ex Voigt, a species closely related to F. hirta (Berg, 2007; Berg & Corner, 2005). Genetic analyses incorporating these two Ficus species will be required to clarify their evolutionary relationships.
Genetic differentiation was detected within the distribution of pollinator sp1. Its populations are divided into three genetic groups located in continental China, Hainan Island and Vietnam. Such differentiation could be a first step towards speciation. Experimental data are needed to determine whether these genetic groups are interfertile. Reproductive isolation could arise rapidly in fig pollinating wasps as they display a high prevalence of Wolbachia that could cause cytoplasmic incompatibilities (Haine & Cook, 2005) and they display systematic assortative mating due to mating in their natal figs before dispersal (Anstett et al., 1997).
4.2 The biogeography of Ficus and their pollinators
Ficus hirta displays a signature of genetic isolation by distance with both nuclear microsatellites and the cytoplasmic haplotypes, with no marked subdivision into distinct gene pools. It has been proposed that speciation in nursery pollinators and their host plants may be decoupled (Hembry & Althoff, 2016) and our results provide an example of this phenomenon.
The disjunct distribution of sp7, with a 2,000 -km gap and with three species of pollinating wasps (sp5, sp8 and sp9) located in between, suggests that pollinators can successfully colonize distant host plants and establish populations there. A similar example is known from Australia, where one pollinator of F. rubiginosa is present in the cool south and at a higher altitude in the warmer north, resulting in a 1,500 -km distribution gap (Sutton, Riegler, & Cook, 2016). This suggests that pollinating fig wasp distributions are plastic and do not necessarily reflect a classical biogeographic history. Indeed, the biogeographic history of F. racemosa populations differs from that of its pollinator species, despite their identical separation into large gene pools (Bain et al., 2016). Similarly, in F. septica, an ecologically divergent pollinating fig wasp has colonized a 2,000km range previously only occupied by three parapatric pollinating wasp species (Rodriguez et al., 2017). Thus, the distributions of fig pollinating wasp species seem to be dynamic and reveal cases of successful establishment of long distance migrants. The long -range dispersal abilities of at least some fig wasps should facilitate this (Ahmed et al., 2009). The mismatch distributions of COI sequences in the two bestsampled species (sp1 and sp2) provide signatures of either selective sweeps or population expansion. This is similar to what has been found in the pollinators of F. pumila (Chen et al., 2012) and in a pollinator of F. septica (Lin, Yeung, & Li, 2008). It has been proposed that these signatures are due to recurrent regional extinctions of pollinating wasps during extreme climatic events, but not of their host plants, followed by population expansions (Tian et al., 2015). Contemporary examples of this phenomenon have been documented in Florida (hurricane), southern France (frost) and the north of Borneo Island (El Nino -associated draught; Tian et al., 2015). Climatic episodes such as these make fig wasp species ranges intrinsically dynamic.
The establishment of new disjunct populations by long -distance migrants depends on a combination of suitable environmental and biological conditions in their new locations. Founder populations will also usually be small, which can lead to Allee effects. These result from (a) genetic inbreeding and loss of heterozygosity; (b) demographic stochasticity (including sex -ratio fluctuations); and (c) a reduction in cooperative interactions when individuals are at low density (Courchamp, Clutton -Brock, & Grenfell, 1999). As a fig is often colonized by a single fig wasp and given that their offspring mate in their natal fig before dispersal, inbreeding
among fig wasps is routine (Molbo, Machado, Herre, & Keller, 2004), and consequently, we expect founder populations of fig wasps to be little affected by inbreeding. Furthermore, although offspring sex ratios are heavily female -biased, foundress females typically begin by laying male eggs in a clutch, so female offspring rarely have difficulty finding mates (Raja, Suleman, Compton, & Moore, 2008). Finally, foundress females compete within figs for oviposition sites, so no cooperation between them is expected (Herre, 1989). Consequently, pollinating fig wasps are probably not sensitive to Allee effects and they should be much less dependent on progressive geographic range expansion than many other organisms. Within this context, the parapatric distributions of many pollinating fig wasps suggest an important role for interspecific competition in shaping their distributions, as has been proposed for nonpollinating fig wasps (Darwell & Cook, 2017).
4.3 Diversification in plant–insect mutualisms
The total of nine pollinator species found on F. hirta represents the highest ever -reported number of pollinator species for a Ficus species. Almost as high pollinator diversity has been documented for some other Ficus species (five for F. rubiginosa, Darwell et al., 2014; five for F. racemosa, Bain et al., 2016; four for F. septica, Rodriguez et al., 2017). This is strikingly different from the comprehensively known Yucca moth–Yucca association, where from a total of 24 pollinating moth species (Pellmyr, Balcázar -Lara, Segraves, Althoff, & Littlefield, 2008) there are only five instances of two copollinators sharing on a host (Smith, Drummond, Godsoe, Yoder, & Pellmyr., 2009). Available data on the less comprehensively investigated Epicephala– Phyllantheae association suggest an intermediate situation with up to four pollinator species associated with one host (Li et al., 2015). The comparatively low pollinator diversity observed in Yucca moths could be related to several factors. First, Yuccas have much more restricted distribution ranges than Ficus species, with only the distribution ranges of the two most northern Yucca species reaching 2,000 km (Althoff, Segraves, Smith, Leebens -Mack, & Pellmyr, 2012). Second, Yucca moths can exhibit prolonged diapause, a factor that will slow down the dynamics of population divergence (Powel, 1992). Third, assortative mating is not systematic, unlike in fig wasps (Powel, 1992).
In addition to their contrasting rates of differentiation, the population genetics of F. hirta and its pollinators are strikingly different. Whereas F. hirta exhibits clinal genetic variation with a signature of genetic isolation by distance, its pollinator species sp1 and sp2 lack any such signature. The same pattern has been observed for F. pumila L. and one of its pollinating wasps in southeast China (Liu et al., 2015). Hence, although pollinating fig wasps diversify faster than their host figs, they also display signatures of stronger gene flow. This apparent contradiction suggests that factors which facilitate speciation, such as a short generation time, infection by Wolbachia and assortative mating, can compensate for extensive gene flow and be decisive factors facilitating pollinating fig wasp speciation. Some nonpollinating fig wasps (NPFW, belonging to several families of Chalcidoidea) may disperse as widely as pollinator fig wasps (Kjellberg & Proffit, 2016; Sutton et al., 2016). NPFW have a largely similar biology to the pollinators, but exhibit varying intensities of local mate competition due to varying patterns of oviposition and mating sites. Obligatory assortative mating among NPFW ranges from minimal (among species that mate outside natal figs), through intermediate (NPFW with offspring dispersed across numerous figs that mate in the cavity of their natal figs) to being highly similar to that of pollinating wasps (with offspring aggregated in a single or small number of figs and mating inside these natal figs; Cook & Rasplus, 2003). If assortative mating indeed facilitates speciation, then we would expect a correlation between NPFW reproductive behaviour and speciation rates in different NPFW clades.
The mismatch between genetic structuring of host plant and fig wasps shows that, as in Yucca moths (Godsoe, Yoder, Smith, Drummond, & Pellmyr, 2010) and Epicephala moths (Hembry et al., 2018), fine population -level phenotypic matching between mutualists is not required to
allow population persistence. Nevertheless, on Hainan Island, the populations of F. hirta and its pollinator present the same signature of marked genetic differentiation from continental
populations. Hence, the mismatch in population genetic structure is not consistent over the whole range of the association. Such differences in genetic costructuring are also encountered among associations in other species -specific plant–insect interactions. For instance, in a specialized association between two ants and an ant plant, with populations arranged as stepping stones, the ants and the plant presented very similar genetic signatures of population geographic expansion (Léotard et al., 2009). In a similar association showing a history of restriction to refugia followed by expansion leading to more continuous populations, the plants and insects had the same pattern of genetic geographic structuring, but different histories (Blatrix et al., 2017). The latter study also showed that the trees had evolved stronger reproductive isolation than their ant symbionts. Hence, available case studies suggest that patterns of diversification in plant–insect mutualistic interactions are not uniform among representatives of the same type of interaction. As more case studies become available,
exploring how variation is explained by the biology of individual species is the next challenge.
4.4 Relationships between tree characteristics and diversity of pollinators
Pollinator diversity has now been explored throughout large parts of the distribution ranges of four widely distributed Asian and Australasian Ficus species (F. hirta, F. septica, F. racemosa and F. rubiginosa; Bain et al., 2016; Darwell et al., 2014; Rodriguez et al., 2017). Their pollinator fig wasps each form old monophyletic species complexes (dating back >10 Ma) associated with a single host (Bain et al., 2016; Cruaud et al., 2012), but the species groups display varying geographic scales of pollinator species diversification. The host figs also display varying scales of genetic differentiation. Further studies are required to investigate whether plant traits such as crop size, crop synchrony and growth form may combine to select for different pollinator dispersal behaviour and may result in pollinator and fig genetic diversity being expressed at different geographic scales.
ACKNOWLEDGEMENTS
We thank Prof. Xia Nianhe, Peng Yanqiong, Vu Quang Nam (Vietnam National Foundation for Science and Technology Development under grant numbers 106.11 -2012.82), Tien Tran, Nong Van Duy, Zhang Xianchun (collecting permission number in Indonesia: No.
1799IPH.1.02/KS.01/XI/2014), Harry Wiriadinata, Arief Hidayat, Wei Ran, Chen Wenli, Mashhor Mansor, Nora Sikin, Serena Lee (provided Singapore samples), Khin Me Aung, Chuck Cannon, Thitima Tharawoot and Liang Dan for sample collection and help in the field. We thank Mei Qiming, Liu Qing, Kong Hanghui and Tu Tieyao for their help with cluster computers. We also thank Liu Yunxiao for her help with figures. We thank Simon Segar, Tatiana Giraud and the anonymous reviewers for helpful comments on the manuscript. This work was supported by the National Natural Science Foundation of China (31670395;
31630008; 31370409), the Guangzhou Science and Technology Plan Project (201707010351), the External Cooperation Program of Bureau of International Co -operation Chinese Academy of Sciences (No. GJHZ201321) and the CAS President's International Fellowship Initiative (2017VBA0039).
CONFLICT OF INTEREST
The authors declared that they have no competing interests.
AUTHOR CONTRIBUTIONS
Y.H. designed research, collected samples, analysed data and cowrote the manuscript. S.G.C. cowrote the manuscript. F.K. contributed to data analyses and cowrote the manuscript. E.W.T. and Z.L.N. collected samples, performed laboratory work and analysed data. D.X.X. and Y.F.C.
performed laboratory work. D.Y.Z. designed research. C.L.F. and W.W. analysed data. W.T. collected samples in Thailand. All authors contributed substantially to revisions.
DATA ACCESSIBILITY
Microsatellite genotype data, final assembly mtDNA sequences for all individuals, ITS2 nrDNA sequences for each species and each haplotypes of Valasia javana, and microsatellite genotype data and final assembly cpDNA sequences for all individuals of Ficus hirta are archived in the Dryad Digital Repository at http://datad ryad.org,
https://doi.org/10.5061/dryad.k7t33tg. ORCID
Hui Yu https://orcid.org/0000 -0003 -0074 -9153
REFERENCES
Ahmed, S., Compton, S. G., Butlin, R. K., & Gilmartin, P. M. (2009). Windborne insects mediate directional pollen transfer between desert fig trees 160 kilometers apart. Proceedings of the National Academy of Sciences of the United States of America, 106, 20342–20347. https :// doi.org/10.1073/pnas.09022 13106
Althoff, D. M., Segraves, K. A., Smith, C. I., Leebens -Mack, J., & Pellmyr, O. (2012). Geographic isolation trumps coevolution as a driver of yucca and yucca moth diversification. Molecular Phylogenetics and Evolution, 62, 898–906. https
://doi.org/10.1016/j.ympev.2011.11.024
Anstett, M. C., Hossaert -McKey, M., & Kjellberg, F. (1997). Figs and fig pollinators:
Evolutionary conflicts in a coevolved mutualism. Trends in Ecology and Evolution, 12, 94–99. Bain, A., Borges, R. M., Chevallier, M. H., Vignes, H., Kobmoo, N., Peng, Y. Q., … Hossaert -Mckey, M. (2016). Geographic structuring into vicariant species -pairs in a wide -ranging, high -dispersal plant -insect mutualism: The case of Ficus racemosa and its pollinating wasps. Evolutionary Ecology, 30, 663–684. https ://doi.org/10.1007/ s10682 -016 -9836 -5
Belkhir, K., Borsa, P., Chikhi, L., Raufaste, N., & Bonhomme, F. (1996– 2004). GENETIX 4.05, logiciel sous Windows TM pour la génétique des populations. Laboratoire Génome, Populations, Interactions, CNRS UMR 5000, Université de Montpellier II, Montpellier (France). http:// kimura.univ -montp2.fr/genet ix/
Berg, C. C. (2003). Flora Malesiana precursor for the treatment of Moraceae 3: Ficus subgenus Ficus. Blumea, 48, 529–550. https ://doi. org/10.3767/00065 1903X 489537
Berg, C. C. (2007). Precursory taxonomic studies on Ficus (Moraceae) for the Flora of Thailand. Thai Forest Bulletin (Botany), 35, 4–28.
Berg, C. C., & Corner, E. J. H. (2005). Moraceae (Ficus). In H. P. Nooteboom (Ed.), Flora Malesiana (pp. 1–730). Leiden, the Netherlands: National Herbarium Nederland.
Blatrix, R., Peccoud, J., Born, C., Piatscheck, F., Benoit, L., Sauve, M., … McKey, D. (2017). Comparative analysis of spatial genetic structure in an ant–plant symbiosis reveals a tension zone and highlights speciation processes in tropical Africa. Journal of Biogeography, 44, 1856– 1868. https ://doi.org/10.1111/jbi.12972
Bouckaert, R., Heled, J., Kühnert, D., Vaughan, T., Wu, C. -H., Xie, D., … Drummond, A. J. (2014). BEAST 2: A software platform for Bayesian evolutionary analysis. PLoS
Computational Biology, 10, e1003537. https ://doi.org/10.1371/journ al.pcbi.1003537
Bruun -Lund, S., Verstraete, B., Kjellberg, F., & Rønsted, N. (2018). Rush hour at the Museum – Diversification patterns provide new clues for the success of figs (Ficus L., Moraceae). Acta Oecologica, 90, 4–11. https ://doi.org/10.1016/j.actao.2017.11.001
Chen, Y., Compton, S. G., Liu, M., & Chen, X. Y. (2012). Fig trees at the northern limit of their range: The distributions of cryptic pollinators indicate multiple glacial refugia. Molecular Ecology, 21, 1687–1701. https ://doi.org/10.1111/j.1365 -294X.2012.05491.x
Chen, Y., Zhu, X. J., Compton, S. G., Liu, M., & Chen, X. Y. (2011). Genetic diversity and differentiation of the extremely dwarf Ficus tikoua in
Southwestern China. Biochemical Systematics and Ecology, 39, 441– 444. https ://doi.org/10.1016/j.bse.2011.06.006
Clement, M., Posada, D., & Crandall, K. A. (2000). TCS: A computer program to estimate gene genealogies. Molecular Ecology, 9, 1657–1659. https ://doi.org/10.1046/j.1365
-294x.2000.01020.x
Conchou, L., Cabioch, L., Rodriguez, L. J. V., & Kjellberg, F. (2014). Daily rhythm of mutualistic pollinator activity and scent emission in Ficus septica: Ecological differentiation between co -occurring pollinators and potential consequences for chemical communication and facilitation of host speciation. PLoS ONE, 9, e103581. https ://doi. org/10.1371/journ
al.pone.0103581
Cook, J. M., & Rasplus, J. Y. (2003). Mutualists with attitude: Coevolving fig wasps and figs. Trends in Ecology and Evolution, 18, 241–248. https ://doi.org/10.1016/S0169 -5347(03)00062 -4
Cook, J. M., & Segar, S. T. (2010). Speciation in fig wasps.
Ecological Entomology, 35(Suppl. 1), 54–66. https ://doi. org/10.1111/j.1365 -2311.2009.01148.x
Corlett, R. T. (2006). Figs (Ficus, Moraceae) in Urban Hong Kong, South China. Biotropica, 38, 116–121.
Cornille, A., Underhill, J. G., Cruaud, A., Hossaert -McKey, M., Johnson, S. D., Tolley, K. A., … Proffit, M. (2012). Floral volatiles, pollinator sharing and diversification in the fig -wasp mutualism: insights from Ficus natalensis, and its two wasp pollinators (South Africa). Proceedings of the Royal Society of London Series B -Biological Sciences, 279, 1731– 1739. https ://doi.org/10.1098/rspb.2011.1972
Courchamp, F., Clutton -Brock, T., & Grenfell, B. (1999). Inverse density dependence and the Allee effect. Trends in Ecology and Evolution, 14, 405–410. https ://doi.org/10.1016/S0169 -5347(99)01683 -3
Craft, K. J., Pauls, S. U., Darrow, K., Miller, S. E., Hebert, P. D. N., Helgen, L. E., … Weiblen, G. D. (2010). Population genetics of ecological communities with DNA barcodes: An example from New Guinea Lepidoptera. Proceedings of the National Academy of Sciences, 107, 5041– 5046. https ://doi.org/10.1073/pnas.09130 84107
Crandall, K. A., & Templeton, A. R. (1993). Empirical tests of some predictions from coalescent theory with applications to intraspecific phylogeny reconstruction. Genetics, 134, 959–969.
Cruaud, A., Jabbour -Zahab, R., Genson, G., Cruaud, C., Couloux, A., Kjellberg, F., & Rasplus, J. Y. (2010). Laying the foundations for a new classification of Agaonidae (Hymenoptera: Chalcidoidea), a multilocus phylogenetic approach. Cladistics, 26, 359–387.
Cruaud, A., Rønsted, N., Chantarasuwan, B., Chou, L. S., Clement, W. L., Couloux, A., … Savolainen, V. (2012). An extreme case of plant–insect codiversification: Figs and fig -pollinating wasps. Systematic Biology,
61, 1029–1047. https ://doi.org/10.1093/sysbi o/sys068
Darwell, C. T., al -Beidh, S., & Cook, J. M. (2014). Molecular species delimitation of a symbiotic fig -pollinating wasp species complex reveals extreme deviation from reciprocal partner specificity. BMC Evolutionary Biology, 14, 189. https ://doi.org/10.1186/s12862 014 -0189 -9
Darwell, C. T., & Cook, J. M. (2017). Cryptic diversity in a fig wasp community—
Morphologically differentiated species are sympatric but cryptic species exhibit competitive exclusion. Molecular Ecology, 26, 937–950.
Dufaÿ, M., & Anstett, M. C. (2003). Conflicts between plants and pollinators that reproduce within inflorescences: Evolutionary variations on a theme. Oikos, 100, 3–14. https ://doi. org/10.1034/j.1600 -0706.2003.12053.x
Edgar, R. C. (2004). MUSCLE: Multiple sequence alignment with high accuracy and high throughput. Nucleic Acids Research, 32, 1792–1797. https ://doi.org/10.1093/nar/gkh340 Excoffier, L., Laval, G., & Schneider, S. (2005). Arlequin ver. 3.0: An integrated software package for population genetics data analysis. Evolutionary Bioinformatics, 1, 47–50. Fu, Y. X., & Li, W. H. (1993). Statistical tests of neutrality of mutations. Genetics, 133, 693– 709.
Godsoe, W., Yoder, J. B., Smith, C. I., Drummond, C. S., & Pellmyr, O. (2010). Absence of population -level phenotype matching in an obligate pollination mutualism. Journal of Evolutionary Biology, 23, 2739– 2746. https ://doi.org/10.1111/j.1420 -9101.2010.02120.x Haine, E. R., & Cook, J. M. (2005). Convergent incidences of Wolbachia infection in fig wasp communities from two continents. Proceedings of the Royal Society of London Series B -Biological Sciences, 272, 421–429.
Hembry, D. H., & Althoff, D. M. (2016). Diversification and coevolution in brood pollination mutualisms: Windows into the role of biotic interactions in generating biological diversity. American Journal of Botany, 103, 1783–1792. https ://doi.org/10.3732/ajb.1600056
Hembry, D. H., Raimundo, R. L. G., Newman, E. A., Atkinson, L., Guo, C., Guimarães, P. R. Jr, & Gillespie, R. G. (2018). Does biological intimacy shape ecological network structure - A test using a brood pollination mutualism on continental and oceanic islands. Journal of Animal Ecology, 87, 1160–1171. https ://doi.org/10.1111/1365 -2656.12841
Herre, E. A. (1989). Coevolution and reproductive characteristics in 12 species of New World figs and their pollinator wasps. Experientia, 45, 637–647.
Jia, X. C., Dan, Y., Zhang, Y., & Chen, Y. Z. (2007). Direct evidence for the cycling of fig wasps within one male fig tree. Nordic Journal of Botany, 25, 119–124. https
://doi.org/10.1111/j.0107 -055X.2007.00021_23.x Jones, M., Ghoorah, A., & Blaxter, M. (2011). jMOTU and taxonerator: Turning DNA barcode sequences into annotated operational taxonomic units. PLoS ONE, 6, e19259. https ://doi.org/10.1371/journ al.pone.0019259 Jousselin, E., van Noort, S., Berry, V., Rasplus, J. Y., Rønsted, N., Erasmus, J. C., & Greeff, J. M. (2008). One fig to bind them all: Host conservatism in a fig wasp community unravelled by cospeciation analyses among pollinating and nonpollinating fig wasps. Evolution, 62, 1777– 1797.
Kass, R. E., & Raftery, A. E. (1995). Bayes factors. Journal of American
Statistical Association, 90, 773–795. https ://doi.org/10.1080/01621 459.1995.10476572 Kawakita, A. (2010). Evolution of obligate pollination mutualism in the tribe Phyllantheae (Phyllanthaceae). Plant Species Biology, 25, 3–19. https ://doi.org/10.1111/j.1442
-1984.2009.00266.x
Kjellberg, F., & Proffit, M. (2016). Tracking the elusive history of diversification in plant– herbivorous insect–parasitoid food webs: Insights from figs and fig wasps. Molecular Ecology, 25, 843–845. https ://doi. org/10.1111/mec.13533
Kobmoo, N., Hossaert -McKey, M., Rasplus, J. Y., & Kjellberg, F. (2010).
Ficus racemosa is pollinated by a single population of a single agaonid wasp species in continental South -East Asia. Molecular Ecology, 19, 2700–2712. https
://doi.org/10.1111/j.1365 -294X.2010.04654.x
Lawton, J., Lewinsohn, T., & Compton, S. (1993). Patterns of diversity for the insect herbivores on bracken. In R. E. Ricklefs, & D. Schluter (Eds.), Species diversity in ecological
communities: Historical and geographical perspectives (pp. 178–184). Chicago, IL: University of Chicago Press.
Leather, S. R. (1986). Insect species richness of the British Rosaceae: The importance of host range, plant architecture, age of establishment, taxonomic isolation and species -area
relationships. Journal of Animal Ecology, 55, 841–860. https ://doi.org/10.2307/4420 Léotard, G., Debout, G., Dalecky, A., Guillot, S., Gaume, L., McKey, D., & Kjellberg, F. (2009). Range expansion drives dispersal evolution in an Equatorial three -species symbiosis. PLoS ONE, 4, e5377.
Lewinsohn, T. M., & Roslin, T. (2008). Four ways towards tropical herbivore megadiversity. Ecology Letters, 11, 398–416. https ://doi. org/10.1111/j.1461 -0248.2008.01155.x
Li, H., Wang, Z., & Hu, B. (2015). Four new species of Epicephala Meyrick, 1880
(Lepidoptera, Gracillariidae) associated with two species of Glochidion (Phyllanthaceae) from Hainan Island in China. ZooKeys, 508, 53–67. https ://doi.org/10.3897/zookey s.508.9479 Librado, P., & Rozas, J. (2009). DnaSP v5: A software for comprehensive analysis of DNA polymorphism data. Bioinformatics, 25, 451–1452. https ://doi.org/10.1093/bioin forma tics/btp187
Lin, R. C., Yeung, C. K. L., Fong, J. J., Tzeng, H. Y., & Li, S. H. (2011). The lack of pollinator specificity in a dioecious fig tree: Sympatric figpollinating wasps of Ficus septica in southern Taiwan. Biotropica, 43, 200–207. https ://doi.org/10.1111/j.1744 -7429.2010.00686.x
Lin, R. C., Yeung, C. K., & Li, S. H. (2008). Fig trees at the northern limit of their range: The distributions of cryptic pollinators indicate multiple glacial refugia. Molecular Ecology, 21, 1687–1701.
Liu, M., Compton, S. G., Peng, F. E., Zhang, J., & Chen, X. Y. (2015). Movements of genes between populations: Are pollinators more effective at transferring their own or plant genetic markers - Proceedings of the Royal Society of London Series B -Biological Sciences, 282, 20150290.
Lopez -Vaamonde, C., Rasplus, J. Y., Weiblen, G. D., & Cook, J. M. (2001). Molecular phylogenies of fig wasps: Partial cocladogenesis of pollinators and parasites. Molecular Phylogenetics and Evolution, 21, 55–
71. https ://doi.org/10.1006/mpev.2001.0993
Machado, C. A., Robbins, N., Gilbert, M. T. P., & Herre, E. A. (2005). Critical review of host specificity and its coevolutionary implications in the fig fig -wasp mutualism. Proceedings of the National Academy of Sciences of the United States of America, 102, 6558–6565. https ://doi. org/10.1073/pnas.05018 40102
Mittelbach, G. C., & Schemske, D. W. (2015). Ecological and evolutionary perspectives on community assembly. Trends in Ecology and Evolution, 30, 241–247. https
://doi.org/10.1016/j.tree.2015.02.008
Molbo, D., Machado, C. A., Herre, E. A., & Keller, L. (2004). Inbreeding and population structure in two pairs of cryptic fig wasp species. Molecular Ecology, 13, 1613–1623. https ://doi. org/10.1111/j.1365 -294X.2004.02158.x
Nenadi , O., & Greenacre, M. (2007). Correspondence analysis in R, with two and three -dimensional graphics: The ca package. Journal of Statistical Software, 20, 1–13.
Nicholls, J. A., Preuss, S., Hayward, A., Melika, G., Csóka, G., NievesAldrey, J. -L., … Stone, G. N. (2010). Concordant phylogeography
and cryptic speciation in two Western Palaearctic oak gall parasitoid species complexes. Molecular Ecology, 19, 592–609. https ://doi. org/10.1111/j.1365 -294X.2009.04499.x Novotny, V., Miller, S. E., Hulcr, J., Drew, R. A. I., Basset, Y., Janda, M., … Weiblen, G. D. (2007). Low beta diversity of herbivorous insects in tropical forests. Nature, 448, 692–695. https ://doi.org/10.1038/ natur e06021
Peakall, R., & Smouse, P. E. (2006). GENALEX 6: Genetic analysis in Excel. Population genetic software for teaching and research. Molecular Ecology Notes, 6, 288–295. https ://doi. org/10.1111/j.1471 -8286.2005.01155.x