HAL Id: hal-00304180
https://hal.archives-ouvertes.fr/hal-00304180
Submitted on 23 May 2008HAL is a multi-disciplinary open access
archive for the deposit and dissemination of sci-entific research documents, whether they are pub-lished or not. The documents may come from teaching and research institutions in France or abroad, or from public or private research centers.
L’archive ouverte pluridisciplinaire HAL, est destinée au dépôt et à la diffusion de documents scientifiques de niveau recherche, publiés ou non, émanant des établissements d’enseignement et de recherche français ou étrangers, des laboratoires publics ou privés.
Characteristics of trace gaseous pollutants at a regional
background station in Northern China
Z. Y. Meng, X. B. Xu, P. Yan, G. A. Ding, J. Tang, W. L. Lin, X. D. Xu, S.
F. Wang
To cite this version:
Z. Y. Meng, X. B. Xu, P. Yan, G. A. Ding, J. Tang, et al.. Characteristics of trace gaseous pollutants at a regional background station in Northern China. Atmospheric Chemistry and Physics Discussions, European Geosciences Union, 2008, 8 (3), pp.9405-9433. �hal-00304180�
ACPD
8, 9405–9433, 2008 Characteristics of trace gaese in Northern China Z. Y. Meng et al. Title Page Abstract Introduction Conclusions References Tables Figures ◭ ◮ ◭ ◮ Back CloseFull Screen / Esc
Printer-friendly Version
Interactive Discussion Atmos. Chem. Phys. Discuss., 8, 9405–9433, 2008
www.atmos-chem-phys-discuss.net/8/9405/2008/ © Author(s) 2008. This work is distributed under the Creative Commons Attribution 3.0 License.
Atmospheric Chemistry and Physics Discussions
Characteristics of trace gaseous
pollutants at a regional background
station in Northern China
Z. Y. Meng, X. B. Xu, P. Yan, G. A. Ding, J. Tang, W. L. Lin, X. D. Xu, and S. F. Wang
Key Laboratory for Atmospheric Chemistry, Center for Atmosphere Watch and Services, Chinese Academy of Meteorological Sciences, Beijing 100081, China
Received: 22 February 2008 – Accepted: 15 April 2008 – Published: 23 May 2008 Correspondence to: Z. Y. Meng (mengzy@cams.cma.gov.cn)
ACPD
8, 9405–9433, 2008 Characteristics of trace gaese in Northern China Z. Y. Meng et al. Title Page Abstract Introduction Conclusions References Tables Figures ◭ ◮ ◭ ◮ Back CloseFull Screen / Esc
Printer-friendly Version
Interactive Discussion Abstract
We present measurement results of trace gaseous pollutants obtained at the Shang-dianzi (SDZ) Global Atmosphere Watch (GAW) regional station in Northern China, from September 2003 to December 2006. The gases include ozone (O3), nitrogen oxide(s) (NOx=NO+NO2), sulfur dioxide (SO2), and carbon monoxide (CO). During
5
the study period, the mean annual O3 concentrations were 30.1±21.0, 32.8±19.1 and 30.9±19.8 ppbv in 2004, 2005 and 2006. The corresponding NOx values were 14.5±14.0, 11.0±11.3 and 12.7±11.8 ppbv, respectively. The mean annual SO2 con-centrations were 5.9±10.0, 6.1±9.9 and 7.6±10.2 ppbv in 2004, 2005 and 2006, while the mean CO levels were 586±415 and 742±558 ppbv in 2005 and 2006. The data
10
obtained at SDZ station are compared with the results measured at other background sites in China as well as abroad. The concentrations of O3, NOx, SO2, and CO at the SDZ background station are found to have clear seasonal and diurnal variations. The impacts of local and remote pollution sources on the regional air quality are assessed using trace gases concentration roses and 3-day back trajectories of air masses
arriv-15
ing at the SDZ station.
1 Introduction
Human activities have been shown to have major impacts on the global environment. Anthropogenic emissions of gaseous and particulate matter can alter the energy bal-ance of the atmosphere, and consequently affect interactions between the atmosphere,
20
hydrosphere, and biosphere. Observation of the changes in background atmospheric composition is an essential way to understand the influence of human activities on the atmospheric environment and global change (Fischer et al., 2003; Jaffe et al., 2003; Jaffe and Ray, 2007; Meng et al., 2007; Tang et al., 2007; Yan et al., 2008). Inten-sive studies have been carried out in the Yangtze Delta and Pearl River Delta, China
25
ACPD
8, 9405–9433, 2008 Characteristics of trace gaese in Northern China Z. Y. Meng et al. Title Page Abstract Introduction Conclusions References Tables Figures ◭ ◮ ◭ ◮ Back CloseFull Screen / Esc
Printer-friendly Version
Interactive Discussion activities on the regional air quality.
Large increases in anthropogenic emissions of the photochemical precursors, NOx in particular, have caused substantial increases in the global background O3 mixing ratios over the past century (Jaffe et al., 2003; Marenco et al., 1994). Acid rain has al-ready been recognized as a regional-scale environment problem in China, and SO2is
5
the most important precursor (Wang and Wang, 1995; Wang et al., 2001a; Zhao et al., 1988). CO has an effect on the oxidization of the atmosphere through interaction with hydroxyl radical (OH), which also reacts with methane, halocarbons and tropospheric ozone. The studies of these major gaseous pollutants in Northern China have received intensive attentions (Ding et al., 2002; Hao et al., 2005; Ma et al., 2004, 2006; Meng et
10
al., 2002, 2008; Wang et al., 2006; Xie et al., 2005; Xu et al., 2005). So far, field mea-surements of key air pollutants in rural locations in Northern China are comparatively spare. The primary objectives of our study are to characterize the levels and variations of trace gases in the background area of Northern China, and to analyze the sources and factors affecting these trace gases concentrations. The data of this study are also
15
compared with the results measured at other sites in China as well as abroad.
2 Description of experiment
2.1 Measurement site and general weather conditions
The Shangdianzi station (SDZ, 40◦39′N, 117◦07′E, 293.3 m above sea level) is located in the northeast of Beijing, with a distance about 150 km. Beijing is located on the
20
northern edge of the North China Plains, which is one of the most populated regions in China. Miyun, a town of Beijing with a population of 426 000, is 55 km southwest away from SDZ. There are only some small villages around SDZ with a low popula-tion density and thus very sparse anthropogenic emission sources. The study site is surrounded by fruit tree to the east and west, and with the cropland to the south. The
25
ACPD
8, 9405–9433, 2008 Characteristics of trace gaese in Northern China Z. Y. Meng et al. Title Page Abstract Introduction Conclusions References Tables Figures ◭ ◮ ◭ ◮ Back CloseFull Screen / Esc
Printer-friendly Version
Interactive Discussion is typical of the rural part in Northern China.
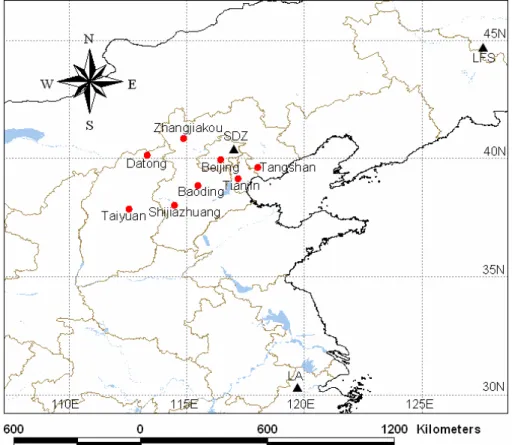
Figure 1 shows the location of the Shangdianzi (SDZ), Linan (LA) and Longfen-shan (LFS) regional background stations of China, as well as some cities in Northern China. The major sources of pollution at SDZ are located predominantly in the west to southeast of the site. The regions in the northern sector are much less inhabited,
5
comprised of the vast grassland of Inner Mongolia and mountainous rural regions of Hebei province, where the population is relatively sparse and the industrial activities are less prevalent.
Founded by China Meteorological Administration (CMA) in 1981, the SDZ station started operation with meteorological elements, PM10, atmospheric turbidity and
pre-10
cipitation chemistry observation in 1982. In 2002, the station developed more programs including trace gases, aerosols, precipitation, radiation and meteorology. The statistics of meteorological data for the period of 1971–2000 showed that the annual average temperature was 10.3◦, with annual precipitation 618.9 mm, annual mean wind speed 2.8 m s−1, prevail wind direction ENE, and annual sunshine duration 2733 h in the SDZ
15
station. Linan station (30.18◦N, 119.44◦E, 138.6 m a.s.l.) and Longfengshan station (44.73◦N, 127.60◦E, 310.0 m a.s.l.) are also regional background atmosphere moni-toring stations in China.
2.2 Instrumental method
At the study site, the instruments were housed in a temperature-controlled room with
20
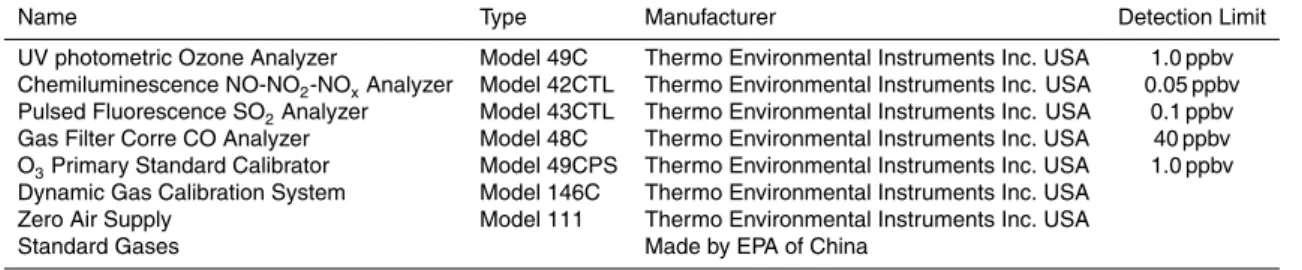
ambient air being drawn through the sampling tube. The sampling tube inlet was lo-cated 1.8 m above the rooftop of the room. Table 1 gives a list of the main instru-ments equipped at the SDZ station. O3was measured with a UV photometric analyzer (Thermo Environmental Instruments (TEI), Inc., model 49C). NO, NO2 and NOx were measured with a chemiluninescence analyzer (TEI, model 42CTL), and SO2was
mea-25
sured by using a pulsed UV fluorescence analyzer (TEI, model 43CTL) during Septem-ber 2003 to DecemSeptem-ber 2006. CO was measured with a gas filter correlation analyzer (TEI, model 48C) during the periods of September to October 2003 and May 2005 to
ACPD
8, 9405–9433, 2008 Characteristics of trace gaese in Northern China Z. Y. Meng et al. Title Page Abstract Introduction Conclusions References Tables Figures ◭ ◮ ◭ ◮ Back CloseFull Screen / Esc
Printer-friendly Version
Interactive Discussion December 2006. Zero point of O3, NO and SO2 instruments were calibrated
every-day by zero air generators. The CO analyzer was zeroed every 4 h. The multi-point calibrations were performed at approximately 3-month interval for all instruments using Zero Air Supply (TEI, model 111), standard gases, Dynamic Gas Calibration System (TEI model 146C), and O3Primary Standard Calibrator (TEI 49CPS). A computer was
5
used to control the above mentioned calibration and zeroing cycle. Five-minute aver-age data were stored in the data logger and hourly averaver-aged values are presented in this paper. Valid data were reduced by removing unreliable recordings due to accidents or instruments failure in the light of the operator’s recordings, and calibrated by zero point calibration recordings and multi-point calibration curve. Meteorological
parame-10
ters were also measured at the site, including wind, temperature, relative humidity, and etc.
3 Results and discussions
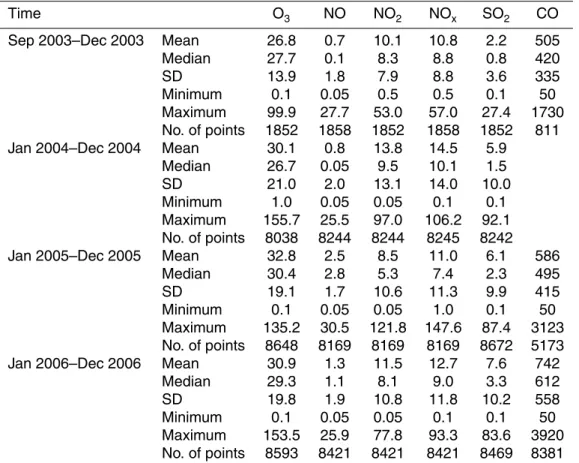
3.1 Overall results and comparisons with the measurements made at other sites The statistics of trace gases measured at the SDZ site are shown in Table 2.
Dur-15
ing September to December 2003, the average concentration in ppbv is 26.8±13.9 for O3, 0.7±1.8 for NO, 10.1±7.9 for NO2, 10.8±8.8 for NOx, 2.2±3.6 for SO2 and 505±335 for CO. The mean annual O3 mixing ratios are in the same level in 2004 (30.1±21.0 ppbv) and 2006 (30.9±19.8 ppbv). Higher concentration of O3 is found in 2005, with an annual average of 32.8±19.1 ppbv. The mean annual NO levels are
20
0.8±2.0 and 1.3±1.9 ppbv in 2004 and 2006, respectively, and show a increase to 2.5±1.7 ppbv in 2005. In contrast to NO, the mean annual NO2 concentrations are 13.8±13.1, 8.5±10.6 and 11.5±10.8 ppbv in 2004, 2005 and 2006, respectively, and exhibited a decreasing trend in 2005 and 2006. Similar to NO2, the mean NOx con-centrations are 14.5±14.0, 11.0±11.3 and 12.7±11.8 ppbv in 2004, 2005 and 2006,
25
ACPD
8, 9405–9433, 2008 Characteristics of trace gaese in Northern China Z. Y. Meng et al. Title Page Abstract Introduction Conclusions References Tables Figures ◭ ◮ ◭ ◮ Back CloseFull Screen / Esc
Printer-friendly Version
Interactive Discussion 6.1±9.9 and 7.6±10.2 ppbv in 2004, 2005 and 2006, respectively, showing an
increas-ing trend over the period from 2004 to 2006. The mean CO levels are 586±415 and 742±558 ppbv in 2005 and 2006, respectively.
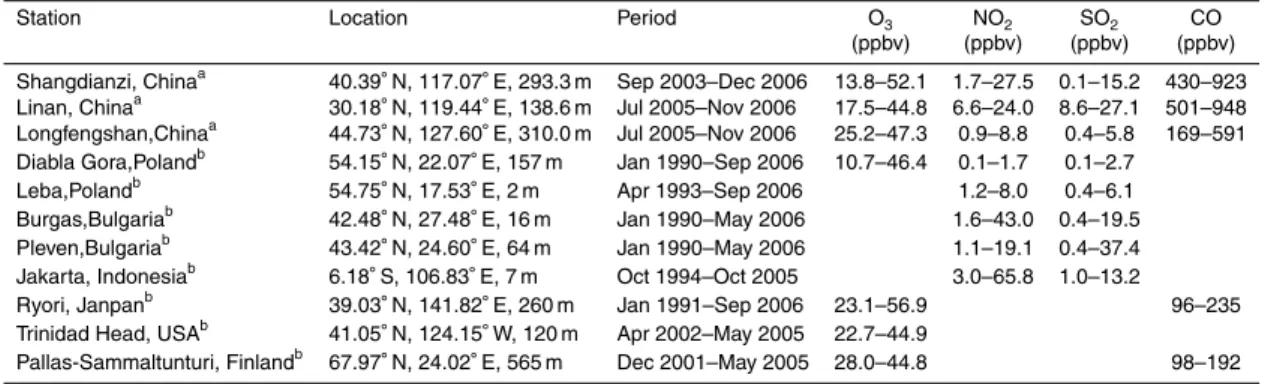
The data from the SDZ station are compared with the measurements made at other background sites in Table 3. The observation of trace gases in Linan and
Longfeng-5
shan stations has been conducted since July 2005. As presented in Table 3, the mean monthly O3 concentrations at SDZ are higher than those measured at Diabla Gora, Poland (10.7–46.4 ppbv), but lower than those measured at Ryori, Janpan (23.1– 56.9 ppbv). These concentrations are comparable to those measured at Linan, China (17.5–44.8 ppbv), Longfengshan, China (25.2–47.3 ppbv), Trinidad Head, USA (22.7–
10
44.9 ppbv) and Pallas-Sammaltunturi, Finland (28.0–44.8 ppbv).
The mean monthly NO2 concentrations at SDZ are higher than those measured at Longfengshan, China (0.9–8.8 ppbv), Diabla Gora, Poland (0.1–1.7 ppbv), Leba, Poland (1.2–8.0 ppbv) and Pleven, Bulgaria (1.1–19.1 ppbv), but lower than those mea-sured at Burgas, Bulgaria (1.6–43.0 ppbv) and Jakarta, Indonesia (3.0–65.8 ppbv).
15
These concentrations are comparable to those observed at Linan, China (6.6– 24.0 ppbv).
The monthly mean SO2 concentrations at SDZ are higher than those measured in Longfengshan, China (0.4–5.8 ppbv), Diabla Gora, Poland (0.1–2.7 ppbv), Leba, Poland (0.4–6.1 ppbv), but lower than those measured at Linan, China (8.6–27.1 ppbv),
20
Burgas, Bulgaria (0.4–19.5 ppbv) and Pleven, Bulgaria (0.4–37.4 ppbv). These concen-trations are comparable to those observed in Jakarta, Indonesia (1.0–13.2 ppbv).
The mean monthly CO concentrations at SDZ are higher than those measured at Longfengshan, China (169–591 ppbv), Ryori, Janpan (96–235 ppbv) and Pallas-Sammaltunturi, Finland (98–192 ppbv), but lower than those measured at Linan, China
25
(501–948 ppbv).
The Shangdianzi, Linan and Longfengshan stations are located in quite different regions in China (Fig. 1). The Shangdianzi station represents Northern China with de-veloped economics and high populations. The Linan station is situated on the southern
ACPD
8, 9405–9433, 2008 Characteristics of trace gaese in Northern China Z. Y. Meng et al. Title Page Abstract Introduction Conclusions References Tables Figures ◭ ◮ ◭ ◮ Back CloseFull Screen / Esc
Printer-friendly Version
Interactive Discussion edge of the Yangtze Delta Plain, which is a densely populated and fast developing
re-gion. Longfengshan is a remote site in China’s Northeast Plain, a sparsely populated and underdeveloped region. As primary pollutants, SO2, NOx and CO concentrations in Shangdianzi and Linan are higher than that in Longfengshan, reflecting the differ-ence in the regional pollution (Ma et al., 2002a, b).
5
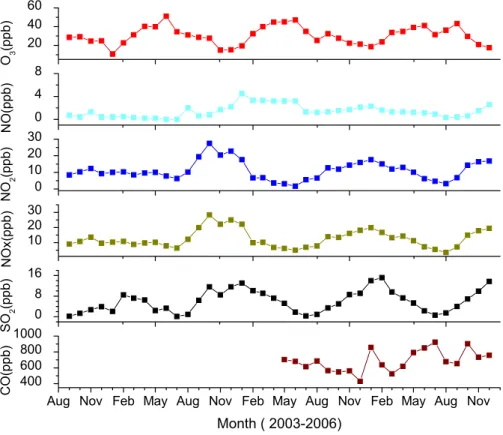
3.2 Monthly and seasonal variations
Monthly variations in gas concentrations measured from September 2003 to Decem-ber 2006 are showed in Fig. 2. Monthly mean O3concentrations show a peak in June (51.2 ppbv) 2004, and higher values in April (45.0 ppbv), May (45.1 ppbv) and June (47.1 ppbv) 2005, respectively. The variation in monthly mean O3 in 2006 is different
10
from that in 2004 and 2005, with an autumn maximum (43.2 ppbv in September 2006). This difference may be due to year to year alternation in the meteorological conditions (Wang et al., 2001b). There are relatively low monthly values of ozone in November 2004, December 2004, January 2006 and December 2006, with a minimal value in Jan-uary 2004 (10.7 ppbv). This seasonal pattern reflects the contribution of photochemical
15
generated O3from anthropogenic and natural precursors with sunshine. Lower O3 con-centrations were observed in July and August than in June. This is most likely due to the seasonal rain front that usually occurs over the measurement site between July and August.
The SDZ station is located at the rural area, with no heavy traffic and strong local
20
emission sources. As primary pollutant, NO concentrations are very low at the SDZ station, with the highest value of 4.5 ppbv in January 2004, and below the detection limit in June and July 2004. Monthly mean NO2concentrations range from 1.7 ppbv in July 2006 to 27.5 ppbv in October 2004. The lower NO2 concentration is likely due to the lower fuel combustion and greater photochemical reaction of NO2 in the summer
25
months compared to the other months (Jo et al., 2005). Monthly mean NOx concentra-tions range from 3.5 ppbv in August 2006 to 28.3 ppbv in October 2004. SO2monthly concentration has a maximal value of 15.2 ppbv in February 2006, and a minimal value
ACPD
8, 9405–9433, 2008 Characteristics of trace gaese in Northern China Z. Y. Meng et al. Title Page Abstract Introduction Conclusions References Tables Figures ◭ ◮ ◭ ◮ Back CloseFull Screen / Esc
Printer-friendly Version
Interactive Discussion of 0.1 ppbv in July 2004. NOx and SO2 concentrations are larger during the winter
months, gradually diminishing with the minimum concentrations found between June and August, and then increasing again until the winter months. The seasonal pattern of CO is different from those of NOxand SO2. Monthly mean CO concentrations range from 430 ppbv in December 2005 to 923 ppbv in July 2006. There is more biofule
com-5
bustion at SDZ during the summertime, thereby elevating the ambient air levels of CO in this rural area.
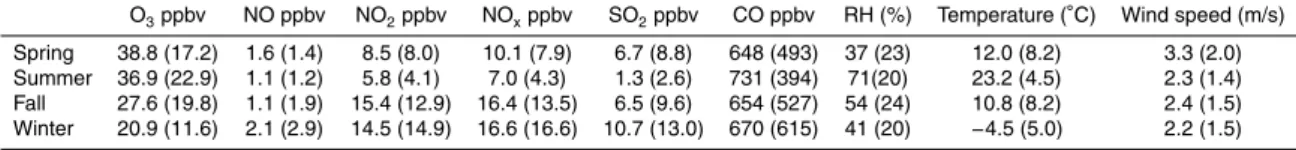
The seasonal variations of major gaseous pollutants for the entire observational pe-riod are presented in Table 4. We define the seasons as the three-month pepe-riods: spring (March–May), summer (June–August), fall (September–November) and winter
10
(December–February). It is found that the O3 concentration is higher in spring and summer and lower in fall and winter with the highest in spring (38.8 ppbv) and the low-est in winter (20.9 ppbv). NO have lower levels in spring, summer and fall than those in winter (2.1 ppbv). NO2and NOxexhibit the reverse seasonal variation to O3. NO2and NOx are elevated in fall and winter, with the highest values appearing in fall for NO2
15
(15.4 ppbv) and in winter for NOx (16.6 ppbv). The observed SO2 value is highest in winter (10.7 ppbv) and lowest in summer (1.3 ppbv). More heating fuels are typically consumed during the wintertime, thereby elevating ambient air levels of SO2. More-over, the wind speed is lowest (2.2 m/s), and other meteorological parameters, such as temperature, is also lowest (−4.5◦), implying poorer mixing during the wintertime
20
(Table 4). CO concentrations are higher both in summer and winter. In summer, crop residue burning after the harvest in this region may contribute significantly to higher CO at the location. The combination of increased biomass combustion emissions and transport leads to the higher concentrations of CO at the site.
In general, the following factors could affect the concentrations of gaseous pollutants
25
during both the summer and winter: dilution, due to the increased mixing depth found in summer; more rainy days in the summer, causing the trace gases to be washed out in the atmosphere; and physical dispersion/transport, which could be the reason for higher concentrations of NOx, SO2and CO in winter. When the prevailing winds at SDZ
ACPD
8, 9405–9433, 2008 Characteristics of trace gaese in Northern China Z. Y. Meng et al. Title Page Abstract Introduction Conclusions References Tables Figures ◭ ◮ ◭ ◮ Back CloseFull Screen / Esc
Printer-friendly Version
Interactive Discussion are southwesterly, especially during wintertime, the transportation of pollutants from
Beijing and related area could be contributing to the levels observed at the background site.
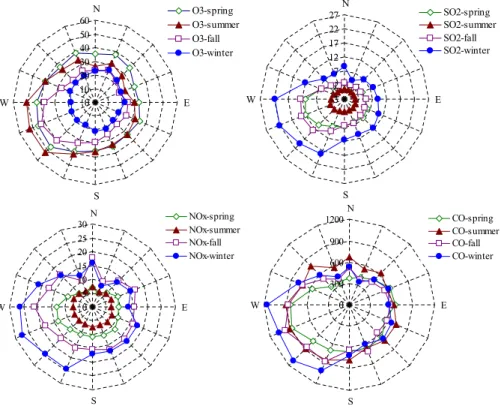
Figure 3 shows trace gaseous pollutant roses in different seasons during the study period, which give certain insight into the distribution of local emission sources around
5
the monitoring site. As shown by the O3rose in Fig. 3, in spring, summer and fall, O3 concentrations in SW-WSW-W sectors are higher with the maximum value of 51.9 ppbv in WSW, while the lowest one is in ENE sector. In winter, the highest O3 (25.9 ppbv) appears in NNE-sector, and in spring, O3 has also higher concentrations in NNW-N-NNE sectors. In spring the prevailing winds are northerly, relative humidity drops to 37
10
%, and the wind speed is highest (Table 4), indicating downward transports of rich O3 air masses from the free troposphere.
The SO2 rose has a different situation. Figure 3 indicates that SO2 concentrations are low in all sectors in summer, while in winter the SO2values are high in all sectors especially in SSW-WSW-WNW sectors with highest value of 22.1 ppbv in WSW. In fall,
15
SO2 concentrations in SW-WSW-W sectors are higher than those in spring, and the concentrations are similar with that in other sectors in spring. Similar to SO2, the NOx values were highest in SSW-WSW-WNW sectors in winter, while NOx concentrations in fall in N-E-SSE sectors are comparable to those in winter. The higher levels of SO2 and NOx in SSW-SW-WSW-W sectors at SDZ may be attributed to the transport from
20
the town of Miyun town and the urban area of Beijing Metropolis in its upper reaches. Sources of atmospheric CO include fossil fuel combustion and biomass burning along with the oxidization of both natural and anthropogenic methane and non-methane hydrocarbons (NHHC). CO could be used as a tracer of anthropogenic pollution. CO has higher concentrations in SSW-SW-WSW-W sectors for all the seasons. In summer,
25
ACPD
8, 9405–9433, 2008 Characteristics of trace gaese in Northern China Z. Y. Meng et al. Title Page Abstract Introduction Conclusions References Tables Figures ◭ ◮ ◭ ◮ Back CloseFull Screen / Esc
Printer-friendly Version
Interactive Discussion 3.3 Diurnal variations
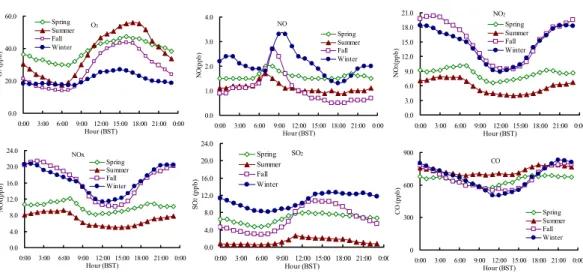
Diurnal variation of atmospheric species gives insight into the interplay of emission and chemical and physical processes operating on a diurnal cycle (Ma et al., 2002b). Ac-cordingly, the current study analyzes the diurnal variations of the six target compounds during the four different seasons over the 3-year study period. As shown in Fig. 4, the
5
diurnal O3 patterns are similar for all four seasons. Minimum values of O3 appeared in the early morning 06:00–08:00 BST (Beijing Standard Time), and the increases in ozone concentrations were then observed. The highest levels occurred approximately at 15:00–17:00 BST. Thereafter, ozone concentrations decreased steadily. This diur-nal pattern is similar to that found in several rural sites in China and Spain (Garc´ıa
10
et al., 2005; Wang et al., 2001b, 2003b). An increase in ozone levels during the day is attributed to photochemical processes of ozone production in the mixing layer and transport from the upwind site and layer, both favored by solar radiation, and a de-crease at night is due to in situ destruction of ozone by deposition and/or the reaction between O3 and NO (Duen ˜as et al., 2002). It can be found that the daily amplitude
15
of surface ozone is highest in summer and lowest in winter. Meanwhile, the maximum hourly mean concentration was observed in the summer (56.0 ppbv, 17:00 BST), and the minimum in the fall (14.0 ppbv, 06:00 BST).
After sunrise the NO concentration quickly increases to its peak value at 07:00– 10:00 BST and then started to decrease. Lower levels appear at night due to the
20
titration of NO by ozone and cessation of photolysis of NO2after sunset. The NO con-centration is higher in winter (3.3 ppbv, 09:00 BST) than in fall (2.7 ppbv, 08:00 BST), spring (2.0 ppbv, 08:00 BST) and summer (1.7 ppbv, 07:00 BST).
It is noted in Fig. 4 that NO2 concentrations are higher in the early morning and evening and lower at 11:00–15:00 BST in fall and winter. In spring and summer, NO2
25
exhibit a gradual increase and reached a peak concentration round 06:00–07:00 BST. The concentrations then fall to a shallow trough before increasing once more to give a second peak concentration around 19:00. The daily amplitudes of NO2 are higher in
ACPD
8, 9405–9433, 2008 Characteristics of trace gaese in Northern China Z. Y. Meng et al. Title Page Abstract Introduction Conclusions References Tables Figures ◭ ◮ ◭ ◮ Back CloseFull Screen / Esc
Printer-friendly Version
Interactive Discussion fall and winter than in spring and summer. NO2 concentrations decrease during
day-time, owing to an enhanced dilution of the convective boundary layer. The maximum concentration (20.3 ppbv) and the minimum concentration (9.4 ppbv) of NO2in the fall are similar to that in the winter, but higher than that in spring and summer.
Similar to NO2, the maximum concentration of NOx(21.4 ppbv) in the fall is similar to
5
that in the winter (20.7 ppbv), and the minimum concentration in the winter (11.3 ppbv) is higher than that in the fall (10.1 ppbv), spring (8.2 ppbv) and summer (5.0 ppbv).
The diurnal patterns of SO2 are different from those of NOx, and have the same trend for all the seasons. SO2 appear to be minimum in the early morning 06:00– 07:00 BST, increase gradually to the highest approximately at 14:00–18:00 BST, and
10
then decrease steadily in all the seasons except winter. The concentrations remain almost steady from 18:00 to 24:00 BST in winter, which are believed to be due to a higher energy demand for heating. The local higher values of SO2 in the afternoon correspond with local emissions from human activities surrounding the site. Meanwhile, this increase is registered during the hours of maximal boundary layer depth, and thus
15
the sources of local and long-range transport must be significant as air pollutants are well mixed in the afternoon.
In contrast to SO2, in the summer season, the diurnal patterns of CO do not show any significant variability except a small evening peak, with a mean value in the range of 688–788 ppbv. The increased biomass combustion emissions have a strong influence
20
on CO levels in summer at SDZ as mentioned earlier. This result is also consistent with a previous rural study in China (Wang et al., 2006). While in other seasons, the larger amplitudes in diurnal variations were obtained in contrast to the summer season. The higher CO concentrations are found in the early morning and evening presumably duo to the extended transportation, domestic use of fossil fuels and biofuel
25
in the evening. The lower levels of CO were observed between 10:00 and 15:00 BST in the spring (567 ppbv), fall (543 ppbv) and winter (504 ppbv) presumably due to chemical conversion and vertical dilution after the breakup of the nocturnal boundary layer.
ACPD
8, 9405–9433, 2008 Characteristics of trace gaese in Northern China Z. Y. Meng et al. Title Page Abstract Introduction Conclusions References Tables Figures ◭ ◮ ◭ ◮ Back CloseFull Screen / Esc
Printer-friendly Version
Interactive Discussion 3.4 Trace gases concentrations with different air mass back trajectories
The long-range transport of air pollution has been the topic of scientific research for several decades, and the importance of long-range transport has been increasingly recognized (Cape et al., 2000; Kim et al., 2005; Ma et al., 2002a, b; Meng et al., 2007; Nolle et al., 2002; Pongkiatkul and Kim Oanh, 2007). To gain insights about the impact
5
of long-range transport, air mass 3 day back trajectories were calculated and clus-tered to analyze transport pathway of the air pollution to SDZ during 2006. Three day back-trajectories were calculated by Hybrid Single-Particle Lagrangian Integrated Tra-jectory (HYSPLIT 4.8) model with 6-hourly archived meteorological data provided from the US National Centers for Environmental Prediction (NCEP) global data assimilation
10
system (GDAS) which is called as the final run (FNL) data. HYSPLIT 4.8 Model was provided fromhttp://www.arl.noaa.gov/ready/hysplit4.html, NOAA Air Resources Lab-oratory. The location of backward trajectory start was SDZ with the altitude of 100 m above ground level (AGL). The trajectory computations were carried out four times a day during 2006, with the start time of 00:00, 06:00, 12:00, and 18:00 UTC. Run time
15
of every trajectory was 72 h (3 days).
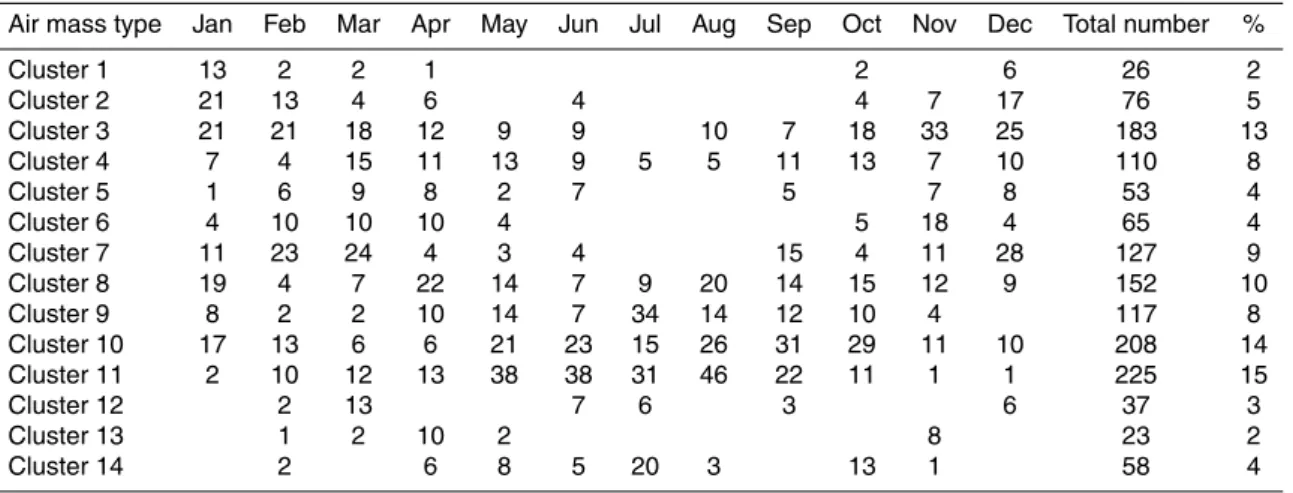
The relationship between trace gases concentration and transport pattern was stud-ied using the results of cluster analysis, together with the hourly concentrations of gaseous pollutants. Figure 5 shows the clusters of back trajectories arrived at the 100 m a.g.l. of SDZ during 2006. The numbers (1–14) in Fig. 5 identify the fourteen
20
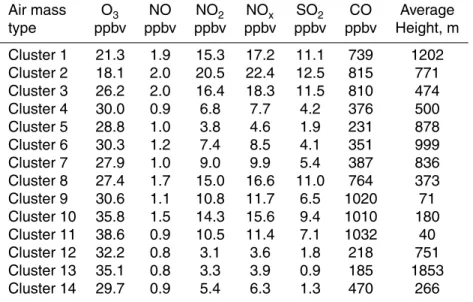
different clusters of various back trajectories. The monthly occurrence frequency of each category is presented in Table 5. Statistics of hourly average concentrations of gaseous pollutants associated with each cluster of backward trajectories are shown in Table 6. The results show that the average trace gases concentrations within clusters from different directions are quite different.
25
Cluster 1, 2 and 3 are from the west sector of the site, and these air masses pass through Huhehaote, Zhangjiakou and so on, which are industrial cities in Northern China. Cluster 1 has the second highest height and the lowest frequency of all air
ACPD
8, 9405–9433, 2008 Characteristics of trace gaese in Northern China Z. Y. Meng et al. Title Page Abstract Introduction Conclusions References Tables Figures ◭ ◮ ◭ ◮ Back CloseFull Screen / Esc
Printer-friendly Version
Interactive Discussion mass clusters (Table 5), indicating longer distance with more rapid transport. Cluster 2
is similar to cluster 1, passing through the populated areas. The air masses have a po-tential to bring in the long-range transport air pollution to the site, for which the average O3, NO, NO2, NOx, SO2 and CO levels are 18.1, 2.0, 20.5, 22.4, 12.5 and 815 ppbv, respectively (Table 6). Furthermore, the cluster 2 has highest hourly averaged
con-5
centrations of the primary pollutants (NOxand SO2), and lowest level of the secondary pollutants (O3). Cluster 2 occurrs in January, February and December, giving rise to the elevated concentrations of primary gaseous pollutants observed at the SDZ site. Cluster 3 includes 183 members and contains 13% of the total available back trajecto-ries (TABT), and it is the third most observed air mass cluster. Cluster 3 is observed
10
mainly in the periods from January to April and October to December with the highest frequency in November. As Table 6 illustrated, the cluster-averaged O3, NO, NO2, NOx, SO2 and CO levelsare higher in cluster 3, with the mean values of 26.2 ppbv for O3, 2.0 ppbv for NO, 16.4 ppbv for NO2, 18.3 ppbv for NOx, 11.5 ppbv for SO2and 810 ppbv for CO, respectively.
15
The mean trajectory of clusters 4–7 and 13 is from the northwest, and it mainly reflects the clean air sectors of the site. The low cluster mean gaseous pollutants are found in clusters 4–7. It is noted that cluster 13 origin is at the highest height among the fourteen clusters. With its longer pathway, it is expected to bring in clean air masses. Low NO, SO2and CO concentrations (0.8, 0.9 and 185 ppbv) and higher O3
20
levels (35.1 ppbv) appear in cluster 13. This fact might reflect the substantial secondary production during the long-range transport.
The cluster 8, which includes 152 members, contains 10% of the TABT (Table 5). This cluster is similar to cluster 4, but with shorter pathways and lower height. It is noted that the cluster mean levels of NO, NO2, NOx, SO2and CO except O3for cluster
25
8 are approximately twice as high as those of cluster 4, which may be associated with the case most frequently observed in January, April, August and October.
The mean trajectory of cluster 9 represents the second lowest height among the 14 clusters, coming from the north and then passing through more polluted regions such
ACPD
8, 9405–9433, 2008 Characteristics of trace gaese in Northern China Z. Y. Meng et al. Title Page Abstract Introduction Conclusions References Tables Figures ◭ ◮ ◭ ◮ Back CloseFull Screen / Esc
Printer-friendly Version
Interactive Discussion as the Tangshan city before arriving at site. The mean second highest CO level is
found in cluster 9. The mean trajectory of cluster 10 represents the short trajectories that come from the south direction of SDZ with the air masses originated from the more heavily polluted regions. Cluster 10 has the second highest frequency of all clusters with 208 members, accounting for 14% of the TABT. The origins of cluster 10
5
are from Beijing, Shijiazhuang, Taiyuan and so on, occurring frequently from May to October. In this case the site is influenced more by local sources and the accumulation of pollutants. Cluster 10 has the second highest mean O3level (35.8 ppbv) and the third highest CO concentration (1010 ppbv). The origin of cluster 11 is at the lowest height among the 14 clusters, and occurs with the highest frequently of all clusters in 2006,
10
which includes 225 members and 15% of the TABT. This cluster is predominantly found in the period from May to September, with the highest occurrence frequency in August. Cluster 11 represents the short trajectories that come from the southeast directions of SDZ. Cluster 11 passes through the big city Tianjin, which is located within 200 km rang from the site. As a consequence, the average O3and CO levels for cluster 11 are
15
highest among all the clusters, with O3 of 38.6 ppbv and CO of 1032 ppbv, indicating the local influence with a short pathway. The low wind speed would limit the horizontal transport/dilution of locally emitted air pollution and enhance high air pollution build-up levels.
Cluster 12 originates from the clean regions in the north. Based on its pathway and
20
origin, this air mass is expected to bring in relatively clean air to the site. The cluster-averaged NO, NO2and NOx levels are lowest in cluster 12, while the O3 level by long pathway transport is higher (32.2 ppbv). Cluster 14 originates from the clean regions in the northeast, and is observed frequently in July, with the lower SO2and NOxlevels.
4 Conclusions
25
In this paper we present measurements results of trace gaseous pollutants made at Shangdianzi regional station in Northern China from September 2003 to
Decem-ACPD
8, 9405–9433, 2008 Characteristics of trace gaese in Northern China Z. Y. Meng et al. Title Page Abstract Introduction Conclusions References Tables Figures ◭ ◮ ◭ ◮ Back CloseFull Screen / Esc
Printer-friendly Version
Interactive Discussion ber 2006. The mean annual O3 concentrations were 30.1±21.0, 32.8±19.1 and
30.9±19.8 ppbv in 2004, 2005 and 2006. The corresponding NOx values were 14.5±14.0, 11.0±11.3 and 12.7±11.8 ppbv, respectively. The mean annual SO2 con-centrations were 5.9±10.0, 6.1±9.9 and 7.6±10.2 ppbv in 2004, 2005 and 2006, while the mean CO levels were 586±415 and 742±558 ppbv in 2005 and 2006. Monthly
5
mean SO2, NO2 and CO concentrations at SDZ were higher than those measured at the Longfengshan station, China, but were lower than or comparable to those mea-sured at the Linan station, China. The mean monthly O3 concentrations are compa-rable to those observed at the Linan and Longfengshan stations. These reflect the difference in the regional pollution. It is shown that the concentrations of SO2, NOx, O3
10
and CO at the background station have clear seasonal variations. O3rose shows that in spring, summer and fall, the O3concentrations in SW-WSW-W sectors are higher. SO2 and NOxroses show higher concentrations in the SSW-SW-WSW-W directions in win-ter, full and spring, while CO has higher concentrations in all directions in summer. The concentrations of O3, NOx, SO2and CO at the background station have clear diurnal
15
variation in different seasons. The back trajectory’s analysis suggests that the elevated concentrations of O3 and CO are accompanied by the transport from the southeast direction of SDZ during May to September. The highest SO2and NOxlevels are found for clusters coming from west of the site in November, December and January, and the lowest NOx, SO2 and CO levels for clusters coming from northwest. Analysis of the
20
gaseous pollutants roses and air-mass back trajectories show that higher concentra-tions of O3, CO, NOxand SO2are influenced by both local and long-range transport to the site.
Acknowledgements. This study was supported by National Basic Research Development
Pro-gram (2005CB422202). This research was also supported by the Ministry of Science and
25
Technology of China (Project No. 2001DIA10009) and (Grant No. 2004DFA06100). We thank the staffs of SDZ regional background station for their cooperative works during this study.
ACPD
8, 9405–9433, 2008 Characteristics of trace gaese in Northern China Z. Y. Meng et al. Title Page Abstract Introduction Conclusions References Tables Figures ◭ ◮ ◭ ◮ Back CloseFull Screen / Esc
Printer-friendly Version
Interactive Discussion References
Cape, J. N., Methven, J., and Hudson, L. E.: The use of trajectory cluster analysis to interpret trace gas measurements at Mace Head, Ireland, Atmos. Environ., 34, 3651–3663, 2000. Ding, G. A., Meng, Z. Y., Yu, H. Q., Wang, S. F., Wen, D. Y., Wang, and X. Y.: Measurement
and research on ABL air pollution in Beijing, J. Appl. Meteor. Sci., 13 (special), 82–93, 2002
5
(in Chinese with English abstract).
Duen ˜as, C., Fern ´andez, M. C., Ca ˜nete, S., Carretero, J., and Liger, E.: Assessment of ozone variations and meteorological effects in an urban area in the Mediterranean Coast, Sci. Total Environ., 299, 97–113, 2002.
Fischer, H., Kormann, R., Kl ¨upfel, T., Gurk, Ch., K ¨onigstedt, R., Parchatka, U., M ¨uhle, J., Rhee,
10
T. S., Brenninkmeijer, C. A. M., Bonasoni, P., and Stohl, A.: Ozone production and trace gas correlations during the June 2000 MINATROC intensive measurement campaign at Mt. Cimone, Atmos. Chem. Phys., 3, 725–738, 2003,
http://www.atmos-chem-phys.net/3/725/2003/.
Garc´ıa, M. A., S ´anchez, M. L., P ´erez, I. A., and de Torre, B.: Ground level ozone concentrations
15
at a rural location in northern Spain, Sci. Tot. Environ., 348, 135–150, 2005.
Hao, J. M., Wang, L. T., Li, L., Hu, J. N., and Yu, X. C.: Air pollutants contribution and control strategies of energy-use related sources in Beijing, Sci. China Ser. D, 48 (Supplement II), 138–146, 2005.
Jaffe, D., Price, Heather., Parrish, D., Goldstein, A., and Harris, J.: Increasing background
20
ozone during spring on the west coast of North America, Geophys. Res. Lett., 30(12), 1613, doi:10.1029/2003GL017024, 2003.
Jaffe, D. and Ray, J.: Increase in surface ozone at rural sites in the western US, Atmos. Environ., 41, 5452–5463, 2007.
Jo, W. K. and Park, J. H.: Characteristics of roadside air pollution in Korean metropolitan city
25
(Daegu) over last 5 to 6 years: Temporal variations, standard exceedances, and dependence on meteorological conditions, Chemosphere, 59, 1557–1573, 2005.
Kim, J., Yoona, S. C., Jeffersonc, A., Zahorowskid, W., and Kange, C. H.: Air mass charac-terization and source region analysis for the Gosan super-site, Korea, during the ACE-Asia 2001 field campaign, Atmos. Environ., 39, 6513–6523, 2005.
30
Ma, J., Liu, H., and Hauglustaine, D.: Summertime tropospheric ozone over China simulated with a regional chemical transport model, Part 1. Model description and evaluation, J.
Geo-ACPD
8, 9405–9433, 2008 Characteristics of trace gaese in Northern China Z. Y. Meng et al. Title Page Abstract Introduction Conclusions References Tables Figures ◭ ◮ ◭ ◮ Back CloseFull Screen / Esc
Printer-friendly Version
Interactive Discussion
phys. Res., 107(D22), 4660, doi:10.1029/2001JD001354, 2002a.
Ma, J., Richter, A., Burrows, P. B., N ¨uß, H., and Van Aardenne, J. A.: Comparison of
model-simulated tropospheric NO2over China with GOME-satellite data, Atmos. Environ., 40, 593–
604, 2006.
Ma, J. and Van Aardenne, J. A.: Impact of different emission inventories on simulated
tropo-5
spheric ozone over China: A regional chemical transport model evaluation, Atmos. Chem.
Phys., 4, 877–887, 2004,http://www.atmos-chem-phys.net/4/877/2004/.
Ma, J., Zhou, X., and Hauglustaine, D.: Summertime tropospheric ozone over China simulated with a regional chemical transport model. Part2. Source contribution and budget, J. Geophys. Res., 107(D22), 4612, doi:10.1029/2001JD001355, 2002b.
10
Marenco, A. H., Nedelec, G. P., and Pages, J. P.: Evidence of a long-term increase in tro-pospheric ozone from Pic du Midi data series. Consequences: Positive radiative forcing, J. Geophys. Res., 99, 16 617–16 632, 1994.
Meng, Z. Y., Ding, G. A., Yu, H. Q., and Wang, S. F.: The preliminary research on the vertical
distribution of SO2and NO2concentrations in the northern part of Beijing, J. Appl. Meteor.
15
Sci 13(Suppl), 109–112, 2002 (in Chinese with English abstract).
Meng, Z. Y., Ding, G. A., Tang, J., and Wang, S. F.: Characteristics of Trace Gases at Shang-dianzi Background Station in autumn and winter in Beijing, Meteorol. Sci. Technol., 35(4), 548–557, 2007 (in Chinese with English abstract).
Meng, Z. Y., Ding, G. A., Xu, X. B., Xu, X. D., Yu, H. Q., and Wang, S. F.: Vertical distributions
20
of SO2 and NO2 in the lower atmosphere in Beijing urban areas, China, Sci. Tot. Environ.,
390, 457–466, 2008.
Meng, Z. Y., Jiang, X. M., Yan, P., Lin, W. L., Zhang, H. D., and Wang, Y.: Characteristics
and sources of PM2.5 and carbonaceous species during winter in Taiyuan, China, Atmos.
Environ., 41, 6901–6908, 2007.
25
Nolle, M., Ellul, R., Heinrich, G., and G ¨usten, H.: A long-term study of background ozone concentrations in the central Mediterranean – diurnal and seasonal variations on the island of Gozo, Atmos. Environ., 36, 1391–1402, 2002.
Pongkiatkul, P. and Oanh, N. T. K.: Assessment of potential long-range transport of particulate air pollution using trajectory modeling and monitoring data, Atmos. Res., 85, 3–17, 2007.
30
Tang, J., Wang, M. L., Cheng, H. B., Ding, G. A., Yu, X. M., Zhou, H. G., and Liu, G. P.: Variation characteristics of ambient NMHCs at Shangdianzi and Lin’an Regional GAW sites, Accta Meteorologica Sinica., 20(1), 334–341, 2007.
ACPD
8, 9405–9433, 2008 Characteristics of trace gaese in Northern China Z. Y. Meng et al. Title Page Abstract Introduction Conclusions References Tables Figures ◭ ◮ ◭ ◮ Back CloseFull Screen / Esc
Printer-friendly Version
Interactive Discussion
Wang, H. X., Tang, X. Y., Wang, M. L., Yan, P., Wang, T., Shao, K. S., Zeng, L. M., and Du, H. F.: Characteristics of observed trace gaseous pollutants in the Yangtze Delta, Sci. China, 46, 397–404, 2003a.
Wang, T., Ding, A. J., Gao, J., and Wu, W. S.: Strong ozone production in urban plumes from Beijing, China, Geophys. Res. Lett., 33, L21806, doi:10.1029/2006GL027689, 2006.
5
Wang, T., Cheung, V. T. F., Lam, K. S., Kok, G. L., and Harris, J. M.: The characteristics of ozone and related compounds in the boundary layer of the south China coast: temporal and vertical variations during autumn season, Atmos. Environ., 35, 2735–2746, 2001a.
Wang, T., Cheung, V. T. F., Anson, M., and Li, Y. S.: Ozone and related gaseous pollutants in the boundary layer of eastern China: Overview of the recent measurements at a rural site,
10
Geophys. Res. Lett., 28, 2373–2376, 2001b.
Wang, T., Poon, C. N. Y., Kwok, H., and Li, Y. S.: Characterizing the temporal variability and emission patterns of the pollution plumes in the Pearl River Delta of China, Atmos. Environ., 37, 3539–3550, 2003b.
Wang, W. X. and Wang, T.: On the origin and the trend of acid rain precipitation in China, Water
15
Air Soil Pollut., 85, 2295–2300, 1995.
WMO: World Data Centre for Greenhouse Gases (WDCGG) data summary, WDCGG No.31, 2007.
Xie, S. D., Yu, T., Zhang, Y. H., Zeng, L. M., Qi, L., and Tang, X. Y.: Characteristics of PM10,
SO2, NOx and O3in ambient air during the dust storm period in Beijing, Sci. Tot. Environ.,
20
345, 153–164, 2005.
Xu, X., Lin, W., Wang, T., Yan, P., Tang, J., Meng, Z., and Wang, Y.: Long-term trend of surface ozone at a regional background station in eastern China 1991–2006: enhanced variability,
Atmos. Chem. Phys., 8, 2595–2607, 2008,http://www.atmos-chem-phys.net/8/2595/2008/.
Xu, X. D., Shi, X. H., Xie, L. A., Ding, G. A., Miao, Q. J., Ma, J. Z., and Zheng, X. D.: Spatial
25
character of the gaseous and particulate state compound correlation of urban atmospheric pollution in winter and summer, Sci. China Ser. D., 48 (Supplement II), 64–79, 2005.
Yan, P., Tang, J., Huang, J., Mao, J. T., Zhou, X. J., Liu, Q., Wang, Z. F., and Zhou, H. G.: The measurement of aerosol optical properties at a rural site in Northern China, Atmos. Chem.
Phys., 8, 2229–2242, 2008,http://www.atmos-chem-phys.net/8/2229/2008/.
30
Zhao, D., Xiong, J., Xu, Y., and Chan, W. H.: Acid rain in southwestern China, Atmos. Environ., 22, 349–358, 1988.
ACPD
8, 9405–9433, 2008 Characteristics of trace gaese in Northern China Z. Y. Meng et al. Title Page Abstract Introduction Conclusions References Tables Figures ◭ ◮ ◭ ◮ Back CloseFull Screen / Esc
Printer-friendly Version
Interactive Discussion
Table 1. Instruments at the SDZ station, China.
Name Type Manufacturer Detection Limit
UV photometric Ozone Analyzer Model 49C Thermo Environmental Instruments Inc. USA 1.0 ppbv Chemiluminescence NO-NO2-NOxAnalyzer Model 42CTL Thermo Environmental Instruments Inc. USA 0.05 ppbv Pulsed Fluorescence SO2Analyzer Model 43CTL Thermo Environmental Instruments Inc. USA 0.1 ppbv Gas Filter Corre CO Analyzer Model 48C Thermo Environmental Instruments Inc. USA 40 ppbv O3Primary Standard Calibrator Model 49CPS Thermo Environmental Instruments Inc. USA 1.0 ppbv Dynamic Gas Calibration System Model 146C Thermo Environmental Instruments Inc. USA
Zero Air Supply Model 111 Thermo Environmental Instruments Inc. USA Standard Gases Made by EPA of China
ACPD
8, 9405–9433, 2008 Characteristics of trace gaese in Northern China Z. Y. Meng et al. Title Page Abstract Introduction Conclusions References Tables Figures ◭ ◮ ◭ ◮ Back CloseFull Screen / Esc
Printer-friendly Version
Interactive Discussion
Table 2. Statistics results of the measured trace gases concentrations (ppbv) at SDZ station,
China.
Time O3 NO NO2 NOx SO2 CO
Sep 2003–Dec 2003 Mean 26.8 0.7 10.1 10.8 2.2 505
Median 27.7 0.1 8.3 8.8 0.8 420
SD 13.9 1.8 7.9 8.8 3.6 335
Minimum 0.1 0.05 0.5 0.5 0.1 50
Maximum 99.9 27.7 53.0 57.0 27.4 1730
No. of points 1852 1858 1852 1858 1852 811
Jan 2004–Dec 2004 Mean 30.1 0.8 13.8 14.5 5.9
Median 26.7 0.05 9.5 10.1 1.5
SD 21.0 2.0 13.1 14.0 10.0
Minimum 1.0 0.05 0.05 0.1 0.1
Maximum 155.7 25.5 97.0 106.2 92.1
No. of points 8038 8244 8244 8245 8242
Jan 2005–Dec 2005 Mean 32.8 2.5 8.5 11.0 6.1 586
Median 30.4 2.8 5.3 7.4 2.3 495
SD 19.1 1.7 10.6 11.3 9.9 415
Minimum 0.1 0.05 0.05 1.0 0.1 50
Maximum 135.2 30.5 121.8 147.6 87.4 3123
No. of points 8648 8169 8169 8169 8672 5173
Jan 2006–Dec 2006 Mean 30.9 1.3 11.5 12.7 7.6 742
Median 29.3 1.1 8.1 9.0 3.3 612 SD 19.8 1.9 10.8 11.8 10.2 558 Minimum 0.1 0.05 0.05 0.1 0.1 50 Maximum 153.5 25.9 77.8 93.3 83.6 3920 No. of points 8593 8421 8421 8421 8469 8381 SD: standard deviation.
ACPD
8, 9405–9433, 2008 Characteristics of trace gaese in Northern China Z. Y. Meng et al. Title Page Abstract Introduction Conclusions References Tables Figures ◭ ◮ ◭ ◮ Back CloseFull Screen / Esc
Printer-friendly Version
Interactive Discussion
Table 3. Comparison with the observations made at other sites (monthly value).
Station Location Period O3 NO2 SO2 CO
(ppbv) (ppbv) (ppbv) (ppbv) Shangdianzi, Chinaa 40.39◦N, 117.07◦E, 293.3 m Sep 2003–Dec 2006 13.8–52.1 1.7–27.5 0.1–15.2 430–923
Linan, Chinaa 30.18◦N, 119.44◦E, 138.6 m Jul 2005–Nov 2006 17.5–44.8 6.6–24.0 8.6–27.1 501–948
Longfengshan,Chinaa 44.73◦N, 127.60◦E, 310.0 m Jul 2005–Nov 2006 25.2–47.3 0.9–8.8 0.4–5.8 169–591
Diabla Gora,Polandb 54.15◦N, 22.07◦E, 157 m Jan 1990–Sep 2006 10.7–46.4 0.1–1.7 0.1–2.7
Leba,Polandb 54.75◦N, 17.53◦E, 2 m Apr 1993–Sep 2006 1.2–8.0 0.4–6.1
Burgas,Bulgariab 42.48◦N, 27.48◦E, 16 m Jan 1990–May 2006 1.6–43.0 0.4–19.5
Pleven,Bulgariab 43.42◦N, 24.60◦E, 64 m Jan 1990–May 2006 1.1–19.1 0.4–37.4
Jakarta, Indonesiab 6.18◦S, 106.83◦E, 7 m Oct 1994–Oct 2005 3.0–65.8 1.0–13.2
Ryori, Janpanb 39.03◦N, 141.82◦E, 260 m Jan 1991–Sep 2006 23.1–56.9 96–235
Trinidad Head, USAb 41.05◦N, 124.15◦W, 120 m Apr 2002–May 2005 22.7–44.9
Pallas-Sammaltunturi, Finlandb 67.97◦N, 24.02◦E, 565 m Dec 2001–May 2005 28.0–44.8 98–192
a
Our study.
b
ACPD
8, 9405–9433, 2008 Characteristics of trace gaese in Northern China Z. Y. Meng et al. Title Page Abstract Introduction Conclusions References Tables Figures ◭ ◮ ◭ ◮ Back CloseFull Screen / Esc
Printer-friendly Version
Interactive Discussion
Table 4. The seasonal variations of trace gases and meteorological data (mean and standard
deviation) during the observational period at SDZ, China.
O3ppbv NO ppbv NO2ppbv NOxppbv SO2ppbv CO ppbv RH (%) Temperature (◦C) Wind speed (m/s)
Spring 38.8 (17.2) 1.6 (1.4) 8.5 (8.0) 10.1 (7.9) 6.7 (8.8) 648 (493) 37 (23) 12.0 (8.2) 3.3 (2.0) Summer 36.9 (22.9) 1.1 (1.2) 5.8 (4.1) 7.0 (4.3) 1.3 (2.6) 731 (394) 71(20) 23.2 (4.5) 2.3 (1.4) Fall 27.6 (19.8) 1.1 (1.9) 15.4 (12.9) 16.4 (13.5) 6.5 (9.6) 654 (527) 54 (24) 10.8 (8.2) 2.4 (1.5) Winter 20.9 (11.6) 2.1 (2.9) 14.5 (14.9) 16.6 (16.6) 10.7 (13.0) 670 (615) 41 (20) −4.5 (5.0) 2.2 (1.5)
ACPD
8, 9405–9433, 2008 Characteristics of trace gaese in Northern China Z. Y. Meng et al. Title Page Abstract Introduction Conclusions References Tables Figures ◭ ◮ ◭ ◮ Back CloseFull Screen / Esc
Printer-friendly Version
Interactive Discussion
Table 5. Monthly occurrence frequency of each type of air masses arriving at SDZ, China
during 2006.
Air mass type Jan Feb Mar Apr May Jun Jul Aug Sep Oct Nov Dec Total number %
Cluster 1 13 2 2 1 2 6 26 2 Cluster 2 21 13 4 6 4 4 7 17 76 5 Cluster 3 21 21 18 12 9 9 10 7 18 33 25 183 13 Cluster 4 7 4 15 11 13 9 5 5 11 13 7 10 110 8 Cluster 5 1 6 9 8 2 7 5 7 8 53 4 Cluster 6 4 10 10 10 4 5 18 4 65 4 Cluster 7 11 23 24 4 3 4 15 4 11 28 127 9 Cluster 8 19 4 7 22 14 7 9 20 14 15 12 9 152 10 Cluster 9 8 2 2 10 14 7 34 14 12 10 4 117 8 Cluster 10 17 13 6 6 21 23 15 26 31 29 11 10 208 14 Cluster 11 2 10 12 13 38 38 31 46 22 11 1 1 225 15 Cluster 12 2 13 7 6 3 6 37 3 Cluster 13 1 2 10 2 8 23 2 Cluster 14 2 6 8 5 20 3 13 1 58 4
ACPD
8, 9405–9433, 2008 Characteristics of trace gaese in Northern China Z. Y. Meng et al. Title Page Abstract Introduction Conclusions References Tables Figures ◭ ◮ ◭ ◮ Back CloseFull Screen / Esc
Printer-friendly Version
Interactive Discussion
Table 6. Statistics of hourly average concentrations of gaseous pollutants based on
corre-sponding clusters of backward trajectories.
Air mass O3 NO NO2 NOx SO2 CO Average
type ppbv ppbv ppbv ppbv ppbv ppbv Height, m Cluster 1 21.3 1.9 15.3 17.2 11.1 739 1202 Cluster 2 18.1 2.0 20.5 22.4 12.5 815 771 Cluster 3 26.2 2.0 16.4 18.3 11.5 810 474 Cluster 4 30.0 0.9 6.8 7.7 4.2 376 500 Cluster 5 28.8 1.0 3.8 4.6 1.9 231 878 Cluster 6 30.3 1.2 7.4 8.5 4.1 351 999 Cluster 7 27.9 1.0 9.0 9.9 5.4 387 836 Cluster 8 27.4 1.7 15.0 16.6 11.0 764 373 Cluster 9 30.6 1.1 10.8 11.7 6.5 1020 71 Cluster 10 35.8 1.5 14.3 15.6 9.4 1010 180 Cluster 11 38.6 0.9 10.5 11.4 7.1 1032 40 Cluster 12 32.2 0.8 3.1 3.6 1.8 218 751 Cluster 13 35.1 0.8 3.3 3.9 0.9 185 1853 Cluster 14 29.7 0.9 5.4 6.3 1.3 470 266
ACPD
8, 9405–9433, 2008 Characteristics of trace gaese in Northern China Z. Y. Meng et al. Title Page Abstract Introduction Conclusions References Tables Figures ◭ ◮ ◭ ◮ Back CloseFull Screen / Esc
Printer-friendly Version
Interactive Discussion
Fig. 1. Location of the Shangdianzi, Linan and Longfenshan regional background stations of
ACPD
8, 9405–9433, 2008 Characteristics of trace gaese in Northern China Z. Y. Meng et al. Title Page Abstract Introduction Conclusions References Tables Figures ◭ ◮ ◭ ◮ Back CloseFull Screen / Esc
Printer-friendly Version
Interactive Discussion Aug Nov Feb May Aug Nov Feb May Aug Nov Feb May Aug Nov
400 600 800 1000 Month ( 2003-2006) C O (p p b ) 0 8 16 SO 2 (p p b ) 10 20 30 N O x (p p b ) 0 10 20 30 N O2 (p p b ) 0 4 8 N O (p p b ) 20 40 60 O3 (p p b )
ACPD
8, 9405–9433, 2008 Characteristics of trace gaese in Northern China Z. Y. Meng et al. Title Page Abstract Introduction Conclusions References Tables Figures ◭ ◮ ◭ ◮ Back CloseFull Screen / Esc
Printer-friendly Version Interactive Discussion 0 10 20 30 40 50 60 N E S W O3-spring O3-summer O3-fall O3-winter -3 2 7 12 17 22 27 N E S W SO2-spring SO2-summer SO2-fall SO2-winter 0 5 10 15 20 25 30 N E S W NOx-spring NOx-summer NOx-fall NOx-winter 0 300 600 900 1200 N E S W CO-spring CO-summer CO-fall CO-winter
Fig. 3. Trace gaseous pollutants roses during the four different seasons over the 3-year study period.
Fig. 3. Trace gaseous pollutants roses during the four different seasons over the 3-year study
ACPD
8, 9405–9433, 2008 Characteristics of trace gaese in Northern China Z. Y. Meng et al. Title Page Abstract Introduction Conclusions References Tables Figures ◭ ◮ ◭ ◮ Back CloseFull Screen / Esc
Printer-friendly Version Interactive Discussion O3 0.0 20.0 40.0 60.0 0:00 3:00 6:00 9:00 12:00 15:00 18:00 21:00 0:00 Hour (BST) O 3 ( ppb ) Spring Summer Fall Winter NO 0.0 1.0 2.0 3.0 4.0 0:00 3:00 6:00 9:00 12:00 15:00 18:00 21:00 0:00 Hour (BST) N O (ppb) Spring Summer Fall Winter NO2 0.0 3.0 6.0 9.0 12.0 15.0 18.0 21.0 0:00 3:00 6:00 9:00 12:00 15:00 18:00 21:00 0:00 Hour (BST) N O 2 (p p b ) Spring Summer Fall Winter NOx 0.0 4.0 8.0 12.0 16.0 20.0 24.0 0:00 3:00 6:00 9:00 12:00 15:00 18:00 21:00 0:00 Hour (BST) N O x( ppb) Spring Summer Fall Winter SO2 0.0 4.0 8.0 12.0 16.0 20.0 24.0 0:00 3:00 6:00 9:00 12:00 15:00 18:00 21:00 0:00 Hour (BST) S O 2 (p p b ) Spring Summer Fall Winter CO 0 300 600 900 0:00 3:00 6:00 9:00 12:00 15:00 18:00 21:00 0:00 Hour (BST) C O ( ppb ) Spring Summer Fall Winter
Fig.4. Averaged diurnal variations of trace gases for four seasons over the 3-year study period.
ACPD
8, 9405–9433, 2008 Characteristics of trace gaese in Northern China Z. Y. Meng et al. Title Page Abstract Introduction Conclusions References Tables Figures ◭ ◮ ◭ ◮ Back CloseFull Screen / Esc
Printer-friendly Version
Interactive Discussion