HAL Id: halshs-00176546
https://halshs.archives-ouvertes.fr/halshs-00176546
Submitted on 4 Oct 2007HAL is a multi-disciplinary open access
archive for the deposit and dissemination of sci-entific research documents, whether they are pub-lished or not. The documents may come from teaching and research institutions in France or abroad, or from public or private research centers.
L’archive ouverte pluridisciplinaire HAL, est destinée au dépôt et à la diffusion de documents scientifiques de niveau recherche, publiés ou non, émanant des établissements d’enseignement et de recherche français ou étrangers, des laboratoires publics ou privés.
Contextual appraisal of GM cotton diffusion in South
Africa
Michel Fok, Marnus Gouse, Jean-Luc Hofs, Johann Kirsten
To cite this version:
Michel Fok, Marnus Gouse, Jean-Luc Hofs, Johann Kirsten. Contextual appraisal of GM cotton diffusion in South Africa. Life Science International Journal, 2007, 1 (4), pp.468-482. �halshs-00176546�
Contextual appraisal of GM cotton diffusion in South Africa
Michel Fok1, Jean-Luc Hofs1, Marnus Gouse2, Johann Kirsten2 1 CIRAD, France ; 2 University of Pretoria, South Africa
Published in: Life Science International Journal, Vol. 1, No. 4, Page 468-482
ABSTRACT
The bulk of the South African cotton crop is produced by large scale commercial farmers. Therefore it might be misleading to present South Africa’s impressive Genetically Modified Cotton (GMC) adoption figures as evidence of successful GMC use by smallholder farmers. The South African cotton sector struggles in an unstable production and market environment and smallholders with limited resources and limited production, managerial and marketing capacity and choice suffer most. The total South African cotton area and number of farmers decreased drastically since the introduction of GMC and this causes observers to question the so-called success story of GMC in South Africa. The South African smallholder experience has shown that technology introduction on its own cannot sustainably increase production; factors like institutional arrangements plays a vital role. Studies have in the past focussed exclusively on the performance of the new technology and the institutional role has been under emphasised. The results of our research complement the existing studies by pointing out low profitability in an unfavourable climatic and institutional context. This reminds us that rain-fed agriculture remains sensitive to climatic hazards and that new technology adoption under these conditions might increase financial risk associated with cotton production.
2 INTRODUCTION
A number of studies have assessed the effectiveness and profitability of the use of Genetically Modified Varieties (GMV) in agriculture (Edens, et al., 1998; Marra, et al., 2003; McBride and Books, 2000). Genetically Modified Cotton (GMC) has received most attention to date, in particular insect-resistant varieties utilising a Bt gene (Bt-cotton). The relevance of using GMVs in developing countries nevertheless remains a matter of controversy. Even though most research studies in DC have shown a range of benefits accruing to smallholders some opponents ague that these varieties do not fit the real needs of smallholders in DCs (Mazoyer, 2000; Myers, 1999), others still question their effectiveness and profitability (de Grassi, 2003) owing to the high seed cost and even more so when seeds are supplied through a monopolistic market scheme (Pschorn-Strauss, 2004). After about ten years of dissemination of Bt-cotton, positive global impacts are still emphasized (Brookes and Barfoot, 2006; Gomez-Barbero and Rodriguez-Cerezo, 2006), but recently more balanced views also caution against shortfalls of the economic analysis implemented (Fok, 2006; Smale, et al., 2006) and focus more on the variation of the impacts according to local agronomic and institutional conditions (Fok, 2006; Smale, et al., 2006) or in advocating for organisational and institutional adjustments so as to ensure fair and profitable conditions to producers in DCs (Fok, 2006).
Developing countries, notably in Africa, are keen on using GMC. South Africa has been planting Bt-cotton since the 1997/98 cotton production season. Burkina Faso has just decided to move forward dissemination after field experiment since 2002 (Baillard, 2006) but farmers in Mali have again demonstrated their opposition even for the conduct of field trials on Bt-cotton (Samphier and Carlile, 2006). Outside Africa, Bt-cotton sector stakeholders in Pakistan are pushing for the authorisation of Bt-cotton so as not to further lag behind India. The observation of the positive experiences in DCs (China, South Africa, India) has contributed to convince international organizations to support the promotion of GMC in other DCs (Hoag, 2003).
The positive outcomes associated with Bt-cotton pertain to profitability gain (resulting from reduction of insecticide sprays and yield increase due to bollworm damage limitation) as well as to a net diminution in labour investment (for insecticide spraying, not considering greater labour requirement at harvest associated with higher yield) However extrapolation of these results are tricky as local contexts seldom are taken into account, in particular with regard to the organisation of the input and output markets and institutional arrangements that govern them, a factor of critical importance in smallholding production.
This paper endeavours to more comprehensively report on the South-African smallholder Bt-cotton experience, and reports the findings of a survey conducted during the 2002/03 Bt-cotton production season. It will emphasize the variation in profitability, the significant change in the production cost and the resulting greater financial risk associated to using Bt-cotton.
This paper is organized as follows. The first section sheds light on the characteristics of cotton production in South-Africa, while the second section provides a synthesis of previous impact assessment studies. The third section reports the outcomes of the survey focussing on the farming structure and the Bt-cotton economic results, achieved under quite unfavourable climatic and institutional conditions.
PRODUCTION KEEPS ON DECLINING
Minimal contribution of smallholders to cotton production
In spite of the liberalisation of the cotton sector in late 1997 when the Cotton Board was disillusioned in terms of the Marketing of Agricultural Products Act (1996), (or arguably maybe because of liberalisation), cotton production South-Africa followed a downward trend
reaching less than 20 000 tons of cotton lint, far from the historic record achieved in 1988 (Figure 1). The area under cotton has seen a continuous decline since 1989 and in recent years a number of cotton gins have been forced to close due to inability to cover fixed costs. Liberalisation of the cotton sector (cf. infra) and abolishment of the marketing board were not able to sustainably re-launch cotton production. Cotton lint importations have historically exceeded national production and have done so even in recent years when the national textile industry is struggling under globalisation pressure.
Due to South Africa’s political history, large-scale commercial farmers are generally white and smallholders black. For many commercial farmers cotton is not the dominant or only farming enterprise and it is produced in combination with other crops. The choice of enterprise is usually determined by availability of irrigation water, the rotation requirements of the soil and the relative prices of the competing enterprises like maize and sugar cane under irrigation or maize and sunflower seed on dryland. For smallholders the possibility of producing other crops is limited due to climatic conditions and a lack of support services. Like almost all previous SA smallholder cotton studies our survey was conducted in the Makhathini Flats, situated in northern KwaZulu Natal close to the borders with Swaziland and Mozambique. The Makhathini Flats is one of only two areas in South Africa where smallholders have been producing cotton for the last couple of decades in a relatively sustainable manner. The area receives an annual rainfall of about 550 mm, concentrated between September and May and due to this low rainfall and severely hot conditions in summer cotton is one of few crops that can be produced under dryland conditions on the Flats. Market liberalisation and an increased focus on smallholder farming after the change in the political regime has not had a sustainable positive effect on smallholder cotton production. In relative terms, the contribution of the smallholders to the national cotton production remains low and the percentage increase during the last couple of years is purely due to the decrease in production by commercial farmers (Figure 1 and Table 1).
Since liberalisation of the cotton sector, the number of the cotton growers in the Makhathini Flats has fluctuated around 3000 until the 2002/03 production season when the number of farmers fell to less than 400. The dryland area also fell from over 12 000 hectares in 1997/98 to around 5 000 hectares in 2001/02 to just over 1 400 hectares in 2002/03. In 2005/06 the number of cotton farmers again increased and more than 6 000 hectares of dryland cotton were planted. Reasons for these fluctuations in area and farmer numbers are explained later in the paper. Up to the 2002/03 campaign, cotton lint yield has fluctuated around 200 kg/ha or 540 kg/ha of seed cotton, or at best half of what was being observed in Francophone African countries. During the last couple of seasons, average yield has increased because of a higher share of irrigated production on the Makhathini Flats.
Table 1. Smallholders' contribution to cotton production in South Africa
Nat. Prod.
tons fibre total Kwazulu N. rainfed Irrigated total tons Nat. Share, % irrigated rainfed only
1996/97 45 000 3655 3000 11351 1671 13022 2925 6.5% 731 150 1997/98 31 000 3062 2200 12270 2226 14496 4094 13.2% 654 215 1998/99 42 000 3604 2200 7073 2360 9433 3345 8.0% 812 202 1999/00 53 000 3486 3000 7690 404 8094 809 1.5% 256 108 2000/01 30 000 3312 3000 4275 129 4404 1460 4.9% 977 331 2001/02 39 000 3688 3229 10828 88 10916 864 2.2% 650 154 2002/03 21 000 464 353 1421 55 1476 246 1.2% 695 145 2003/04 26 529 1891 1550 3395 1953 5348 1451 5.5% 862 207 2004/05 19 814 1669 548 1586 2103 3689 1715 8.7% 989 190 2005/06 17 503 2543 2169 6355 2731 9086 4223 20.9% 1055 177 2006/07 11 780 2295 853 3601 1374 4975 2171 18.4% 926 182
Sources : Cotton SA, Small-scale Farmer Development
Estimated Fiber Yield, kg/ha Cotton area by smallholders Fibre Production by smallholders
Nber smallholders
3 The general South African cotton story is thus not the “success story” as it is reported, especially in other developing countries (Gabre-Madhin and Haggblade, 2003). The main reasons why cotton production have decreased in SA are the low cotton world price and relatively better price of competing crops like maize, sunflower seed and sugar cane. The
world cotton price is deflated due to subsidy driven production in counties (like the US, the European Union and China as it was claimed by four African countries before the WTO Ministerial Meeting in Cancùn) and in combination with an (generally perceived) over valued local currency, the profitability of cotton production in SA is marginal. This despite the fact that there has been a noticeable increase in the national average yield with cotton lint yield increasing from less than 400 kg/ha to over 500 kg/ha which can be jointly attributed to more smallholder irrigation cotton and the use of Bt technology.
Figure 1. Cotton area, production and net exportations in South Africa
-100 -50 0 50 100 150 200 1960 1965 1970 1975 1980 1985 1990 1995 2000 2005
Surf(1000ha) Prod(1000t) Export (1000 t) 1000 ha or
Source:
Shift to non-regulated private monopoly after cotton sector reform
From a regulated sector to a liberalised one
Cotton production has a long history in South Africa but cotton policy was first formalised in 1974 with the establishment of the Cotton Board (Macrae, 1995). In addition to keeping statistics and grading and classification of seed cotton and lint, the Cotton Board established the seed cotton quotas to be ginned by ginneries as well as the lint quotas to be allocated to textile industries. The Cotton Board also administered the purchasing price of seed cotton in the framework of the "Cotton Marketing Committee". After the marketing board was dissolved role players in the cotton industry pushed for the establishment of a non-profit organisation to take over some of the essential, but not price fixing, functions of the Board. Cotton SA was established to amongst others render information services, to stimulate production and cotton use, enhance marketability through research, training and quality standards, and serve as an advisory body and industry forum.
Coordination between private operators - monopoly / monopsony
In the later 1980s, two companies were operating in the Makhathini Flats, supplying inputs on credit to farmers and buying back their cotton production. The credit advance was deducted when seed cotton was delivered to the gins. The two companies shared a weighing bridge and the spirit of cooperation led to the forming of a single company, named VUNISA, in 1989 4
5 (Witt, et al., 2006). This new company became the input supplier in the area and also supplied credit in association with the Land Bank. The endeavour was relatively successful for a couple of seasons with a loan recovery rate of close to 90% (Gouse, et al., 2005), primarily due to the fact that VUNISA was the only credit supplier and buyer and with this monopsonistic power were able to, in the absence of land rights, use the cotton crop as collateral for the production loan similar to how it is done in a number of south and eastern African countries. However, cotton production did not exactly flourish, possibly due to the monopolistic / monopsonistic system but more likely due to the harsh and variable climatic conditions, limited extension services, variable and marginal profitability of cotton production and limited training and support to new farmers.
From one private monopoly to another
The institutional structure however collapsed in the 2001/02 harvesting season when a new company, Makhathini Cotton Gin (Pty) Ltd, more commonly known as Makhathini Cotton Company (MCC), erected a new gin right next to the marketing depot of VUNISA. VUNISA distributed inputs and weighed and bought seed cotton at this deport, but their cotton gin was situated approximately 100km from the Flats in Pongola. At harvest time 2002 a large number of farmers sold their seed cotton to MCC despite the fact that they took credit from VUNISA and contractually agreed to deliver their seed cotton to VUNISA. VUNISA and the Land Bank suffered a serious financial loss and reacted by limiting credit for the next season to farmers they deemed faithful and a low risk. This was the main reason for the drastic reduction in the number of cotton growers for the 2002/03 season. MCC did not supply any production credit and by offering higher prices than VUNISA, forced VUNISA to stop operating on the Makhathini Flats in 2003/04, leaving the whole market to MCC.
Due to the political history of South Africa and due to credit (read grants) supplied in the past by, amongst others, the SA government through developing programmes in the former homeland areas, and inability of financial institutions to enforce repayment of loans, adverse selection by smallholders are not uncommon. Borrowing money from one gin and supplying to another is also not a rare occurrence in Africa where land ownership (default liability) is limited and the only collateral for a production loan is the potential harvest.
An exclusive shift to intensification
The more recent institutional evolution took place during our study season (2002/03) and are currently (2007) still in operation. While setting up its ginnery as mentioned above , MCC was also able to negotiate access to the land of an existing irrigation scheme (Mjindi Irrigation Scheme) enabling it to engage in direct cotton production. In addition, MCC also negotiated, and continuously negotiate, joint ventures with farmers who have land with access to irrigation water in order to produce irrigated cotton. Irrigation equipment is installed and depending on the arrangement with the farmer paid of over a number of seasons. Farmers who take part in this initiative have a choice of being involved in the farming activities or not; if not, the land is rented from them for the season or a longer period. Buy-in by the farmer and profit sharing is preferred as theft of especially fencing material and irrigation equipment is a major problem. The MCC also has an agreement with the Land Bank of repaying outstanding farmer loans.
By producing their own cotton under irrigation MCC should be able to supply a relatively stable flow of seed cotton to be ginned in their gin and are they not 100% dependant on variable smallholder dryland production. Due to the mild winter conditions in the Makhathini area it is also possible to produce irrigation maize directly after cotton has been harvested - in some seasons in fact it is not possible to produce maize in the summer as it is too hot for pollination to take place (partially explaining the focus on cotton in the area) . The objectives of the increased irrigation approach are to decrease production risk (associated with the
6 climate), increase productivity and better utilise the potential of the area. With additional maize production the MCC is able to sustain the cotton gin with a supplementary income. However only a limited number of farmers can be part of this initiative as not everyone has access to irrigation water and land; and with current world cotton prices, expressed in Rand terms, even irrigation cotton production’s profitability is questionable. It is thus possible that farmers will not be able to repay the cost of mainly irrigation equipment that they share with MCC. Only a few farmers are able to finance cotton inputs out of their own pockets and from other income sources and most farmers remain dependant on some kind of assistance. It can also be argued that these farmers who are able and willing to finance their own inputs are the real cotton farmers. In 2005/06 for instance the KwaZulu Natal Agricultural Department supplied input hampers to farmers on the Flats, which explains the jump in farmer numbers from 548 in 2004/05 to 2169 in 2005/06. In 2006/07 when no freebies were available farmer numbers again fell to 853.
LESSONS FROM THE STUDIES ON THE PROFITABILITY OF BT-COTTON IN SOUTH AFRICA
The impact assessment studies
Bt cotton was first released for commercial production for the 1997/98 production season. Impact assessment studies targeted at appraising Bt cotton's profitability and suitability for South African production conditions focussed on mainly smallholders as South Africa was one of few countries (and the only one in Africa) where smallholders adopted the new technology.
Findings of these studies showed that South African smallholders benefited from the introduction of Bt cotton (Beyers, et al., 2002; Gouse, et al., 2002a; Gouse, et al., 2002b; Gouse, et al., 2004; Ismaël, et al., 2002a; Ismaël, et al., 2002b; Morse, et al., 2004; Thirtle and Jenkins Beyers, 2003), but recently two studies have to explain the technological triumph in context of the institutional arrangement and the institutional shortfalls (Gouse, et al., 2005). Since the 2001/02 production season, the Centre de Coopération Internationale en Recherche Agronomique pour le Développement (CIRAD), jointly with the University of Pretoria, has undergone a more technical assessment of Bt cotton use. The research has consisted of evaluating the expression and effectiveness of Bt gene, of addressing the gene flow phenomenon and of the eventual evolution of the pest complex on cotton plants (Hofs, et al., 2006a; Hofs, et al., 2006b; Hofs, et al., 2006c). In addition, a survey was conducted in the 2002/03 season to understand the cotton production practises of smallholders. The results of this survey and study are reported in the next Section.
Profitability gain at low level of yield
In Table 2 and 3 the economic impacts of using Bt cotton by South African smallholders are considered in comparison with cotton producers in other countries, namely China (Pray, et al., 2002; Xu, et al., 2004), India (Bennett, et al., 2004; Orphal, 2005), Argentina (Qaim and de Janvry, 2003), Mexico (FAO, 2004; Magaña, et al., 1999; Traxler and Godoy-Avila, 2004), and the USA (Falck-Zepeda, et al., 1999; Fitt, 2003; Kerby, 2001). Only studies reporting similar impact indicators were used and a number of studies reporting aggregated information could not be included. The table contains countries where Bt cotton was extensively adopted but under very different production practises and not necessarily by smallholders.
Yield gain from a low initial yield
According to previous studies, the relative yield gain (expressed in percentage) that resulted from the use of Bt cotton in South Africa was higher than that found in other countries (Table
and 3). One of the main reasons for this is that the basis yield (non-Bt cotton yield) is very low and a small real change in yield is exaggerated when expressed relative to a low non-Bt or conventional cotton yield. In fact, in some countries and seasons, the yield advantage of Bt cotton was more than the total seed cotton yield attained per hectare in South Africa. The use of Bt-cotton in Australia, the yield world champion, has not induced any yield gain. This might be due to limited Lepidoptera pressure or Australian farmers’ effective insect control practises. It's also the case for one Chinese Province along the Valley of the Yangtze River where pest pressure used to be less important (Xu, et al., 2004), as opposed to what is reported for the Valley of the Yellow River (Pray, et al., 2002).
Table 2. Summary of the South African smallholder profitability assessment studies
Bt-Cotton non Bt-Cotton Bt-Cotton non Bt-Cotton Yield Input cost Cash expenses Net margin
1998/99 738 452 167 81 63% 20% 19% 106% 1999/00 489 264 57 -2 85% 25% 17% 2000/01 783 501 136 43 56% -22% -17% 216% Kirsten, Gouse et Beyers, 2002 1999/00 576 395 184 128 46% 51% 43% 1998/99 475 457 126 128 4% 16% -1% 1999/00 425 304 103 66 40% 16% 56%
Note: Cash expenses cover remunerated labour cost for harvest and insecticide spraying
Variation due to Bt-Cotton (% of non Bt-Cotton) Net margin, $/ha
Morse, Bennett et Ismaël, 2004
Thirtle et al, 2003
Source Campaign Seedcotton yield, kg/ha
Table 3. Impacts of Bt cotton use in other countries
Bt-Cotton non Bt-Cotton Bt-Cotton non Bt-Cotton Yield Input cost Cash expenses Net margin 1999/2000 3371 3186 967 749 6% -23% 29% 2000/01 2941 1901 1208 658 55% 4% 84% 2001/02 3481 3138 833 621 11% -17% 34% Xu et al, 2004 * 2002/03 3615 3829 1824 1963 -6% 43% -7% 2002/03 2180 1500 808 542 45% 15% 49% 2003/04 2250 1380 1106 636 63% 2% 74% 2002/03 non-irrigated 1253 1093 270 339 15% 107% 26% -20% 2002/03 irrigated 1683 1556 475 359 8% 35% 8% 32% Magaña et al, 1999 ** 1998/99 2068 1704 1102 630 21% -5% 75% 1997/98 2197 2197 0% 1998/99 4957 4142 20% 1999/00 2062 1558 174 135 32% 29% 2000/01 2182 1625 19 12 34% 58% 1996/97 4613 4929 -6% 9% 1997/98 5026 5002 0% 8% 1998/99 4076 4410 -8% -12% 1999/00 4805 4763 1% -13% 2000/01 4529 4381 3% -30% 2001/02 5497 5234 5% -35% Falck-Zepeda et al, 1999 ** 1998/99 1270 à 2540 3 à 11 % - 6 à -18 % Kerby, 2001 1996 à 2000 2748 2550 8%
* Net margin with only deduction of seed and insecticides costs
** Only costs related to pest control are taken into account (seeds + insecticides) Orphal, 2005
India China
Country Net margin, $/ha Variation due to Bt-Cotton (% of non Bt-Cotton)
Benett et al. 2004 * Pray et al, 2002
Source Campaign Seedcotton yield, kg/ha
Traxler et al. 2003 et FAO, 2004 Mexico USA Qaim & de Janvry, 2003 Fitt, 2003 ** Australia Argentina
The same observation applies for the relative gain of profitability. The relative gain in South Africa is amongst the highest because the yield gain (even though small in comparison with other countries’) has more than compensated the increase of the cost to control cotton pests (seeds + insecticides). With South African smallholders, the use of Bt-cotton has indeed resulted in an increase of pest control cost (Gouse, et al., 2002a), contrary to what is 7
commonly claimed in other countries. Part of the reason for this is that it has been shown that smallholders in SA spray only about half of the optimal level of insecticides (Shankar and Thirtle, 2005), due to limited availability of insecticides as linked to credit, limited knapsack sprayers, limited labour, limited clean spraying water and limited knowledge and managerial skills. But the cost increase effect is not limited to South Africa; in several countries, the cost increase with the seed cost and the additional technology fee has actually been higher than the saving from reduced insecticide usage. The contrary is true along the Valley of the Yellow River in China where the reduction in number of sprays has been substantial, with Chinese farmers in the past spraying up to 20 to 30 times a season. This also applies to Australia where the Bt technology fee1 was reduced by Monsanto.
Change in production cost structure and associated financial risk
Cotton production by smallholders in South Africa is not intensive. Cash expenses essentially correspond to acquisition of seeds and insecticides. Seeds have been supplied to smallholders at market price for a long time. The cost of seeds of conventional cotton was around US$ 26/ha and it has represented 40-60% of the total input cost. The adoption of Bt-cotton has led to seed’s share to increase to 70-80%, as a combined effect of a higher seed price but mainly the additional technology fee (Table 4). The change of this ratio is also valid in other countries. Again China is different. Although the adoption of Bt cotton has led to an increase in the seed price2, the ratio remains lower because of the high level of intensification while the number of insecticide sprays remain high after adoption due to high pest pressure, at least along the Yellow River Valley (Table 5).
Table 4. Change in the production cost structure of SA smallholders
% input cost % cash expenses % input cost % cash expenses
1998/99 79% 49% 47% 29% 1999/00 80% 60% 46% 32% 2000/01 69% 42% 36% 24% Kirsten, Gouse et Beyers, 2002 1999/00 74% 49% 1998/99 68% 47% 1999/00 72% 50%
Note: Cash expenses may include the remunerated labour to spray insecticdes and to harvest while some authors may include labour into the input costs
Morse, Bennett et Ismaël, 2004
Seed cost of Bt-Cotton Seed cost of non Bt-Cotton
Thirtle et al, 2003
Sources Campaign
The increase of the relative share of the seeds in the total input cost is globally important especially for developing countries and more specifically Africa. From the perspective of financially resource-poor farmers, this increase implies greater financial risk because the expense is incurred early in the season and cannot be adjusted to the evolution of the cropping season (Fok and Raymond, 1995). Reducing or fragmenting the use of inputs is commonly how farmers try to respond to adverse climatic conditions. This is indeed what was observed in South Africa where smallholders split one bag of seeds normally destined for one hectare
1
Monsanto has accepted to decrease the technology fee from Australian $ 245 to 170/ha, between 1996/97 and 2001/02, for fear of seeing farmers moving away from its varieties for economic reasons. With the last technology fee level, farmers have to strictly comply with recommended techniques of Bt-cotton.
2
Price has roughly tripled for open-population cultivars and increased ten fold with hybrid varieties.
9 to sow on two hectares3. A study on transgenic white maize in South Africa also found that smallholders who bought top-dressing fertiliser chose not to apply it after limited early season rainfall (Gouse, et al., 2006). The change of the production cost structure, as well as its implication on higher financial risk for the smallholders, has seldom been emphasized in Bt cotton impact assessment studies. A post-season technology fee payment arrangement might be more suited for especially Africa where the vast majority of cotton is produced on dryland and insect pressure is as variable as the climatic conditions.
3
Monsanto lately has taken this behaviour into account. Vis-à-vis smallholders, instead of distributing seeds in bags of 25 kg, seeds are now packaged in bags of 5 kg but the unit price has increased 30% as compared to the former packaging which is still in use for commercial farmers.
Table 5. Change in the production cost structure in other countries
% input cost % cash expenses % input cost % cash expenses
1999/2000 23% 16% 15% 12% 2000/01 21% 16% 7% 6% 2001/02 22% 18% 4% 3% 2002/03 non-irrigué 74% 34% 38% 11% 2002/03 irrigué 79% 31% 26% 8%
Mexico Magaña et al, 1999 **
1998/99
38% 12%
1999/00 60% 29% 15% 5%
2000/01 55% 26% 16% 6%
Seed cost of Bt-Cotton Seed cost of non Bt-Cotton Sources Campaign Countries Pray et al., 2002 Orphal, 2005 India
Note: Cash expenses may include the remunerated labour to spray insecticdes and to harvest while some authors may include labour into the input costs
Qain & de Janvry, 2003 Argentina
China
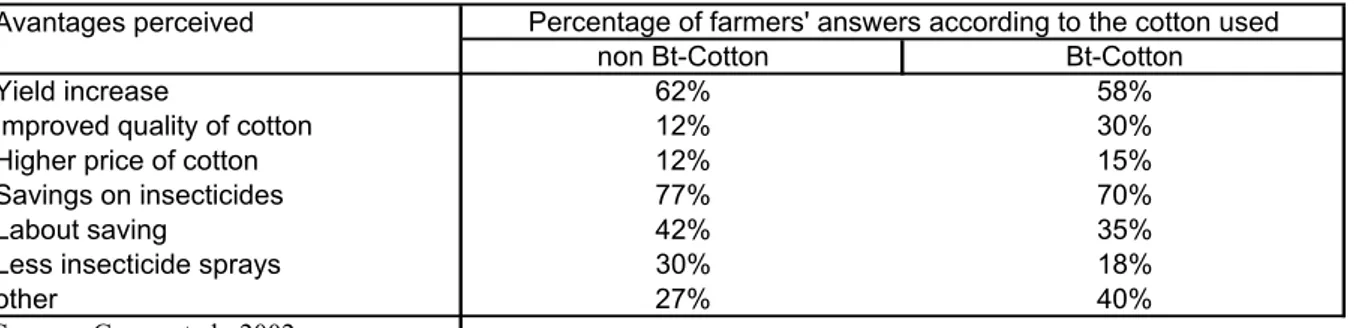
Perception of advantages and of positive evolutions linked to using Bt-cotton
A survey was conducted to capture the opinions of cotton farmers in South Africa (Gouse, et al., 2002b). The results show the difference between the advantages of Bt cotton as perceived by Bt adopters and non-adopters. (Table 6). The cost saving with regard to insecticides is to be understood broadly, it encompasses in particular the reduction of the transaction costs to acquire insecticides and which could be important for smallholders4. This advantage appears to become most important after the farmers adopt Bt cotton because in rural areas where infrastructure, transport and services are almost non-existent, managing pest infestation in crops is a major problem5.
Table 6. Distribution of the smallholders according to the perceived advantages associated with Bt cotton
non Bt-Cotton Bt-Cotton
Yield increase 62% 58%
Improved quality of cotton 12% 30%
Higher price of cotton 12% 15%
Savings on insecticides 77% 70%
Labout saving 42% 35%
Less insecticide sprays 30% 18%
other 27% 40%
Source : Gouse et al., 2002
Percentage of farmers' answers according to the cotton used Avantages perceived
At the level of commercial farmers, convenience or peace of mind is often emphasised6. Some commercial farmers have reported some positive evolution of the pest complex: the reduced use of pyrethroid insecticides might have favoured a greater presence of beneficials (like lady birds). This opinion nevertheless must be balanced by more frequent sucking pests, like jassids or aphids (Hofs, et al., 2006b) on which the predators feed.
4
Long distance travel to buy insecticides, at a time when there are so much to do in the fields correspond to costs that the use of Bt-Cotton contributes to alleviate
5
Pesticide application implies huge difficulties for small-scale cotton farmers. With a low level of education amongst small-scale farmers, problems with the mixing of pesticides and calibration of knapsack sprayers for different pesticides cause concern about the real efficacy and effectiveness of pesticide application. Applying pesticides is a labour intensive action for small-scale farmers. Walking with a knapsack sprayer on his back a farmer has to cover a distance of between 10 and 20 kilometres per hectare. Water has to be fetched from communal water points and water (especially in the Tonga community) is a scarce commodity and has to be fetched with water trucks or any other transport available. By the time a farmer has noticed bollworms, bought his pesticides and started to spray, severe damage has already been done.
6
The greatest advantage often mentioned pertains to peace of mind in conducting pest control during the Christmas and New Year’s period which falls in a crucial insect control stage. Less time has to be spent on scouting before spraying insecticides and climatic conditions play a lesser role in the effectiveness of insecticide applications.
FRAGILE AGRICULTURE AND BAD PROFITABILITY OF BT-COTTON IN AN UNFAVOURABLE YEAR
The results of the survey we conducted are presented so as to set the smallholders' cotton production in the context of the Makhathini Flats. The survey was implemented in eight villages of the Ubombo and Ngwavuma districts during the 2002/03 production season. The survey device was initially set up to capture the farming features of a sample of 193 farms and to get the opinions on cotton growing through a sub-sample of 86 farmers. However in this particular season there were only 353 cotton producers in total, and within the sub-sample to follow-up the cotton practices, only 56 farms eventually grew cotton. The sample size as share of the population appears to be substantial and not too small. However, in our experience the variability in data collected from smallholders producing under dryland conditions is usually considerable, resulting in findings like average yield differences to be statistically insignificant (under the 5% fresh hold) even though it might be substantial. The survey questionnaires were translated into Zulu and farmers were interviewed in three phases, at the farmers' houses or in their fields.
Agriculture: a marginal activity close to disappearing?
Families are relatively large, around 12 per household, and about 50% of the household is made up of adults older than 56 and children younger than 16. (Table 7). Very few people took part in farming activities and there is a need for additional labour to be remunerated by cash. Cash is however the limiting factor.
Table 7. Household demographics and constraints
woman man
Number of farms 78 115 193
% of farm heads never been schooled 82.7% 83.6% 83.5%
Number of people in household * 13,4 (5,5) 11,8 (4,9) 12.6
Number of people over 56 year old 2.2 2 2.1
Number of people less than 16 year old 4.9 4.6 4.9
% of farmers feeling the need of
complementary labour 100% 100% 100%
Total available land by farm * (ha) 7,4 (7,8) 6,2 (3,8) 6.7
Cultivated land by farm (ha) 2,4 (2,1) 1,8 (2,1) 2.1
Usage ratio of available land 35% 28% 31%
* significant at 5% threshold
Total Farm head is
Households have an average of 7 hectares available for farming but only one third was actually cultivated in the 2002/03 season. It has been reported that this under-use of available land was not specific to that production season only. This emphasises the shortage of willing labour and the decline of agriculture in the Makhathini Flats. It also emphasises that in many cases, land is not the limiting factor in African countries.
Female cotton farmers are not uncommon and like their male counterparts more than 80% of these female farmers have not had any formal schooling. Very few of the remaining 20% have attended secondary school.
Particular cotton specialization
Of the 86 farmers we monitored and who had intended to grow cotton, only 56 actually did; planting an average area of 2.3 ha of cotton per household. On the Flats there is a cotton specialisation which is not at all typical in family farming in Africa. During the 2002/03 season, we did not see any other crops being grown in the surveyed area, indicating that those
farmers who chose to not produce cotton, grew nothing else. The harsh climatic conditions, lack of irrigation and the lack of a functioning market are commonly considered the reasons why alternative cash crops like sugar cane and maize are not encountered (Witt, et al., 2006) amongst the traditionally cotton farmers. The under-utilisation of arable land and the lack of incentive of farmers to even try and grow part of their household food crop needs are definitely not the norm in the rest of Africa. In a continued study on transgenic white maize the University of Pretoria also found that fewer farmers are planting smaller maize areas. One of the explanations is that the last four seasons in the study area have been exceptionally dry but an additional explanation is that the previously disadvantaged now, compared to pre-democratic South Africa, receive substantially higher old age pension, disability grants and also more recently child grants. It is likely that it has become more convenient and affordable to just buy maize meal (the staple). In SA smallholder agriculture is also associated with poverty and farming is no longer attractive to the youth in the rural areas. The reduction, if not disappearance of the supply of much needed technical assistance, contributes to make agriculture further less attractive.
Cotton is cultivated for the cash income it could generate. Farmers site income security is one of the biggest reasons why cotton is grown, short after the advantage of benefiting from technical assistance (Table 8), although this assistance appears to be rather loose as compared to Francophone African countries. Farmers’ perception that cotton is adapted to the local conditions underscores their lack of production options in the harsh conditions.
Table 8. Distribution of the farmers' reasons in favour of growing cotton
1 2
Secured cash income 37 7 62
Quick payment 7 12 26
Profitability 3 9 20
Input credit supply 3 6 34
Technical assistance obtained 6 41 74
Crop adapted to local conditions 29 11 58
Other 2
Total 85 86 276
Reasons for growing cotton Total number of answers
Number of answers at rank
Just like in most other African countries, cotton cropping is felt to be demanding in terms of labour and cash expenses for production inputs. These are constraints that a steady financial source can help overcome, like pension allocated to elderly people7. We found that the farmers who grown cotton in 2002/03, when there was not credit available, had more financial resource through pension (on average, cotton planters had 0.67 pension compared to 0.17 of non-planters).
Limited extent of intensification furthermore reduced in unfavourable year
The 2002/03 season was characterised by late rain and drought at the time of fructification. The uncertainty about possible credit to fund inputs, which lasted beyond the normal dates for sowing, even further delayed sowing. The situation was also exacerbated by the limited availability of ploughing services when the rain eventually came. All the farmers in our sample hired a contractor for mechanised land preparation at Rand 370 (US $ 49.3) per hectare.
Inputs are limited to seeds and chemical insecticides and for Bt cotton ads up to an average of
7 In South Africa, a monthly pension of Rand 650 (or 97 US$ in 2005) was allocated to women and men respectively from
60 and 65 year old.
US $ 75/ha, which calculates to approximately 22% more than the US $ 61.3/ha of conventional cotton. In calculating this cost, we have taken into account the fact that farmers split one 25 kilogram bag of seeds to sow two hectares8; this is a practice which would have contributed to lower yields9 in the 2002/03 season.
The total cost to control cotton pests was lower than what has been reported in previous studies because of the lower pest pressure (inversely correlated with a drier season) which resulted in fewer chemical sprays. On average, farmers that produced conventional cotton sprayed 2.5 times, while Bt farmers sprayed 1.9 times. Even though there is a statistically significant difference it is hardly substantial (Table 9). Consequently, the total cost to control cotton pests was significantly higher with Bt-cotton. The cost of Bt seed corresponded to 65% of the total input cost compared to 42% of conventional cotton, of the same order than what was observed in previous studies. Not surprisingly the cost of land preparation for conventional cotton was the same as for Bt cotton.
The low pest pressure could have permitted Bt-cotton growers not to use pyrethroid-based insecticides (broad based but specific to control boll worms) at all. It was not the case although Bt cotton growers used significantly less than conventional cotton growers. Sucking pests cannot be controlled by the Bt gene and farmers still had to apply organophosphate-based insecticides. Bt farmers applied more organophosphates10, but the 25% difference was not statistically significant due to variability in the data.
Table 9. Production cost and profitability in 2002/03
Bt non-Bt value %
Average number of insecticide sprays 1,9 (0,6) 2,5 (0,8) -0,6 * -24% % of farmers using cypermethrin 60.0% 84.60% -24.60%
Dosage of cypermethrin g/ha (vs boll worms) 12,4 (12,2) 24,2 (15,0) -11,8 * -49% Dosage of Monostem g/ha (vs sucking pests) 110,0 (61,0) 88,0 (52,0) 22 25% cost of insecticides ($/ha) 25,9 (12,4) 35,6 (14,5) -9,7 * -27%
cost of seeds ($/ha) 49.0 25.7 23,3 * 91%
Total cost of inputs ($/ha) 75,0 (12,4) 61,3 (14,5) 13,7 * 22% cost of inputs + ploughing ($/ha) 124,4 (124,4) 110,6 (110,6) 13,8 * 12%
cost ratio seeds/inputs 65.3% 41.9% 23.4%
cost ratio seeds/cash expenses ** 39.4% 23.2% 16.2%
seedcotton yield (kg/ha) 522 (241) 423 (259) 99 23%
% of farms with yiled <400 kg/ha 30.00% 57.70% -27.70%
Income Net of cash expenses ($/ha) 84 (97) 58 (107) 26 45% % of farms with negative net income 6.70% 15.40% -8.70%
% of farms with positive net income <160 $/ha 63.30% 57.70% 5.60% % of farms with output/input ratio < 2 73.40% 69.60% 3.80% * Test of Student significant at 5% ** cash expenses without remunerated labour
Cotton type Difference (Bt - conventionnal)
Marginal profitability of cotton production
Under the unfavourable climatic conditions of the 2002/03 season , the average yield of conventional cotton was close to the longer term average of about 400 kg/ha of seed cotton but with great variability as can be seen from the standard deviation in brackets in Table 9. Nearly 60% of the conventional cotton farmers did not reach this yield level as compared to only 30% in the case of Bt cotton growers. The average yield for Bt-cotton was among the lowest reported in the previous research works; about 500 kg/ha. Because of the great fluctuation around the average yield and of the limited size of the survey sample, the 22% yield superiority of Bt cotton is not found statistically significant (Table 9).
8 In 2002/03, a bag of 25 kg of seeds was sold at Rand 387. An additional technology fee of Rand 350 was added to the
seed price. The total cost hence is US$ 98 per 25 kg bag of Bt seed or US $ 3.9/kg.
9
The late sowing and drought have limited the growth of cotton plants. More plants should have given higher yield.
10
A possible reason is that conventional cotton farmers also killed sucking insects in the cross-fire aimed at stalk borers
14 With regard to income after deduction of cash expenses and before remuneration of family labour, Bt cotton rendered US $ 84/ha on average, which is equivalent to a monthly pension for an elderly person. This figure is substantially higher but not statistically superior to the income from conventional cotton (US $ 58/ha). It is noteworthy that, even for the previous years which did not suffer from the same climatic and institutional shortfalls, the cotton income is low with reference to the monthly old age pension (Table 2). Clearly, the ability of small scale cotton production to reduce poverty appears to be limited on the Makhathini Flats, contrary to what used to be claimed (Ismaël, et al., 2002b; Thirtle and Jenkins Beyers, 2003). Analysis of the distribution of the income values provides some clarification about the profitability variation and the risk feature of cotton growing conditions of the 2002/03 season. About 15% of the conventional cotton growers did not even have enough income to cover cash expenses. Despite higher seed costs, only 7% of Bt farmers were not able to cover cash expenses. About two thirds of the farmers achieved positive income, after payment of cash expenses, but less than US $ 160/ha. Almost 70% of the farmers have grown cotton with an output/input ratio smaller than 2;generally regarded as the minimum ratio to motivate resource-poor farmers in investing in inputs, the payoff on investment is just too small.
One would think that these kind of results would deter farmers from growing cotton. However this is not the case and in our survey farmers indicated their intention to keep on growing cotton and using Bt cotton although they complain about the high seed cost. This intention has materialized as about 1500 farmers grew cotton in the 2003/04 season, 95% of them using Bt cotton. Farmers obviously recognise the fact that the 2002/03 season was a particularly bad year and ague that there might be money to make out of cotton in the future. Unfortunately, the option of favouring irrigated production (seer supra) is depriving a great number of farmers of the possibility to continue cotton production with credit and technical assistance as MCC do not supply these. Some observers also claim that the adoption rateof Bt cotton is high because the use of conventional cotton is being discouraged: although farmers might have access to conventional cotton seed, they have better insurance of selling their production if they buy Bt cotton because of the arrangements11 between the seed supplier and MCC (Witt, et al., 2006). This observation is however open to discussion as MCC is loosing money for not having enough cotton to gin and it should be happy to gin any cotton.
CONCLUSION
The bulk of the South African cotton crop is produced by large scale commercial farmers. There for it might be misleading to present South Africa’s impressive GM cotton adoption figures as evidence of successful GMC use by smallholder farmers. The Makhathini Flats Bt cotton story has been hailed as the first proof that genetically modified crops can benefit smallholders in Africa. There can be no doubt about the fact that the technology works and that farmers did benefit in seasons with high bollworm pressure. The institutional arrangements however need to be stressed for decision makers in other developing countries in order to see the SA smallholder Bt cotton experience in context. The SA experience emphasise the fact that resource poor farmers are more than willing to adopt new technologies if it is accompanied by credit and technical support, but the adoption of the technology alone do not ensure sustainable production or progress. Like in all agricultural sectors, the willingness to invest in agriculture, a production system and inputs is determined by the up and down stream institutional arrangements and structures. The way input and output markets are arranged and the way farmers are able to interact with and have access to these markets
11
It has been reported thatMCC only buys seed cotton in bags it has provided, and these bags are only distributed to farmers who have bought Bt cotton. Of cause the Flats have had a history of “polyprop” contamination and this might be the reason for distributing bags.
15 are crucial to the success of any agricultural endeavour. Technical solutions can not be expected to solve problems of an institutional order and in the case of the Makhathini Flats cotton producers, focus on a technical solution has diverted attention from the institutional problems.
South Africa commercial and smallholder cotton farmers cannot compete with subsidised cotton producers, like in the USA, and one can expect the cotton area in SA to keep declining as long as the world cotton price remains low compared to competing crops like maize, soy beans and sunflower seed. Recent institutional collapse and huge credit default in the Zimbabwean cotton sector is another example of an African country where the profitability of cotton production has become just too marginal. Large scale commercial farmers can usually adapt their production systems or plant other crops but smallholders’ resources are limited and they are hardest hit by a struggling cotton sector.
REFERENCES
Baillard, D., (2006), Le Burkina passe au coton transgénique. publié par Site http://www.rfi.fr/actufr/articles/083/article_47764.asp
Bennett, R.,Ismaël, Y.,Kambhampati, U. and Morse, S., 2004.Economic impact of genetically modified cotton in India AgBioForum 7, 3, 96-100.
Beyers, L.,Ismaël, Y.,Piesse, J. and Thirtle, C., 2002. Can GM-Technologies help the poor? The efficiency of Bt cotton adopters in the Makhathini Flats of Kwazulu-Natal. Imperial College London, Wye.
Brookes, G. and Barfoot, P., 2006.Global Impact of Biotech Crops: Socio-Economic and
Environmental Effects in the First Ten Years of Commercial Use AgBioForum. 9, 3, 139-131.
de Grassi, A., 2003. Genetically Modified Crops and sustainable poverty alleviation in Sub-Saharan Africa. An assessment of current evidence, Third World Network - Africa. 92 pp. Edens, E. R.,Slinsky, S.,Larson, J. A.,Roberts, R. K. and Lentz, G. L., 1998. Economic analysis of
genetically engineered Bt cotton for tobacco budworm and bollworm control. Communication presented to Conference 'Beltwide Cotton Conferences', 380-383. Falck-Zepeda, J. B.,Traxler, G. and Nelson, R. G., 1999. Rent creation and distribution from the first
three years of planting Bt cotton. ISAAA, New York.
FAO, 2004. La situation mondiale de l'alimentation et de l'agriculture 2003-2004. Les biotechnologies agricoles : une réponse aux besoins des plus démunis ? FAO, Rome.
Fitt, G. P., 2003. Utilisation et impact des cotons Bt transgéniques en Australie. ICAC recorder, Decembre 2003, 16-22.
Fok, A. C. M., 2006.Conditions, résultats et perspectives d'utilisation du coton génétiquement modifié (coton Bt) dans les PED Revue Tiers Monde, 188, 773-798.
Fok, A. C. M. and Raymond, G., 1995. Organisation locale d'adaptation au marché mondial du coton : le cas du Mali. in Matières premières, marchés mondiaux, déséquilibres, organisation, ed. S. Calabre, Ministère de la Coopération, Economica, Paris. 203-214
Gabre-Madhin, E. Z. and Haggblade, S., 2003. Successes in African agriculture: results of an expert survey, IFPRI, Washington. 43 pp.
Gomez-Barbero, M. and Rodriguez-Cerezo, E., 2006. Economic Impact of Dominant GM Crops Worldwide: a Review. Seville (Spain).
Gouse, M.,Kirsten, J. and Beyers, L., 2002a. Bt cotton in South Africa: adoption and the impact on farm incomes amongst small-scale and large scale farmers. Department of Agricultural Economics, Extension and Rural development. University of Pretoria, Pretoria.
Gouse, M.,Kirsten, J. and Jenkins Beyers, L., 2002b. Bt cotton in South Africa: adoption and the impact on farm incomes amongst small-scale and large scale farmers. University of Pretoria, Department of Agricultural Econmics, Pretoria.
16 Gouse, M.,Kirsten, J.,Shankar, B. and Thirtle, C., (2005), Bt cotton in Kwazulu Natal: technological
Triumph but institutional failure. publié par Site www.agbiotechnet.com
Gouse, M.,Pray, C.,Schimmelpfennig, D. E. and Kirsten, J., 2006.Three Seasons of Subsistence Insect-Resistant Maize in South Africa: Have smallholders benefited? AgbioForum 9, 1, 15-22.
Gouse, M.,Pray, C. E. and Schimmelpfennig, D. E., 2004.The distribution of benefits from Bt Cotton adoption in South Africa AgBioForum 7, 4, 187-194.
Hoag, H., 2003.Biotech firms join charities in drive to help Africa's farms Nature 422, 246, 1. Hofs, J. L.,Fok, A. C. M. and Vaissayre, M., 2006a.Impact of Bt cotton adoption on pesticide use by
smallholders: A 2-year survey in Makhathini Flats (South Africa) Crop Protection 25, 984-988.
Hofs, J. L.,Hau, B. and Marais, D., 2006b.Boll distribution patterns in Bt and non-Bt cotton cultivars: I. Study on commercial irrigated farming systems in South Africa Field Crop Research, 98, 203-299.
Hofs, J. L.,Hau, B.,Marais, D. and Fok, A. C. M., 2006c.Boll distribution patterns in Bt and non-Bt cotton cultivars: II. Study on small-scale farming systems in South Africa Field Crop Research 98, 2/3, 210-215.
Ismaël, Y.,Bennett, R. and Morse, S., 2002a.Benefits from Bt Cotton use by smallholders farmers in South Africa AgBioForum 5, 11, 1-5.
Ismaël, Y.,Beyers, L.,Thirtle, C. and Piesse, J., 2002b. Efficiency effects of Bt cotton. Smallholder adoption and economic impacts of Bt cottoon in Makhathini Flats, KwaZulu Natal, South Africa. in Economic and Social Issues in Agricultural Biotechnology, ed. R. E. Evenson, V. Santaniello and D. Zilberman, CABI Publishing, Wallingtoon and New York. 325-349 Kerby, T. A., 2001.What changes in yield and quality are due to transgenic varieties? The cotton gin
and oil mill press, 5-7.
Macrae, J., 1995. La compétitivité du coton dans le monde Pays hors zone franc, Ministère de la Coopération, Paris. 321 pp.
Magaña, J. E. M.,Garcia, J. G.,Rodriguez, A. J. O. and Garcia, J. M. O., 1999. Comparative analysis of producing transgenic cotton varieties versus non-transgenic variety in Delicias,
Chihuahua, Mexico. Communication presented to Conference 'Beltwide Cotton Conferences', 255-256.
Marra, M. C.,Pardey, P. G. and Alston, J. M., 2003.The payoffs to transgenic field crops: an assessment of evidence AgBioForum 5, 2, 43-50.
Mazoyer, M., (2000), La moitié de la paysannerie mondiale n'est pas solvable pour les grands laboratoires. publié par Site http://www.lemonde.fr/
McBride, W. D. and Books, N., 2000.Survey evidence on producer use and costs of Genetically modified seed Agribusiness 16, 1, 6-20.
Morse, S.,Bennett, R. and Ismaël, Y., 2004.Why Bt cotton pays for small-scale producers in South Africa e Biotechnology 22, 4, 379-380.
Myers, D., 1999.GM cotton fails to impress Pesticides News, 44, 6.
Orphal, J., 2005. Comparative analysis of the economics of Bt and Non-Bt cotton production. Institute of economics in Horticulture, Univ. of Hannover, Hannover, Germany.
Pray, C. E.,Huang, J.,Hu, R. and Rozelle, S., 2002.Five years of Bt cotton in China - the benefits continue The Plant Journal 31, 4, 423-430.
Pschorn-Strauss, E., (2004), Bt cotton and small-scale farmers in Makhathini - a story of debt, dependency, and dicey economics. publié par Site
http://www.grain.org/research/btcotton.cfm?id=100
Qaim, M. and de Janvry, A., 2003.Genetically modified crops, corporate pricing strategies, and Farmers' adoption: the case of Bt cotton in Argentina Amer. J. Agr. Econ. 85, 4, 814-828. Samphier, T. and Carlile, L., (2006), African farmers say GM crops are not the way forward. publié
par International Institute for Environment and Development. Site http://www.iied.org/mediaroom/release/290106.html
17 African smallholder case Journal of agricultural Economics 56, 1,
Smale, M.,Zambrano, P. and Cartel, M., 2006.Bales and Balance: A Review of the Methods Used to Assess the Economic Impact of Bt Cotton on Farmers in Developing Economies AgBioForum 9, 3, 195-212.
Thirtle, C. and Jenkins Beyers, L., 2003.Can GM-technologies help African smallholders? The impact of Bt cotton in the Makhathini Flats of Kwazulu-Natal World development 31, 4, 717-732.
Traxler, G. and Godoy-Avila, S., 2004.Transgenic cotton in Mexico AgBioForum 7, 1&2, 57-62. Witt, H.,Patel, Rajeev and Schnurr, M., 2006.Can the Poor Help GM Crops? Technology,
Representation & Cotton in the Makhathini Flats, South Africa Review of African Political Economy, 109, 497-513.
Xu, J.,You, Z.,Wang, W. and Yang, Y., 2004.Economic analysis of Bt cotton Planting in Jiangsu Journal of Yangzhou University (Agricultural and Life Science Edition) 25, 3, 65-69.