HEPATOBILIARY-PANCREAS
Perfusion CT best predicts outcome after radioembolization
of liver metastases: a comparison of radionuclide and CT
imaging techniques
Fabian Morsbach&Bert-Ram Sah&Lea Spring&Gilbert Puippe&Sonja Gordic&
Burkhardt Seifert&Niklaus Schaefer&Thomas Pfammatter&Hatem Alkadhi&
Caecilia S. Reiner
Received: 20 November 2013 / Revised: 1 April 2014 / Accepted: 7 April 2014 / Published online: 12 May 2014 # European Society of Radiology 2014
Abstract
Objective To determine the best predictor for the response to and survival with transarterial radioembolisation (RE) with
90
yttrium microspheres in patients with liver metastases. Methods Forty consecutive patients with liver metastases un-dergoing RE were evaluated with multiphase CT, perfusion CT and 99mTc-MAA SPECT. Arterial perfusion (AP) from perfusion CT, HU values from the arterial (aHU) and portal venous phase (pvHU) CT, and99mTc-MAA uptake ratio of metastases were determined. Morphologic response was eval-uated after 4 months and available in 30 patients. One-year survival was calculated with Kaplan-Meier curves.
Results We found significant differences between responders and non-responders for AP (P<0.001) and aHU (P=0.001) of metastases, while no differences were found for pvHU (P= 0.07) and the99mTc-MAA uptake ratio (P=0.40). AP had a significantly higher specificity than aHU (P=0.003) for deter-mining responders to RE. Patients with an AP >20 ml/100 ml/ min had a significantly (P= 0.01) higher 1-year survival, whereas an aHU value >55 HU did not discriminate survival
(P=0.12). The Cox proportional hazard model revealed AP as the only significant (P = 0.02) independent predictor of survival.
Conclusion Compared to arterial and portal venous enhance-ment and the99mTc-MAA uptake ratio of liver metastases, the AP from perfusion CT is the best predictor of morphologic response to and 1-year survival with RE.
Key Points
• Perfusion CT allows for calculation of the liver arterial perfusion.
• Arterial perfusion of liver metastases differs between re-sponders and non-rere-sponders to RE.
• Arterial perfusion can be used to select patients responding to RE.
Keywords Liver perfusion . Computed tomography .
99m
Tc-MAA uptake ratio . Transarterial radioembolisation . Liver metastases
Introduction
Transarterial radioembolisation (RE) using90Y-microspheres has proven to be a valuable option for patients with unresectable metastatic liver disease [1–3]. The rationale for RE is that liver neoplasms mainly have an arterial blood supply as opposed to healthy liver tissue, which is predomi-nantly supplied by the portal vein [4]. It has been demonstrat-ed in explantdemonstrat-ed livers that90Y-microspheres mainly accumu-late in arterially perfused areas of tumours and not in healthy liver parenchyma [5,6].
Given that previous studies reported mixed response and survival rates for RE [7,8], it is crucial to select patients who will likely respond to therapy. Some recent studies aimed at
F. Morsbach
:
L. Spring:
G. Puippe:
S. Gordic:
T. Pfammatter:
H. Alkadhi (*):
C. S. ReinerInstitute of Diagnostic and Interventional Radiology, University Hospital Zurich, Zurich, Switzerland
e-mail: [email protected] B.<R. Sah
:
N. SchaeferDivision of Nuclear Medicine, University Hospital Zurich, Zurich, Switzerland
N. Schaefer
Clinic for Oncology, University Hospital Zurich, Zurich, Switzerland B. Seifert
Division of Biostatistics, Institute of Social and Preventive Medicine, University of Zurich, Zurich, Switzerland
patient selection based on a semiquantitative assessment of vascularity using multiphase computed tomography (CT) and catheter angiography, but did not reveal a correlation between tumour vascularity and treatment success [9–11]. This has been explained by the fact that subjective definitions of hypo- and hypervascularity do not necessarily reflect tumour histology and angiogenesis [10]. Another such effort involved measuring the uptake of 99mTc-macroaggregated albumin (99mTc-MAA) in liver metastases using single-photon emis-sion CT (SPECT) [12]. However, no relationship was found between the pattern and extent of99mTc-MAA uptake in liver metastases and morphologic tumour response after RE in that study [12].
A recent preliminary study employing perfusion CT de-scribed the discriminatory power of the parameter of arterial perfusion (AP) of liver metastases for distinguishing patients responding morphologically and having a higher survival with RE than those who did not respond to therapy [13]. However, the authors addressed only perfusion CT and did not include other potentially differentiating parameters and modalities in that study.
The purpose of our study was to determine prospectively, in patients with liver metastases, the best predictor for re-sponse to and survival with RE comparing attenuation mea-surements from arterial and portal venous phase CT, perfusion CT and the accumulation of 99mTc-MAA particles using SPECT.
Material and methods
This prospective study had local ethics committee approval. All patients gave written informed consent.
Study design and patient population
Between November 2010 and June 2012, a total of 58 consecutive patients who planned to undergo treatment planning catheter angiography and subsequent RE be-cause of otherwise therapy-refractory metastatic liver dis-ease were screened for study inclusion (Fig. 1). Follow-up of patients extended to March 2013. Exclusion criteria for CT perfusion included a history of hypersensitivity to iodinated contrast medium (n=0) and nephropathy (esti-mated glomerular filtration rate <30 ml/min, n=2). Thus, perfusion CT was performed in 56 patients (30 males, mean age 64±12 years, range 34–81; 26 females, mean age 62±11 years, range 39– 82).
Of these 56 patients, 16 were excluded from the study since no RE was performed based on the results from treatment planning catheter angiography, including variations in liver artery anatomy [n=9, this included a measured liver-lung shunt of over 20 % (n=2), extrahepatic arterial tumour supply
(n=3), inaccessible hepatic artery, e.g., obliterated truncus coeliacus (n=3) and any liver-intestinal shunt (n=1)] or rap-idly deteriorating health (n=7). Thus, the final study cohort comprised 40 patients (22 males, mean age, 64±11 years, range, 35-81 years; 18 females, mean age 60±12 years, range, 39–79 years, Table 1). All 40 patients underwent CT and treatment planning catheter angiography including the appli-cation of99mTc-MAA and SPECT. Of these 40 patients, 33 (83 %) had multiple metastases in the liver, and 18 (45 %) had extrahepatic metastatic disease.
RE was performed on average 20 days after treatment planning catheter angiography. RE was performed as salvage therapy, and no further treatment was performed within the study period.
Perfusion computed tomography
All patients were examined using a 128-slice dual-source CT system (Somatom Definition Flash, Siemens Healthcare, Forchheim, Germany). The liver contours were identified on the topogram, and an image volume of 14.8 cm in the z-axis was placed to cover the majority of the liver. This z-axis coverage was chosen as a good trade-off between the spatial and temporal resolution, as well as radiation dose [14]. For each patient, 50 ml of iopromide (Ultravist 370, 370 mg iodine/ml, Bayer Schering Pharma, Berlin, Germany) was injected in an antecubital vein at a flow rate of 5 ml/s followed by 50 ml of saline solution at the same flow rate. Five seconds after the contrast material injection, 12 spiral acquisitions covering the liver were obtained in the four-dimensional spiral mode with variable pitch from 0 to 0.75. The 5-s delay was chosen to ensure contrast media-free acquisitions as well as to ensure the arterial peak was included during the scan time [15]. Images were acquired with a 1.5-s examination time within a 3-s cycle time (examination time 35 3-s). Thi3-s examination duration was chosen in order to include both the arterial liver perfusion and peak of splenic perfusion. Additional imaging parameters were: 100-kVp tube voltage, 150-mAs tube current-time product and 128 × 0.6-mm slice collimation using the z-flying focal spot. The estimated effective radiation dose of this protocol was 18 mSv, as calculated by multiplication of the dose-length product with the conversion factor for the abdomen (16 μSv/ mGycm) [16]. Patients were instructed to hold their breath for the entire duration of the examination or to resume shallow breathing if breath holding was no longer possible.
CT perfusion images were reconstructed with a slice thick-ness of 4 mm (increment 3 mm), using a medium smooth tissue convolution kernel (B20f). All images were transferred to an external workstation (Multi-Modality Workplace, Siemens Healthcare) for further analysis.
Treatment planning catheter angiography and MAA application
Treatment planning catheter angiography was performed by one interventional radiologist (18 years of experience in inter-ventional radiology), who first embolised all branches of the common hepatic artery that did not supply the liver. In con-cordance with current recommendations, this was done to prevent misplacement of 90Y-microspheres in non-hepatic parenchyma [17]. Then, 180 MBq of 99mTc-MAA was injected into the hepatic artery or the planned liver lobe/segment respectively, using a microcatheter. To evaluate the presence of liver-lung shunting, the shunt fraction was calculated using planar scintigraphy and SPECT.
99m
Tc-MAA SPECT
Immediately after99mTc-MAA application, SPECT was per-formed on a dual-head gamma camera with an integrated CT scanner (Infinia Hawkeye, GE Healthcare). For shunt
calculation, images for a planar anterior and posterior whole-body scintigraphy were acquired. SPECT imaging was centred on the liver with imaging parameters as follows: peak 140 keV, ±7.5 %, 180°; 3° view angle, matrix 128×128, field of view 40 cm, 30 s per image, m-mode, zoom 1.0 and low-energy high-resolution collimator. Reconstruction was per-formed using the ordered-subsets expectation maximisation algorithm. CT imaging parameters included 140 kV, 25 mAs, matrix 256×256, with a 10-mm slice thickness. Soft-tissue attenuation of the reconstructed99mTc-MAA SPECT images was performed.99mTc-MAA SPECT images were transferred to a workstation with dedicated software (PMOD, version 3.3, PMOD Technologies Ltd., Zurich, Switzerland) installed.
Transarterial radioembolisation
On average 20 days (range, 14–24 days) after treatment plan-ning catheter angiography and99mTc-MAA SPECT, RE was performed using90Y-microspheres (SIR-spheres®, Sirtex Med-ical Ltd., Lane Cove, Australia) by the same interventional
radiologist mentioned above in combination with a nuclear medicine physician (with 5 years of experience in nuclear oncology). The body surface area method [18] was used to calculate the dose applied.90Y-microspheres were administered in one session to the right lobe (n=14), the left lobe (n=8), the whole liver (n=17) or spread over two sessions (n=1). Two sessions at a 2-week interval were deemed necessary because of the increased toxicity from radioembolisation in heavily pretreated patients [19]. The time interval between the two sessions was 2 weeks.
Evaluation of short-term morphologic treatment response
To evaluate the morphologic response of the liver lesions to RE, the change in lesion size between baseline CT images and
morphologic follow-up images was calculated. The last image set acquired during the perfusion CT served as the baseline images. Version 1.1 of the Response Evaluation Criteria in Solid Tumours (RECIST) was used to classify the response in t h e l i v e r [2 0] . C o m m e r c i a l l y a v a i l a b l e s o f t w a r e (mintLesion™, version 2.04, Heidelberg, Germany) was employed to document the measurements. One reader (with 2 years of experience in radiology), who was blinded to the perfusion CT analyses and patients’ survival, measured all lesions in the liver on baseline and follow-up images from the 4-month CT after RE and classified up to two target lesions, while all other lesions were classified as non-target lesions. The total lesion diameter of all liver metastases was calculated and noted as a surrogate for the extension of the liver tumour load. Additionally, the software classified the target response, according to RECIST 1.1, into complete response, partial response, stable disease and progressive dis-ease. We categorised patients with complete and partial re-sponse as responders and patients with stable disease and progressive disease as non-responders, as previously de-scribed [20–22].
Arterial and portal venous phase CT evaluation
From the 12 spiral CT acquisitions of the perfusion CT we individually selected the image acquired 12 s after the contrast in the abdominal aorta exceeded 100 Hounsfield units (HU), representing the late arterial phase of enhancement [23]. This single arterial phase was extracted from the multiphase perfu-sion CT data sets and was presented on an external worksta-tion to two readers (with 3 and 2 years of experience in radiology). Readers were presented with the baseline CT slices with the target lesions delineated and manually drew regions of interest (ROI) of the corresponding lesions and noted the corresponding arterial HU (aHU). If there was more than one target lesion, the mean aHU value of lesions was calculated.
Previously performed, clinically indicated portal venous CTs were available for 14 of the 40 (35 %) patients, performed at a mean time interval of 27 days (range 14–41 days) prior to perfusion CT. Similar to the readout of arterial phase CT images, the baseline CT slices with the target lesions delineat-ed were presentdelineat-ed to the two readers, who manually drew ROIs of the corresponding lesions and noted the correspond-ing portal venous HU values (pvHU). If there was more than one target lesion, the mean pvHU value of lesions was calcu-lated. The time interval between the readout of arterial phase and portal venous phase CT images was 4 weeks to avoid recall bias.
CT perfusion evaluation
Quantitative analysis of CT perfusion data was performed using commercially available software (Syngo Volume
Table 1 Patient demographics Sex
Male 22
Female 18
Mean age ± SD (range) 62±12 (35-81) Diagnosis
Colorectal cancer 20
Adenocarcinoma of the pancreas 4
Breast cancer 4
Adenocarcinoma of the cardia 3 Non-small cell lung cancer 2
Uveal melanoma 2
Renal cell carcinoma 1
Prostate cancer 1
Squamous cell carcinoma of the oesophagous 1 Leiomyosarcoma of the uterus 1 Meningeal haemangiopericytoma 1 Previous treatment
Chemotherapy 33
Liver surgery 10
Radiofrequency ablation 1 Lesions in the liver
Single 6
Multiple 34
Extrahepatic metastases 18 Lobe treated
Whole liver 17
Right liver lobe 14
Left liver lobe 8
Whole liver over two sessions 1
Mean dose applied for RE (GBq) (range) 1.5±0.4 (0.8, 2.8) Mean time for follow-up in days1(range) 115±48 (54-312) 1
Perfusion CT Body, Siemens Healthcare). First, an integrated motion correction algorithm using a non-rigid deformable registration technique for anatomic alignment was applied [24]. Then, a volume of interest (VOI) was drawn around the entire liver, excluding the hepatic hilum and inferior vena cava. The peak arterial and peak portal venous enhancement were measured in regions of interest (ROIs) placed in the abdominal aorta and the portal vein. A region of interest (ROI) was drawn in the spleen for separation of arterial and portal venous phases [25], using the time of maximum en-hancement within the ROI in the spleen. The maximum slope of each voxel time-attenuation curve was determined sepa-rately before and after the separation time point and was divided by the peak arterial and peak portal venous enhance-ment. The calculation of hepatic perfusion parameters was performed according to the method described by Blomley et al. [26] and Tsushima et al. [27], yielding the arterial perfusion (AP) in ml/min/100 ml._
Two other independent readers (having 3 and 5 years of experience in radiology), blinded to the results of short-term treatment response and patient survival, as well as to the results from arterial and portal venous CT, were presented the baseline CT images with the defined target lesions. They then correlated the target lesions to the arterial perfusion images and drew VOIs over the corresponding areas (mean size 40±110 cm3), including the entire lesion while carefully avoiding the inclusion of larger vessels. The individual arterial perfusion values of lesions (in ml/100 ml/min) were noted. If there was more than one target lesion, the mean value of the lesions was calculated.
99mTc-MAA SPECT evaluation
Two independent readers (with one and two years of experi-ence in nuclear imaging), blinded to the results from CT and to patient survival, were presented the baseline CT images with the marked target lesions, retraced the matching lesions man-ually on multiplanar views of the SPECT images and noted the average99mTc-MAA uptake of the resulting VOIs. Addi-tionally, a VOI of defined size (4.5 cm3) was placed in healthy liver tissue and the average99mTc-MAA uptake was noted. The99mTc-MAA uptake ratio of the target lesions was calcu-lated as previously shown [12, 28]: 99mTc-MAA uptake ratio =99mTc-MAA averaged uptake target lesion/99m Tc-MAA averaged uptake normal liver parenchyma. If there was more than one target lesion the mean value of lesions was calculated.
Follow-up
Short-term morphologic treatment response was evaluated on follow-up images 4 months after RE. Morphologic response was evaluated on CT, which was performed either in house
(n=26) or, for patients not resident in proximity to the authors’ institution, in collaboration (n=14) with the primary care physician.
Follow-up imaging could not be obtained in ten patients due to either death before imaging (n=9) or rapidly deterio-rating health (n=1). These patients therefore were not includ-ed in the short-term morphologic response analysis, but were included in the survival analysis (see Fig.1).
Patients were then followed up, and information on patient survival was obtained from medical records or telephone interview up to 1 year after RE.
Statistical analysis
Numeric variables are given as mean ± standard deviation. Categorical variables are expressed as frequencies and per-centages. Interreader agreement was evaluated with the intraclass correlation coefficient (two-way random single measures) [29].
To determine whether there are significant differences be-tween responders and non-responders for the parameters assessed (AP, aHU, pvHU, 99mTc-MAA uptake ratio), the Mann-Whitney U test was used. In addition, receiver-operating characteristic (ROC) curves were plotted for the parameters’ ability to discriminate responders from non-responders and the area under the curve (AUC) was calculat-ed. For parameters showing a significant discriminative pow-er, a cutoff value yielding the same sensitivity was chosen and the corresponding specificities were compared using the McNemar test.
To evaluate survival Kaplan-Meier curves were plotted, and survival between groups was compared with the log-rank test. To determine parameters significantly influencing survival, Cox proportional hazard univariate and bivariate regression analysis was employed. Variables included in the analysis were: the AP, aHU, pvHU,99mTc-MAA uptake ratio, total diameter of all lesions, underlying primary disease, pres-ence of extrahepatic metastatic disease, total number of liver metastases, dose applied and pretreatment with chemotherapy. Commercially available software was used for statistical analyses (IBM SPSS Statistics, release 20.0, SPSS Inc., Chi-cago, IL). Statistical significance was inferred at a P-value below 0.05.
Results
Interreader agreement was high for all parameters (AP: ICC = 0.972, 95 % CI: 0.952-0.983; aHU: ICC = 0.988, 95 % CI: 0.977 0.994; pvHU: 0.965, 95 % CI: 0.877 -0.981; 99mTc-MAA uptake ratio, ICC= 0.825, 95 % CI: 0.657-0.911). Therefore, the values of one reader were taken for further analysis.
Follow-up imaging was available in 30 of the 40 patients (75 %), of whom 19 were classified as non-responders and 11 as responders. Ten patients died prior to follow-up imaging because of progressive metastatic disease.
Prediction of short-term morphologic response
We found significant (P < 0.001) differences between re-sponders and non-rere-sponders for AP with a mean value of 12 ±6 ml/100 ml/min for non-responders and 38 ±15 ml/ 100 ml/min for responders (Fig.2a). There was also a signif-icant (P= 0.001) difference in the aHU with a mean HU number of 52±13 HU for non-responders and 80±24 HU for responders (Fig.2b).There was no significant difference for pvHU values (60 ± 17 HU vs. 82 ± 20 HU, P = 0.07) (Fig.2c) and for the 99mTc-MAA uptake ratio between re-sponders and non-rere-sponders (5.0±2.9 vs. 4.7±5.6, P=0.40) (Fig.2d, Table2). Representative examples of responders and non-responders are shown in Figs.3and4.
ROC analysis revealed significant discriminative power between responders and non-responders for AP (P<0.001)
Table 2 Pretreatment parameters assessed prior to RE
Parameter Non-responder Responder P-value* (n=19) (n=11) Arterial perfusion (ml/100 ml/min) 12±6 38±15 <0.001 HU on arterial phase CT 52±13 80±24 0.001 HU on portal venous phase CT** 60±17 82±20 0.07 99m
Tc-MAA uptake ratio 4.7±5.6 5.0±2.9 0.40 Non-responder according to RECIST 1.1: Stable disease and progressive disease
Responder according to RECIST 1.1: Partial response and complete response
*Mann-Whitney U test **Only where available
Fig. 2 Box plots depicting the arterial perfusion (AP) from perfusion CT (a), arterial enhancement (aHU, b), portal venous enhancement (pvHU, c) and99mTc-MAA uptake ratio determined from SPECT (d), indicating
significantly higher values for AP and aHU for responders as compared to non-responders. No significant differences were found for pvHU and the 99m
with an AUC of 0.971 (95 % CI: 0.918-1.000), as well as for aHU (P=0.001) with an AUC of 0.866 (95 % CI: 0.730-1.000). In contrast, pvHU [AUC=0.796 (95 % CI: 0.562-1.000)] and the 99mTc-MAA uptake ratio [AUC = 0.402 (95 % CI: 0.184-0.620] showed no significant discriminative power (P=0.06 and P =0.38, respectively, Fig.5).
To compare the specificity of the parameters AP and aHU, a cutoff value yielding a sensitivity of 91 % for both param-eters was chosen. This resulted in a cutoff value of >20 ml/ 100 ml/min for AP and >55 HU for aHU to determine re-sponders. The corresponding specificity of 95 % (95 % CI: 75–99 %) for AP was significantly (P=0.003) higher than the specificity of 53 % (95 % CI: 32–73 %) for aHU.
One-year survival
Patients with an AP>0 ml/100 ml/min showed a significantly (P=0.01) higher 1-year survival (71.4±17.1 %, median sur-vival not reached) compared to patients with an AP<0 ml/ 100 ml/min (27.9±9.7 %, median survival 147 days) (Fig.6a). Survival of patients with an aHU>55 HU was not significant-ly different (P=0.12) compared to those with an aHU <55 HU (Fig.6b).
The Cox proportional hazard model revealed a hazard ratio of 0.181 for an AP value>20 ml/100 ml/min for survival
(95 % CI: 0.042-0.786, P=0.02). An aHU >55 HU was not a significant (P=0.64) predictor of survival when adjusted for AP. Similarly, the pvHU,99mTc-MAA uptake ratio, total di-ameter of all lesions, underlying primary disease, presence of extrahepatic metastatic disease, total number of liver metasta-ses, dose applied, and pretreatment with chemotherapy did not improve the prediction of survival (all P>0.05) when AP was included in the model.
Discussion
A number of previous studies exist, which employed multi-phase CT, 99mTc-MAA SPECT and catheter angiography, analysing the potential relationships between imaging features and morphologic tumour response and patient survival after RE of liver metastases [9–12,30]. For example Sato et al. [10] evaluated enhancement patterns of liver metastases on arterial phase CT performed prior to RE, classifying metastases sub-jectively as hyper- or hypovascular. In their study, authors could not find a relationship between vascularity and response to RE. In addition, that study showed that vascularisation was interpreted differently by different readers and concluded that quantitative measures for an objective tumour perfusion
Fig. 3 A 66-year-old female patient with metastases from colorectal cancer in the right liver lobe. The metastasis had an attenuation on portal venous phase CT (pvHU) of 71 HU (a) and on arterial phase CT (aHU) of 49 HU (b). The arterial perfusion of the metastasis was 25 ml/100 ml/min
(c) and the99mTc-MAA uptake ratio was 5.8 (d, e). Morphologic follow-up CT 4 months after RE revealed partial response with a moderate reduction in metastasis size (f)
should be considered as opposed to their subjective, semi-quantitative approach [10].
In our study, measurement of CT attenuation in a single arterial phase (aHU) was significantly different between morphologic responders and non-responders to
RE; however, the specificity was low, and prediction of survival was not possible using the cutoff value from aHU. This can be explained by the fact that a single-phase CT may miss peaks in arterial enhancement of malignancies [31].
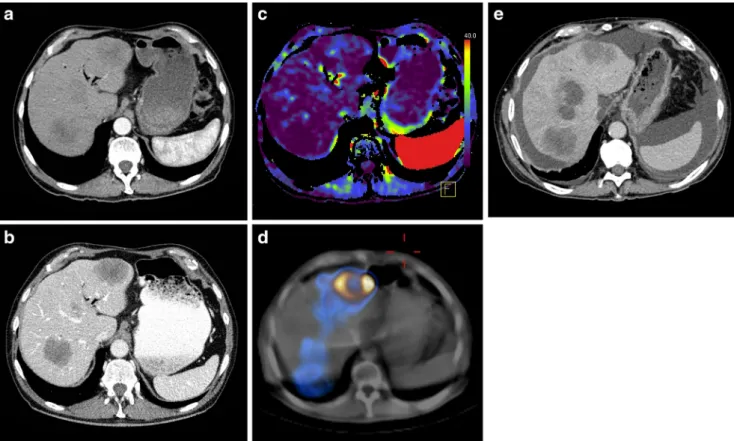
Fig. 4 A 73-year-old male patient with metastases from colorectal cancer in both liver lobes. The metastasis had an attenuation on portal venous phase (pvHU) of 58 HU (a) and on arterial phase CT (aHU) of 48 HU (b).
The arterial perfusion of the metastases was 3 ml/100 ml/min (c) and the 99m
Tc-MAA uptake ratio was 5.2 (d, e). Morphologic follow-up CT 4 months after RE showed progressive disease (f)
Fig. 5 ROC curves for AP, aHU, pvHU and the99mTc-MAA uptake ratio indicating discriminative power for distinguishing responders from non-responders for AP (AUC= 0.971) and aHU (AUC=0.866). In contrast, pvHU (AUC=0.796) and the99mTc-MAA uptake ratio (AUC=0.402) showed no significant AUC
Measurements of portal venous enhancement showed no discriminative power for differentiating between responders and non-responders to RE. A recent study by Tochetto et al. [32] also did not find significant differences in HU values measured in portal venous phase CT between short-term responders and non-responders determined by positron emis-sion tomography. This result can be explained by the fact that portal venous vascularity represents a minor contributor to the vascularity of hepatic metastases, which are predominantly
supplied by hepatic arterial flow [33]. Thus, parameters quan-tifying portal venous attenuation fail to identify responders from non-responders to an arterially guided therapy such as RE.
In our study, the 99mTc-MAA uptake ratio did not differ between responders and non-responders to RE. Our 99m Tc-MAA uptake ratio values with a mean of 5.0 and 4.7 are in line with those from previous studies [34]. The literature currently is contradictory regarding the value of99mTc-MAA scintigra-phy beyond the evaluation of shunting and dose misplacement [1]. A study by Dhabuwala et al. [12] in patients with colo-rectal liver metastases did not find a predictive value for
99m
Tc-MAA uptake regarding morphologic tumour response [12]. Garin et al. [35] calculated the dose deposition based on
99m
Tc-MAA SPECT and the dose applied in patients with hepatocellular carcinoma and found that the dose absorbed by the tumour differed depending on the response to therapy when using the criteria of the European Association for the Study of the Liver [36]. Compared to results from our study, the99mTc-MAA uptake ratio reported by Garin et al. [35] was higher in responders and comparable in non-responders. This indicates differences in the99mTc-MAA uptake in hepatocel-lular carcinoma as compared to liver metastases. Further po-tential reasons for the lack of discriminative power of99m Tc-MAA SPECT might be the lower spatial resolution of the technique, the feature of non-time-resolved imaging of the technique and different pharmacokinetics of the tracer applied as compared to that from iodinated contrast material.
CT perfusion parameters have previously shown a good correlation with tumour vascularity determined histopatholog-ically [37]. Recent studies also demonstrated the ability of CT perfusion to evaluate therapy response to transarterial chemoembolisation of hepatocellular carcinoma [38] and to anti-angiogenic treatment in lung cancer [39]. CT perfusion can be easily integrated into the clinical routine because of the high availability of CT, and results from CT perfusion are known to be reproducible [31,40,41]. In our study, quantifi-cation of arterial perfusion of liver metastases yielded good sensitivity (91 %) and high specificity (95 %) for predicting short-term morphologic response and allowed for the discrim-ination of 1-year survival with RE. In addition, the AP deter-mined by CT perfusion was the best single, independent predictor of survival with RE as compared to multiphase CT and 99mTc-MAA SPECT. This was also true when factors such as the hepatic tumour load and extrahepatic metastatic disease were included. This indicates that RE is indeed an effective treatment method when administered to patients with a high AP irrespective of underlying primary malignancy or extension of hepatic metastatic disease.
Some limitations of our study have to be acknowledged. First, the sample size is relatively small, with heterogeneous underlying malignancy and colorectal metastasis as the main malignancy. However, this did not prove to be a statistically
Fig. 6 Kaplan-Meier plots demonstrating a significantly (P=0.010) higher 1-year survival for patients having a pretreatment AP >20 ml/ 100 ml/min (a). In contrast, patients with an aHU>55 HU on pretreat-ment CT showed no significantly (P=0.123) increased survival (b)
significant influencing factor. Second, we did not confirm the predictive value of our findings in another separate patient population. Therefore, future studies with a larger and more homogeneous patient population should be performed to val-idate our initial results. Third, portal venous CT was only available in a subset of our patients.
In conclusion, our study indicates that the AP of liver metastases determined by perfusion CT is the best predictor of morphologic response and 1-year survival with RE com-pared to the arterial and portal venous CT attenuation and to the accumulation of 99mTc-MAA particles determined by SPECT.
Acknowledgments The scientific guarantor of this publication is Prof. Hatem Alkadhi. The authors of this manuscript declare no relationships with any companies whose products or services may be related to the subject matter of the article. The authors state that this work has not received any funding. Prof. Burkhardt Seifert kindly provided statistical advice for this manuscript. One of the authors has significant statistical expertise. Institutional Review Board approval was obtained. Written informed consent was obtained from all subjects (patients) in this study. Some of the study subjects have been previously reported in“Invest Radiol. 2013 Nov;48(11):787-94. doi:10.1097/RLI.0b013e31829810f7.”
Methodology: prospective, diagnostic or prognostic study, performed at one institution.
References
1. Sato KT, Lewandowski RJ, Mulcahy MF et al (2008) Unresectable chemorefractory liver metastases: radioembolization with 90Y mi-crospheres—safety, efficacy, and survival. Radiology 247:507–515 2. Kennedy AS, McNeillie P, Dezarn WA et al (2009) Treatment
pa-rameters and outcome in 680 treatments of internal radiation with resin 90Y-microspheres for unresectable hepatic tumors. Int J Radiat Oncol Biol Phys 74:1494–1500
3. Seidensticker R, Denecke T, Kraus P et al (2011) Matched-pair comparison of radioembolization plus best supportive care versus best supportive care alone for chemotherapy refractory liver-dominant colorectal metastases. Cardiovasc Intervent Radiol 35: 1066–1073
4. Breedis C, Young G (1954) The blood supply of neoplasms in the liver. Am J Pathol 30:969–977
5. Campbell AM, Bailey IH, Burton MA (2000) Analysis of the distri-bution of intra-arterial microspheres in human liver following hepatic yttrium-90 microsphere therapy. Phys Med Biol 45:1023–1033 6. Kennedy AS, Nutting C, Coldwell D, Gaiser J, Drachenberg C
(2004) Pathologic response and microdosimetry of (90)Y micro-spheres in man: review of four explanted whole livers. Int J Radiat Oncol Biol Phys 60:1552–1563
7. Deleporte A, Flamen P, Hendlisz A (2010) State of the art: radiolabeled microspheres treatment for liver malignancies. Expert Opin Pharmacother 11:579–586
8. Cosimelli M, Mancini R, Carpanese L et al (2012) Integration of radioembolisation into multimodal treatment of liver-dominant met-astatic colorectal cancer. Expert Opin Ther Targets 16:S11–S16 9. Herba MJ, Thirlwell MP (2002) Radioembolization for hepatic
me-tastases. Semin Oncol 29:152–159
10. Sato KT, Omary RA, Takehana C et al (2009) The role of tumor vascularity in predicting survival after yttrium-90 radioembolization for liver metastases. J Vasc Interv Radiol 20:1564–1569
11. Kennedy AS, Coldwell D, Nutting C et al (2006) Resin 90Y-microsphere brachytherapy for unresectable colorectal liver metasta-ses: modern USA experience. Int J Radiat Oncol Biol Phys 65:412– 425
12. Dhabuwala A, Lamerton P, Stubbs RS (2005) Relationship of 99mtechnetium labelled macroaggregated albumin (99mTc-MAA) uptake by colorectal liver metastases to response following selective internal radiation therapy (SIRT). BMC Nucl Med 5:7
13. Morsbach F, Pfammatter T, Reiner CS et al (2013) Computed tomo-graphic perfusion imaging for the prediction of response and survival to transarterial radioembolization of liver metastases. Invest Radiol 48:787–794
14. Brix G, Lechel U, Petersheim M, Krissak R, Fink C (2011) Dynamic contrast-enhanced CT studies: balancing patient exposure and image noise. Invest Radiol 46:64–70
15. Goetti R, Leschka S, Desbiolles L et al (2010) Quantitative computed tomography liver perfusion imaging using dynamic spiral scanning with variable pitch: feasibility and initial results in patients with cancer metastases. Invest Radiol 45:419–426
16. Huda W, Ogden KM, Khorasani MR (2008) Converting dose-length product to effective dose at CT. Radiology 248:995–1003
17. Kennedy A, Nag S, Salem R et al (2007) Recommendations for radioembolization of hepatic malignancies using yttrium-90 micro-sphere brachytherapy: a consensus panel report from the radioembolization brachytherapy oncology consortium. Int J Radiat Oncol Biol Phys 68:13–23
18. Lau WY, Kennedy AS, Kim YH et al (2012) Patient selection and activity planning guide for selective internal radiotherapy with yttrium-90 resin microspheres. Int J Radiat Oncol Biol Phys 82: 401–407
19. Seidensticker R, Seidensticker M, Damm R et al (2012) Hepatic toxicity after radioembolization of the liver using (90)Y-micro-spheres: sequential lobar versus whole liver approach. Cardiovasc Intervent Radiol 35:1109–1118
20. Eisenhauer EA, Therasse P, Bogaerts J et al (2009) New response evaluation criteria in solid tumours: revised RECIST guideline (ver-sion 1.1). Eur J Cancer 45:228–247
21. Islam R, Chyou PH, Burmester JK (2013) Modeling efficacy of bevacizumab treatment for metastatic colon cancer. J Cancer 4: 330–335
22. Nace GW, Steel JL, Amesur N et al (2011) Yttrium-90 radioembolization for colorectal cancer liver metastases: a single institution experience. Int J Surg Oncol 2011:571261
23. Marin D, Nelson RC, Samei E et al (2009) Hypervascular liver tumors: low tube voltage, high tube current multidetector CT during late hepatic arterial phase for detection–initial clinical experience. Radiology 251:771–779
24. Saddi KA, Chefd'hotel C, Cheriet F (2007) Large deformation regis-tration of contrast-enhanced images with volume-preserving con-straint. Proc Spie, 6512
25. Miles KA, Hayball MP, Dixon AK (1993) Functional images of hepatic perfusion obtained with dynamic CT. Radiology 188:405– 411
26. Blomley MJ, Coulden R, Dawson P et al (1995) Liver perfusion studied with ultrafast CT. J Comput Assist Tomogr 19:424–433 27. Tsushima Y, Funabasama S, Aoki J, Sanada S, Endo K (2004)
Quantitative perfusion map of malignant liver tumors, created from dynamic computed tomography data. Acad Radiol 11:215–223 28. Flamen P, Vanderlinden B, Delatte P et al (2008) Multimodality
imaging can predict the metabolic response of unresectable colorectal liver metastases to radioembolization therapy with yttrium-90 labeled resin microspheres. Phys Med Biol 53:6591–6603
29. Shrout PE, Fleiss JL (1979) Intraclass correlations: uses in assessing rater reliability. Psychol Bull 86:420–428
30. Ulrich G, Dudeck O, Furth C et al (2013) Predictive value of intratumoral 99mTc-macroaggregated albumin uptake in patients
with colorectal liver metastases scheduled for radioembolization with 90Y-microspheres. J Nucl Med 54:516–522
31. Pandharipande PV, Krinsky GA, Rusinek H, Lee VS (2005) Perfusion imaging of the liver: current challenges and future goals. Radiology 234:661–673
32. Tochetto SM, Rezai P, Rezvani M et al (2010) Does multidetector CT attenuation change in colon cancer liver metastases treated with 90Y help predict metabolic activity at FDG PET? Radiology 255:164–172 33. Lien WM, Ackerman NB (1970) The blood supply of experimental liver metastases. II. A microcirculatory study of the normal and tumor vessels of the liver with the use of perfused silicone rubber. Surgery 68:334–340
34. Ho S, Lau WY, Leung TW et al (1997) Tumour-to-normal uptake ratio of 90Y microspheres in hepatic cancer assessed with 99Tcm macroaggregated albumin. Br J Radiol 70:823–828
35. Garin E, Lenoir L, Rolland Y et al (2012) Dosimetry based on 99mTc-macroaggregated albumin SPECT/CT accurately predicts tu-mor response and survival in hepatocellular carcinoma patients treat-ed with 90Y-loadtreat-ed glass microspheres: preliminary results. J Nucl Med 53:255–263
36. Forner A, Ayuso C, Varela M et al (2009) Evaluation of tumor response after locoregional therapies in hepatocellular carcinoma:
are response evaluation criteria in solid tumors reliable? Cancer 115:616–623
37. Spira D, Neumeister H, Spira SM et al (2013) Assessment of tumor vascularity in lung cancer using volume perfusion CT (VPCT) with histopathologic comparison: a further step toward an individualized tumor characterization. J Comput Assist Tomogr 37:15–21 38. Yang L, Zhang XM, Zhou XP et al (2010) Correlation between
tumor perfusion and lipiodol deposition in hepatocellular car-cinoma after transarterial chemoembolization. J Vasc Interv Radiol 21:1841–1846
39. Tacelli N, Santangelo T, Scherpereel A et al (2013) Perfusion CT allows prediction of therapy response in non-small cell lung cancer treated with conventional and anti-angiogenic chemotherapy. Eur Radiol 23:2127–2136
40. Bellomi M, Petralia G, Sonzogni A, Zampino MG, Rocca A (2007) CT perfusion for the monitoring of neoadjuvant chemotherapy and radiation therapy in rectal carcinoma: initial experience. Radiology 244:486–493
41. Goh V, Halligan S, Daley F, Wellsted DM, Guenther T, Bartram CI (2008) Colorectal tumor vascularity: quantitative assessment with multidetector CT–do tumor perfusion measurements reflect angio-genesis? Radiology 249:510–517