HAL Id: tel-01404852
https://tel.archives-ouvertes.fr/tel-01404852
Submitted on 29 Nov 2016HAL is a multi-disciplinary open access archive for the deposit and dissemination of sci-entific research documents, whether they are pub-lished or not. The documents may come from teaching and research institutions in France or abroad, or from public or private research centers.
L’archive ouverte pluridisciplinaire HAL, est destinée au dépôt et à la diffusion de documents scientifiques de niveau recherche, publiés ou non, émanant des établissements d’enseignement et de recherche français ou étrangers, des laboratoires publics ou privés.
Exploring the Microvine developmental and
physiological adaptation mechanisms to elevated
temperature : characterization of the impact on carbon
balance and its involvement in early reproductive
development failure
Nathalie Luchaire
To cite this version:
Nathalie Luchaire. Exploring the Microvine developmental and physiological adaptation mechanisms to elevated temperature : characterization of the impact on carbon balance and its involvement in early reproductive development failure. Agricultural sciences. Montpellier SupAgro, 2015. English. �NNT : 2015NSAM0011�. �tel-01404852�
Délivré par le
Centre International dEtudes Supérieures en
Sciences Agronomiques
Montpellier
Préparée au sein de lécole doctorale SIBAGHE
Et des unités de recherche AGAP et LEPSE
Spécialité : Biologie Intégrative des Plantes
Présentée par Nathalie Luchaire
Directeur de thèse : Laurent Torregrosa Co-encadrant : Anne Pellegrino
Co-encadrant : Bertrand Muller
Soutenue le 28 Juillet 2015 devant le jury composé de :
Mr Serge Delrot, Professeur, Université de Bordeaux Rapporteur
Mr Michel Génard, Directeur de recherche, INRA Avignon Rapporteur Mr Jean-Luc Regnard, Professeur, Montpellier SupAgro Examinateur
Mr Vivian Zufferey, Chercheur senior, Agroscope, Suisse Examinateur
Mr Laurent Torregrosa, Professeur, Montpellier SupAgro Directeur de thèse Mme Anne Pellegrino, Maitre de conférences, SupAgro Co-encadrante
Réponses développementales et physiologiques de la
Microvigne aux températures élevées : caractérisation de
leffet sur le bilan carboné et son implication dans
lavortement précoce des organes reproducteurs.
Délivré par le
Centre International dEtudes Supérieures en Sciences
Agronomiques
Montpellier
Préparée au sein de lécole doctorale SIBAGHE
Et des unités de recherche AGAP et LEPSE
Spécialité : Biologie Intégrative des Plantes
Présentée par Nathalie Luchaire
Directeur de thèse : Laurent Torregrosa Co-encadrant : Anne Pellegrino
Co-encadrant : Bertrand Muller
Soutenue le 28 Juillet 2015 devant le jury composé de :
Mr Serge Delrot, Professeur, Université de Bordeaux Rapporteur
Mr Michel Génard, Directeur de recherche, INRA Avignon Rapporteur Mr Jean-Luc Regnard, Professeur, Montpellier SupAgro Examinateur
Mr Vivian Zufferey, Chercheur senior, Agroscope, Suisse Examinateur
Mr Laurent Torregrosa, Professeur, Montpellier SupAgro Directeur de thèse Mme Anne Pellegrino, Maitre de conférences, SupAgro Co-encadrante
Réponses développementales et physiologiques de la Microvigne
aux températures élevées : caractérisation de leffet sur le bilan
carboné et son implication dans lavortement précoce des organes
AGAP
Amélioration Génétique et Adaptation des Plantes méditerranéennes et tropicales
UMR 1334 / Montpellier SupAgro Bâtiment 21 2, place Viala 34060 Montpellier cedex 2 FRANCE Et
LEPSE
Laboratoire dEcophysiologie des Plantes sous Stress Environnementaux
UMR 759 / Montpellier SupAgro
IBIP Institut de Biologie Intégrative des Plantes Bâtiment 7
2, place Viala 34060 Montpellier cedex 2
filière viticole. Laugmentation des températures impacte négativement certaines phases clés du développement reproducteur en induisant notamment des phénomènes de coulure ou de pertes précoces dinflorescences. Laltération du bilan carboné pourrait être un facteur majeur des diminutions de rendement en réponse aux températures élevées et lévaluation de cette hypothèse permettrait dajuster les pratiques pour limiter les effets du réchauffement climatique. Si limplication du bilan de carbone chez les plantes annuelles semble être à la base des baisses de rendement observées ces dernières années, les choses sont beaucoup moins claires chez des pérennes comme la vigne du fait des très nombreux co-facteurs possibles ainsi que de la difficulté à expérimenter dans des conditions totalement contrôlées. Afin de saffranchir de ces contraintes, notre étude a été réalisée en conditions contrôlées sur la Microvigne, un mutant naturel insensible à lacide gibbérellique et un nouveau modèle détude pour la génétique et la physiologie de la vigne. Ce mutant présente un phénotype nain et une floraison et fructification continues le long de laxe proleptique. Lapproche utilisée dans cette étude a consisté à (i) développer un cadre danalyse adapté à la Microvigne; (ii) décrire limpact de lélévation de la température, sur les développements végétatif et reproducteur de la vigne, et plus particulièrement lavortement des stades précoces du développement reproducteur; (iii) caractériser les changements du bilan de carbone de la Microvigne induits par la contrainte thermique, et enfin (iv) évaluer limplication potentielle du bilan de carbone dans les phénomènes davortement précoces en réponse au stress thermique. Ce travail a permis de mettre en évidence des phénomènes davortement complet dinflorescences en réponse à lélévation des températures. Par ailleurs, nous avons pu montrer un rôle du statut carboné dans ce phénomène, soit via les teneurs totales en carbohydrates, soit via létat global des réserves à léchelle de la plante. Ce travail montre les potentialités du modèle Microvigne et ouvre de nouvelles perspectives pour lanalyse des effets des contraintes abiotiques sur le développement végétatif et reproducteur de la vigne.
Mots clés
Contrainte thermique, développements végétatif et reproducteur, photosynthèse, bilan de carbone, Microvigne
common hypothesis is that long-term elevated temperatures may cause the failure of key phases of reproductive development, through their negative impact on carbon balance. However, testing the specific role of plant carbon status on yield elaboration under elevated temperatures is difficult on perennial crops, such as grapevine, and when environment fluctuates. To overcome these difficulties, the present work was conducted under fully controlled environment using a natural, gibberellic acid insensitive mutant of grapevine called Microvine, as a new model for grapevine genetics and physiological studies. This mutant present a dwarf stature and lack of juvenile characteristics leading to the continuous flowering and fruiting even during the first year after sowing. The present study aimed at (i) developing a framework of analysis for Microvine; (ii) describing vegetative and reproductive developments responses to temperature elevation at whole plant level, and more precisely on early reproductive development abortions; (iii) characterizing grapevine carbon balance responses to temperature; and finally (iv) evaluating carbon balance implication in temperature-dependent abortions during early reproductive development. This work shows that complete inflorescence abortion observed in response to temperature can be related to carbon status, either expressed though total carbohydrate, or through the level of reserves at the whole plant level. This study opens the way to use Microvine as model to address the impact of climate warming on grapevine vegetative and reproductive developments.
Keywords
toutes les personnes qui y ont contribué chacun à leur échelle et sans qui ce travail et ces quatre années nauraient pas ressemblé à ce quils sont aujourdhui.
Je tiens tout dabord à remercier mes encadrants. Laurent mon directeur DAVEM, Anne et Bertrand mes co-encadrants LEPSiens. Merci de mavoir fait confiance pendant quatre ans et de mavoir donné la chance de travailler au sein de vos deux unités. Merci à vous pour votre implication dans le sprint final de la rédaction. Merci à Anne de mavoir donné les clefs de la Microvigne. Un grand merci pour les heures de dépatouillage du monceau de données déchanges gazeux ; en y repensant nous avons presque passé autant de temps à traiter ces mesures quà les réaliser. Merci à Bertrand pour tout, tes solutions aux problèmes, ton il avisé sur mes données métabolomiques et ton expertise sur le bilan de carbone. Merci de mavoir encouragée à ne pas me cantonner à la vigne et à mouvrir aux autres espèces. Enfin, merci à Laurent pour son encadrement malgré la distance (300 mètres au bas mot), tu as toujours suivi de près mes expérimentations, été très réactif quand javais besoin de ton expertise et su mencourager dans mes choix. Vous avez tous les trois été très complémentaires au cours de ces quatre années et je vous en remercie.
Je tiens également à remercier tout particulièrement Olivier, merci de mavoir guidée dans le traitement des données spatiales et temporelles. Merci pour la plus-value qua donnée ton expertise à notre premier papier. Enfin, merci pour lenthousiasme que tu as toujours montré à la vue de mes données, toutes nos réunions étaient débordantes de nouvelles idées.
Je remercie ensuite lintégralité de léquipe SPIC. Myriam, merci pour ton aide plus que précieuse pour la manipulation de tous tes appareils déchanges gazeux. Merci pour les dépannages du dimanche matin 7h00, tu mas sauvée tellement de fois. Je remercie également Gaëlle qui ma prêté ses paillasses, et qui a supporté lambiance musicale qui régnait dans son labo pendant les périodes de broyage. Je te remercie également pour ta participation à toutes mes récoltes et phénotypage. Merci également à Crispulo pour tous les coups de mains pour les notations, phénotypages et autres récolte. Je tiens tout particulièrement à remercier tous les nénés sans lesquels aucune expérimentation, aucune récolte, aucun dosage naurait été possible. Jai limpression de vous avoir torturé pendant 4 ans avec toutes mes mesures, tous les broyages, aliquotages sans parler de limagerie Je vous dois dimmenses remerciements, voire des excuses pour avoir tout vu en grand avec la Microvigne. Merci Erwann pour toutes les heures que tu as passé sur mes échantillons et mes images, cest sans aucun doute toi qui en aura passé le plus. Je te remercie même pour les heures passées à écouter FIP, je rigole encore en repensant à la reprise des Beatles avec des samples de cris danimaux. Jadresse ici un immense merci à Alex pour son implication dans toutes mes manips. Merci pour le spyralex (méthode de palissage brevetée), et surtout merci pour les chambres dassimilations ; cest toi qui a conçu et construit mon jouet préféré. Merci pour tout le temps que tu as passé à les surveiller à distance, et tous le temps que tu as passé sur larticle, tu es une machine néné. Enfin, merci à Denis et Christine pour leurs conseils scientifiques toujours bienvenus lorsque jétais la seule à présenter des données Microvignes dans une équipe majoritairement Arabido. Je tiens particulièrement à remercier Christine, qui a su être une chef et une amie, et qui ma agrandi mon vocabulaire spécial mots fléchés. Merci pour ton écoute.
Je remercie également tous les membres de léquipe ETAP, qui mont accueilli durant cette dernière année de thèse. Merci à Thierry, Éric et Angélique pour leurs conseils et leur expertise. Je remercie
Merci également à tous les autres membres du LEPSE qui par leur conseils, leur expertise et leur présence ont contribué de près ou de loin laboutissement de ce travail. Je pense tout particulièrement à Stéphane et a Ben pour leur aide sur les expérimentations. Merci à toi Ben pour tous les dépannages des chambres E, je te dois un paquet de Chuppa Chups pour toutes les fois où tu as trouvé des solutions à mes problèmes.
Je tiens également à remercier toute léquipe DAVEM. Vous avez été tellement nombreux à participer aux phénotypages et aux récoltes, merci à vous tous : Cléa, Fréderico, Angélique, Catherine, Valérie, Irène et Marc. Je tiens particulièrement à remercier Markus et Ratthaphon, les deux autres thésards DURAVITIS, avec qui jai partagé beaucoup dexpérimentations. Merci également à Charles et Patrice pour les discussions scientifiques quont suscité lorganisation dexpérimentations communes et le traitement parallèle des données entre le LEPSE et DAVEM. Enfin un grand merci à Gilbert, merci davoir produit et élevé toutes mes Microvignes. Merci pour ton aide et pour ta bonne humeur contagieuse.
Je remercie également les membres de la plateforme métabolomique de Bordeaux qui mont accueilli à plusieurs reprises. Merci Yves de mavoir offert cette opportunité, merci pour tes conseils et ta curiosité vis-à-vis de la Microvigne. Merci à Patricia et Camille, votre bonne humeur ma toujours fait oublier la distance avec Montpellier. Merci à Lucie pour les petits diners entre filles, tu étais la bouffée daccent biterrois qui ensoleillait mes missions bordelaises. Enfin, un grand merci à Dûyen, tu mas toujours tellement aidée avec les robots, avec toi les séances de cappage/décappage de 2000 tubes à la main étaient presquun plaisir.
Je remercie également les nombreux membres de mes comités de thèses : Serge Hamon, Alain Rival, Nathalie Vaillant, Olivier Turc, Eric Lebon, Denis Vile et Charles Romieu. Merci pour tous vos conseils qui ont orienté ma thèse. Merci tout particulièrement à Nathalie qui ma prêté la pince conifère si précieuse pour les mesures déchange gazeux dinflorescences.
Je me dois également de remercier mes stagiaires, José, Maelle et Jeremy. Vous avez été dune très grande aide dans ma thèse. Vous mavez également appris les joies de lencadrement, et Maelle tu mas appris à perdre à la crapette. Jai partagé avec vous des heures et des heures de mesures déchanges gazeux tout organes confondus, et je maintiens que Maelle tu aurais dû me laisser gagner une fois au moins au cours des 100 heures que nous avons passé à attendre que les enregistrement se fassent pour pouvoir pincer une autre feuille. Jeremy, ton stage a été un peu particulier de par la période dans laquelle il sest inscrit, mais je nen garde que des bons souvenirs. Tu as su être une machine comme ta prédécesseuse malgré la singularité de ton stage.
Enfin, jen arrive aux remerciements qui sont finalement les plus durs à écrire, de peur doublier des gens, mais aussi de ne pas remercier assez tous ceux qui ont été là pour moi pendant ces quatre années. Merci à tous les permanents et non-permanents avec qui jai partagé des pauses, des parties de tarot, de kojovos, des soirées plages et des lazergames : Llorenç, Sébastien, Santiago, Sebastia, Pauline, Aude, Romain, Guilhem, Paul, Bea, Garance, Maeva, Vincent, Cloé, Yoran, Thomas, Maryline, Justine et bien sûr Antonin, partenaire de DelirPic. Merci, Jo, Nico et Vincent, pour les dépannages informatiques (parce que je suis un boulet) et surtout pour votre humour et votre bonne humeur lors des pauses. Je remercie à nouveau les nénés. Erwann, merci pour Trombone Shorty, Tony merci pour les café/doliprane et les Gypsy. Et Alex encore merci pour tout, ta gentillesse, ta patience et surtout pour le moral que tu as toujours su me remonter. Merci à ceux qui me supportent au quotidien dans le
licornes... Enfin un immense merci aux copines : Diane, Anaëlle, Emilie et Aude. Merci pour votre soutien au quotidien, pour tous vos délires aussi et pour votre amitié surtout. Merci à Diane et Anaëlle pour tous nos craquages, nos sorties et nos conversation WhatsApp sans queue ni tête. Merci à Emilie, le Dj de toutes mes soirées rédactions, test TOP! (ou taupe, je sais plus trop bien...). Enfin, merci à Aude, avec qui je partage mon bureau depuis 3 années déjà. Je nai pas assez de mots pour te dire merci. Tu es le rayon de soleil de notre bureau, jai adoré nos craquages sucrés de fin de journée, nos séances de chant en mode yaourt du vendredi soir. Merci surtout pour les combos En fait, cest toi le grand marabout, et moi le bout de ficelle (nombres de pages à lappui). ;)
Enfin, mes derniers remerciements vont à ma famille, plus proche que jamais. Merci de mavoir soutenue et supportée pendant quatre ans, 27 ans en fait Pour vous aussi cette thèse a été une grande épreuve, je suis tellement heureuse que vous layez aussi bien réussie. Mes derniers mots iront à mes parents, merci pour tout, merci dêtre toujours là
General introduction 1
I. Grapevine and climate change 3
I.1. Grapevine economic trends 3
I.2. Climate change 3
I.3. First observations and expectations of climate change impact on Grapevine 3
II. Yield and elevated temperature 5
II.1. Yield definition in grapevine 5
(i) Grapevine reproductive development description (ii) Yield components
(iii) Quality aside
II.2. Elevated temperature effect on crop yield 7
II.3. Elevated temperature effect on grapevine yield 8 (i) During the first year
(ii) During the second year: budburst
(iii) During the second year: flowering and fruit set (iv) During the second year: first phase of berry growth (v) During the second year: berry maturing
III. Carbon balance and elevated temperature 13
III.1. Elevated temperature effect on carbon acquisition 13 (i) Temperature effect on Photosynthesis
(ii) Temperature acclimation
III.2. Elevated temperature effect on carbon use 15
(i) Temperature effect on Respiration (ii) Temperature effect on Photo-Respiration (iii) Temperature effect on organ production (iv) Temperature effect on organ expansion (v) Temperature effect on biomass accumulation (vi) Temperature effect on reserves dynamics
III.3. Elevated temperature effect on carbon balance 19 (i) Carbon balance definition
(ii) Existing models?
(iii) Temperature effect on Carbon Balance
IV. Working hypothesis: temperature effects on fruit set are related
to carbon balance and dynamics? 21
V. The Microvine: a new model to address scientific issues on the
grapevine response to temperature? 23
V.1. Wild type grapevine limitations 25
V.2. Creation and genetic description of Microvine 25
V.3. Phenotype description 27
V.4. Gibberellic acids in grapevine 27
(i) Synthesis and signalization pathway (ii) Implication in development
(iii) Implication in response to biotic and abiotic stresses (iv) What about Microvine?
V.5. Other dwarf model plants 31
VI. Working plan 33
General material and method 37
I. Plant material 39
II. Climatic conditions 39
III. Plant measurements global chart 41
IV. Statistical analysis 45
References 47
Chapter 1: Microvine, a new model for exploring grapevine response to
climate warming 60
Abstract Keywords
I. Introduction 67
I.1. Materials and methods 71
I.2. Plant material and growing conditions 71
I.3. Temporal reproductive and vegetative variables measurements 71 I.4. Spatial reproductive and vegetative variables measurements 71
I.5. Biochemical analyses 73
I.6. Calculations of leaf area, internode and berry volume, phyllochron and
spatio-temporal conversion 73
I.7. Statistical analysis 75
II. Results 77
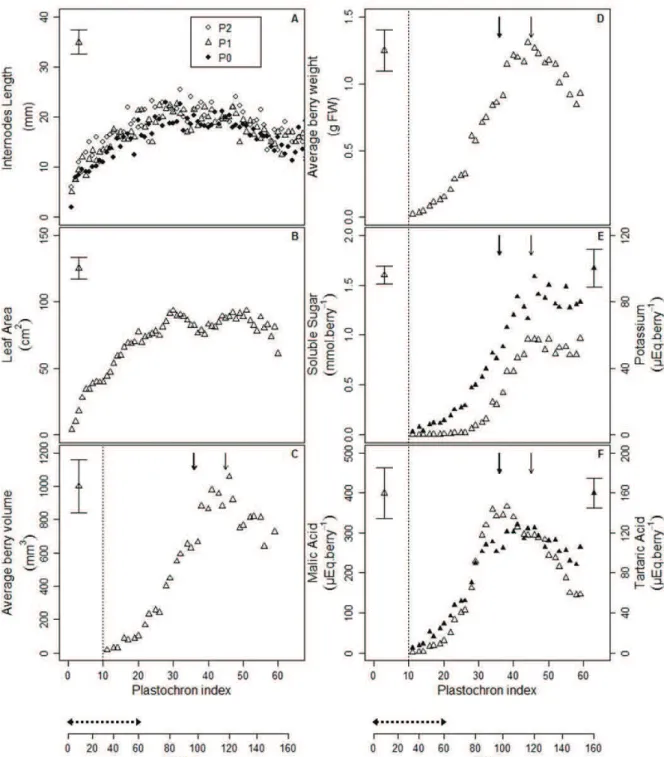
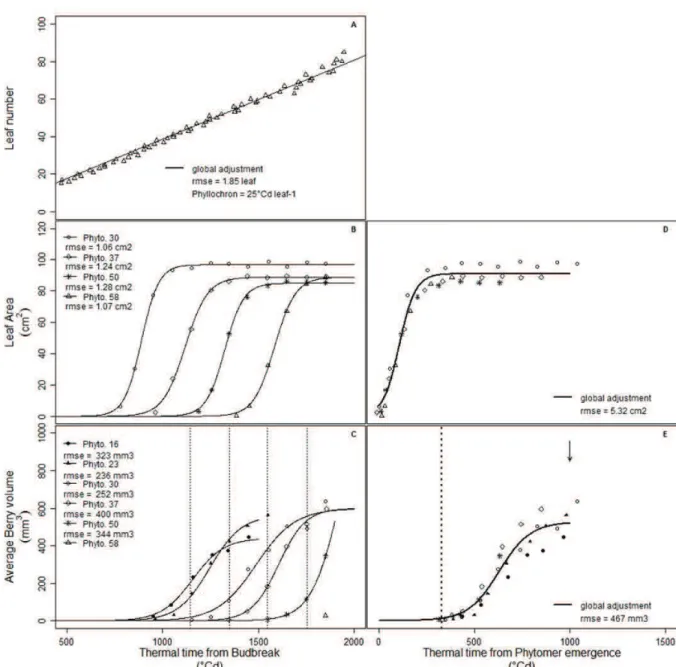
II.1. Microvine spatial patterns mimic grapevine dynamic patterns for
vegetative and reproductive developments and berry metabolite accumulation 77 II.2. The temporal changes in berry and leaf sizes were conserved among
phytomers 79
II.3. The spatial changes in berry, leaf and internode sizes were stable over time 79 II.4. The temporal leaf and berry developments patterns were accurately inferred
from spatial profiles along the axis 81
II.5. Elevated temperature uncoupled biomass from volumetric growth, cut
down starch storage in internodes and delayed ripening 81
III.1. Microvine, a model that resembles grapevine 83 III.2. Microvine, a grapevine model with continuous and regular vegetative and
reproductive development 85
III.3. Microvine, a grapevine model with a few limitations 85 III.4. Microvine, a model for addressing grapevine responses to abiotic stresses 87
IV. Conclusion 91
V. Acknowledgements 91
VI. References 93
Chapter 2: Microvine developmental and metabolic responses to elevated
temperature 109
I. Introduction 111
II. Materials and Method 115
II.1. Plant material and growing conditions 115
II.2. Development and growth measurements at the plant level 117 II.2. Development and growth measurements at phytomer levels 117
II.3. Biochemical analyses 119
II.4. Calculations of inflorescence abortion rates 119
II.5. Statistical analysis 121
III. Results 123
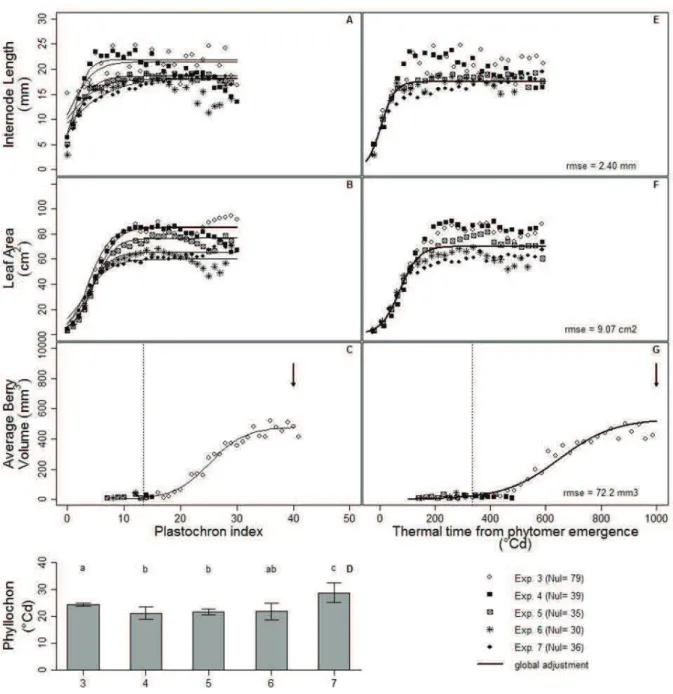
III.1. The rate of vegetative development was neither affected by years nor by
temperature, in contrast with reproductive development 123 III.2. Spatial profiles of organ size, biomass and TNC concentration were
altered by temperature 123
III.3. Fruitfulness was lower under elevated temperatures, due to
inflorescences abortions 129
III.4. Plants were different at the onset of the experiments in 2011 and 2013 131
III.5. Day vs. Night temperature 131
IV. Discussion 131
IV.1. Vegetative development is stable under elevated temperatures, but
reproductive development is delayed 131
IV.2. Elevated temperatures fasten and increase leaf and internode expansion,
but not berry growth 133
IV.3. Inflorescence abortion present 2 different profiles from the two years of
experiments 137
IV.4. 2011, vigorous plants, late abortion: possible explanations 139 IV.5. 2013, low vigor plants, early abortion: possible explanations 141 IV.6. Different insights from 2011 or 2013 experiments 143
V. Conclusion 145
VI. Acknowledgments 145
Chapter 3: Réponses du bilan carboné de la Microvigne à la température 157
I. Introduction 159
II. Matériel & Méthode 165
II.1. Matériel végétal 165
II.2. Conditions climatiques 167
II.3. Mesures déchanges gazeux 167
(i) Mesures déchanges gazeux des feuilles
(ii) Mesures déchanges gazeux des organes reproducteurs (iii) Mesures déchanges gazeux des plantes entières
II.4. Calculs des surfaces foliaires et des volumes dinflorescences 171 II.5. Modélisation de la réponse des échanges gazeux à la température aux échelles
organe et plante entière 171
(i) Courbes enveloppes de Amax et Rmax à léchelle organe en
fonction de la température
(ii) Analyse de covariance des résidus relatifs de An et R par rapport à Amax et Rmax à léchelle organe
(iii) (iii)Test de la qualité des estimations de An et R aux échelles organe et plante entière
II.6. Modélisation du bilan du carbone à léchelle plante entière 175 (i) Formalismes de simulation des BC aérien ou total (BCa ou BCtot)
(ii) Quantité de sucres non structuraux accumulés (Exp. 1 à 2 & 6 à 8) (iii) Simulation du BCa pour une plante fictive soumise à différents
traitements thermiques
II.7. Analyses statistiques 181
III. Résultats 183
III.1. Réponses des échanges gazeux à la température et à la charge en fruit à
léchelle de lorgane 183
III.2. Réponses des échanges gazeux à la température et à la charge en fruit à
léchelle de la plante entière 187
III.3. Simulation et évaluation des échanges gazeux aux échelles organe et plante
entière pour les expérimentations 189
III.4. Simulations et évaluation des bilans carbonés aérien et total pour les
expérimentations 193
III.5. Simulation du bilan carboné aérien pour des plantes fictives soumises à
un gradient de température et différents niveaux de charge en fruit 197
IV. Discussion 203
IV.1. Lélévation de la température à court terme réduit le BCa de la
Microvigne via la diminution du gain de carbone net des organes aériens (DCAn-R) 203 IV.2. A long terme, lacclimatation aux températures élevées atténue les diminutions du BCa, malgré laugmentation de BMa, en favorisant le gain de carbone net des organes aériens
(DCAn-R) 205
IV.3. Les diminutions de la charge en fruit favorisent le gain de carbone net des organes
IV.4. Des différences de BCa et daccumulations de sucres TNC marquées entre
les années : quels rôles des états initiaux de développement aérien et racinaires? 211
V. Conclusion 215
VI. Références 217
Discussion générale 227
I. Quel est le lien entre BC, température et avortement des
inflorescences? 229
I.1. Deux contextes différents davortement ont été mis en évidence 229 I.2. 2011, un avortement tardif synchrone avec la véraison des baies malgré
des teneurs en sucres importantes et un BC favorable 229 I.3. 2013, un avortement précoce lié aux faibles réserves des plantes et
contrebalancé par des températures froides 235
II. La Microvigne était-elle un modèle adapté à cette analyse ? 237
Conclusion et perspectives 245
Références 253
Appendix 1 : Chapter 2 supplementary data 259
Appendix 2 : Figures supplémentaires du chapitre 3 271
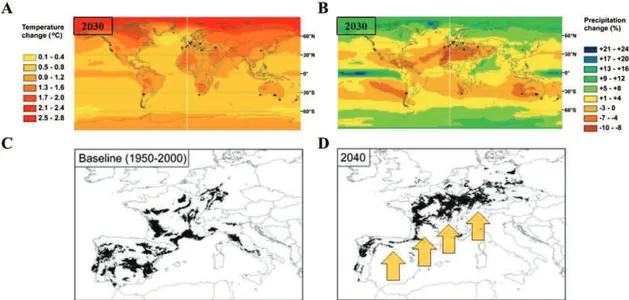
Figure 1: Climate change impact on winegrowing region. World projected temperature (A) and precipitation
change (B) from the baseline (1980-1999) (adapted from Webb et al., 2013). Dots represent main winegrowing regions. Grapevine cultivated areas of the Mediterranean basin for the 1950-2000 baseline (C) and for the future climatic scenario of 2040 (D) (adapted from Moriondo et al., 2013). Arrows represent the possible general shift in winegrowing areas.
I. Grapevine and climate change
I.1. Grapevine economic facts
Cultivated grapevine (Vitis vinifera L.), is one of is one of the most important perennial crops in terms of cultivated surface and economic weight (FAOSTAT). It represented 6.9 106 cultivated hectares in the world in 2012, for 264 106 hectoliter of wine produced. In 2012, France was the first wine producer with 42 106 hectoliter produced, over 0.75 106 hectares cultivated. The Languedoc Roussillon region represents one third of France production, with 14 million of hectoliters produced over 0.250 106 hectares. In 2012, world wine sales generated 180 109 , with 7.6 109 of export for France (FranceAgriMer), representing a large part of the French commercial balance. In view of such a huge economical importance, vine growing sustainability in front of the current context of climate change is a critical question.
I.2. Climate change
Climate change can be defined through 3 major components. First, a global warming, resulting on an increase of air temperature of 0.5 °C during the past 50 years, and an expected increase of 0.5 to 2°C in the next 50 years (Parry 2007). This temperature increase should vary spatially across the globe (fig. 1A). Indeed, Northern hemisphere, where the majority of winegrowing regions are located, is projected to warm faster than southern hemisphere. Second, an increase of CO2 ambient air concentration, from 360 ppm in 1995 to 400 ppm in 2014, and expectation around 700ppm in 2100 (IPCC 2007). Third, an alteration of water availability for agriculture, with changes in precipitation, ranging from -10 % to +25 % across the globe (fig. 1B). Many vine growing regions as the Mediterranean basin are likely to face increasing drought episodes, with dryer growing season but also higher variability within and between years (Lobell and Asner 2003). Such modifications of climatic conditions can dramatically alter plant growth and production (Hannah et al., 2013).
I.3. First observations and expectations of climate change impact on grapevine
Retrospective analysis of climate change impact on global crop production shows modifications ranging from -18.9 to +1.8 Million of tons per year during the past 2 decades (Lobell and Field 2007). The same trends are observed for grapevine in some areas, with for instance a 25 % reduction of production in tons in the last decade in Coonawarra, Australia (Dunn 2005). These decreases are linked with season shortening (Chuine et al. 2004) and associated with quality alteration of grapes and wines (Mira de Orduña 2010). Prediction models have been constructed in order to predict the impact of climate change on viticulture (Jones et al. 2005; White et al. 2006; Hannah, Roehrdanz, et al. 2013). These models reveal that current wine producing regions are going to be dramatically exposed, with area restriction and severe quality alteration. Indeed, Mediterranean vine growing regions are predicted to be shifted to higher latitudes considering their future climate (Fig. 1C and 1D).
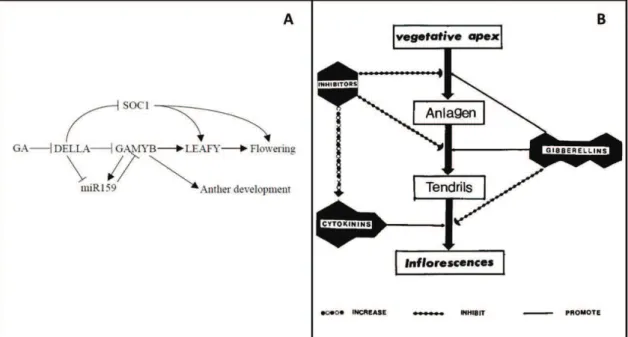
Figure 2: Grapevine reproductive development description. (A) Induction and initiation of inflorescence occurs
during the first season of development (adapted from Srinivasan and Mullins, 1981 and Carmona et al., 2007). Lateral meristem (LR) is obtained on side position of vegetative apical meristem (SAM) and on opposite position to leaf primordium (LP) and axillary meristem (AXM). This anlage is then transformed into tendril primordium. Then this tendril primordium can be converted into inflorescence primordium thanks to cytokinin supply. This conversion occurs only in the first basal tendrils primordia of the latent bud, other tendrils primordia conversion are inhibited by gibberellin signaling. After inflorescence initiation, bract division begins, giving rise to inflorescence branch primordia. After one to three inflorescence initiation, latent bud inter into dormancy. (B) During the second season of development, inflorescences finish their development, flowers are formed, then flowering, fruit formation and ripening occurs (adapted from Srinivasan and Mullins, 1981; Coombe, 1995 and May, 2000). Approximately one week before budburst, inflorescence may develop other branching, but most of their meristems directly develop into flowers. From 40 to 60 days after budburst, bloom occurs (Meneghetti et al. 2006). This stage is followed by several physiological processes separated into 6 major phenological stages: fruit set, berry formation (first phase of rapid growth or green phase), lag phase, véraison (onset of ripening), berry ripening (second phase of rapid growth), ripe berry (harvest) (Ristic and Iland 2005).
However, such alarmist models overlook the many possible adaptations possible to climate change (van Leeuwen et al. 2013). The INRA project LACCAVE is aimed at identifying possible strategies for viticulture to face climate changes. These initiatives concern different areas of viticulture, such as genetic improvement, field management practices, oenological processes as well as consumer taste. The 3 components of climate change cited above may not have the same importance for viticulture adaptation. Indeed, ambient CO2 increase is a slow phenomenon, whose major effect is to increase photosynthesis on the short term but likely not on the long term (Araya et al. 2008) and promote stomatal closure (Leymarie et al. 1999). Drought frequency is an important issue for the Mediterranean basin; however this issue can be handled through irrigation and management practices initiatives. Temperature elevation seems to have higher issues, as it impacts many viticultural aspects such as pest control, orchard management, season duration, water resources, yield and finally wine quality. In order to be able to manage climate change effect on viticulture, mechanisms underlying plant response to temperature have to be better understood.
II. Yield and temperature
II.1. Yield definition in grapevine
(i) Grapevine reproductive development description
When considering proleptic growth (lateral growth from winter bud), reproductive development is a complex process spread over two growing seasons (Carmona et al. 2008). The first season of reproductive development takes place in winter buds (fig. 2A). The second season takes place before and after budburst of these winter buds (fig. 2B). During the first season of growth, inflorescences are induced and initiated in winter buds under the influence of growth regulators signals (Srinivasan and Mullins 1981). Inflorescence induction only concerns the 1st to 6th basal lateral meristems (LR) where cytokinin can favor it. More distal LRs are inhibited by gibberellin signals and will give rise to tendrils instead of inflorescences. After one to three inflorescence initiations, winter bud enters into dormancy. During the second growing season, inflorescences complete their development, then bloom, and fruit formation and later ripening happens (Boss et al. 2003). At the beginning of the second growing season, when environmental condition become favorable, winter buds resume their activity and inflorescence develop additional branches and flowers. The more branched the inflorescence, the more flowers formed per inflorescence (May 2000). From 40 to 60 days after budburst, bloom occurs (Meneghetti et al. 2006), followed by fruit set. In grapevine, it is common to observe incomplete fruit set of the bunch, around 30 to 50% depending on the cultivar and the year (Dry et al. 2010).
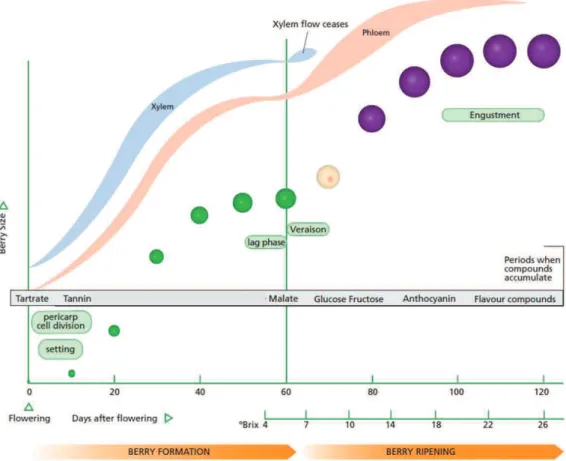
Berry formation is an important phase of growth during which cell division occurs and metabolites accumulate (fig.3). Berry classically enters in lag phase when a plateau of berry growth in terms of
Figure 3: Berry formation and ripening description (adapted from Kennedy, 2002). Berry formation is an
important phase of growth during which histological and biochemical changes occurs. During this phase, cell division and cell elongation occurs in the berry; seeds are formed and reach their maximal fresh weight. It is also during this stage that organic acids as tartrate start to accumulate. The lag phase corresponds to a plateau of berry growth in terms of diameter and fresh weight. During this phase, Malic and tartaric acid reach their maximal concentrations. The veraison stage is defined as the berry coloring and softening. It marks the beginning of the berry ripening phase when berry diameter and fresh weight starts to increase again. Anthocyanins and soluble sugars as glucose and fructose start to accumulate in the berry. Moreover, tartaric acid concentration stays stable while malic acid concentration begins to decrease (Coombe 1992). The maturity stage is reach when plateau values are observed for berry diameter, fresh weight and soluble sugar content
diameter and fresh weight is observed. The véraison (berry coloring and softening) marks the beginning of the ripening phase. The maturity is reached when maximum values are observed for berry volume, fresh weight and soluble sugar content per fruit unit. A slight decrease in berry volume and fresh weight may be observed in some cultivar and/or growing conditions, due to berry shriveling (McCarthy 1999).
(i) Yield components
Grapevine yield at plant level may be divided into 4 major components: (i) the number of bunch per plant, (ii) the number of flower per bunch, (iii) the actual number of berry per bunch and (iv) the berry weight at harvest. For proleptic axes, these components are determined at different time during the two years of the reproductive development (Carmona et al. 2007). The number of bunch per plant is determined by the number of inflorescences induced in winter buds during the previous vegetative cycle and by the number of buds allowed to growth by practices (pruning, vigor management, quality of dormancy breakings .).. The number of flower per bunch is determined both during the previous vegetative cycle in relation to inflorescence branching intensity (Shavrukov et al. 2004) and during cycle of bud development in relation to secondary inflorescence branching and flower differentiation. The actual number of berry per bunch is determined the second year during anthesis and the next two weeks of development (Bernard 1980). Berry weight at harvest depends on berry formation and berry ripening phase during the second year of reproductive development. Such large schedule of yield elaboration implies that several ways to impact on yield are possible. It also implies that any event impacts in parallel on current year yield as well as on next year yield (Vasconcelos et al. 2009).
(ii) Quality aside
Wine quality relies largely on berry composition at harvest which depends essentially on 4 major trends: soluble sugars, organic acids, phenolics and aromas precursors (Ali et al. 2010). Anthocyanins are important for wine color and tannin for organoleptic quality (stringency taste). Soluble sugar content is important for alcoholic fermentation and organoleptic quality (wine body). Organic acids are responsible for wine pH, and play a role into wine stability, color and organoleptic quality (freshness taste). All of these traits are dependent on genotype, crop management and environmental sources of variability.
II.2. Temperature effect on annual crop yield
Figure 4 presents an overview of elevated temperature effects on annual crops development, and in particular on yield elaboration. It is now well admitted that elevated temperature leads to yields decrease in many crops (Wheeler et al. 2000; Lobell and Asner 2003; Barlow et al. 2015; Eyshi Rezaei et al. 2015). This decrease can be observed both as a response to short heat stress (Barnabás et al. 2007; Rattalino Edreira et al. 2011; Talukder et al. 2014), as well as a response to long term
Figure 4: Elevated temperature impact on annual crops development. Blue arrow represents elevated
temperature effect on vegetative development and on gas exchanges. Violet arrows represent elevated temperature effect on phenology. Black and orange arrows represent respectively elevated temperature and temperature stresses effect on yield elaboration. 1: Roberts and Summerfield, 1987; Cleland et al., 2007. 2: Jones, 1992; Peng et al., 2004; Warren and Dreyer, 2006; Sage and Kubien, 2007. 3 : Prasad et al., 2006; Rattalino Edreira et al., 2011; Talukder et al., 2014. 4: Keeling et al., 1993; Triboi, 2003.
temperature increase (Peng et al. 2004; Madan et al. 2012). Temperature acts on different components of yield depending on the period.During floral initiation and anthesis, the grain number is impacted by elevated temperature and heat stresses. Indeed, in crops such as maize, rice and wheat, elevated temperature during this period alters pollen and ovary development (Prasad et al. 2006; Talukder et al. 2014), reduces flowering success (Rattalino Edreira et al. 2011) and also leads to grain abortion. Moreover, heat stress during this period leads to kernel abortion in maize (Rattalino Edreira et al. 2011).
During grain filling period, temperature increase alters grain weight, size and quality. Indeed, grain filling period duration is shortened by elevated temperature leading to smaller and lighter grains (Tashiro and Wardlaw 1989). Moreover, starch accumulation (Keeling et al. 1993), protein accumulation and composition (Triboi 2003) in grain is impaired. Heat stress during this period decreases grain filling rate, making worse temperature impact on grain weight and quality (Tashiro and Wardlaw 1989).
Such causal connections may be harder to identify in perennial plants like grapevine. II.3. Temperature effect on grapevine yield
Grapevine yield elaboration on proleptic axes is spread over two consecutive years; temperature may thus impact on it differently depending on the period considered (fig. 5).
(i) During the first year
When applied during the first year of reproductive development in the winter buds elevated temperature presents a positive effect on grapevine final yield. Indeed, up to 30°C, temperature favors inflorescence primordium initiation and differentiation. It increases the number of inflorescence primordia per bud and their individual weight (Dunn 2005). Above 30°C, these parameters slowly decrease, showing an Arrhenius type response curve to temperature.
(ii) During the second year: budburst
Inflorescence secondary branching and flower formation occurs from a few weeks before budburst until anthesis. Yield elaboration can be negatively impacted by elevated temperature during this period (Dunn 2005). Indeed, Dunn and Martin (2000) show that elevated temperature of the soil reduces flower formation. Moreover, Pouget (1981) show that elevated temperatures during budburst repress flower differentiation, and the earlier the temperature increase, the more repressed is flower differentiation. However, elevated temperature during budburst causes an elevation of individual flower size, of fruit set success and of final berry size (Keller et al. 2010). These effects seem to buffer the negative effect of budburst temperature on yield.
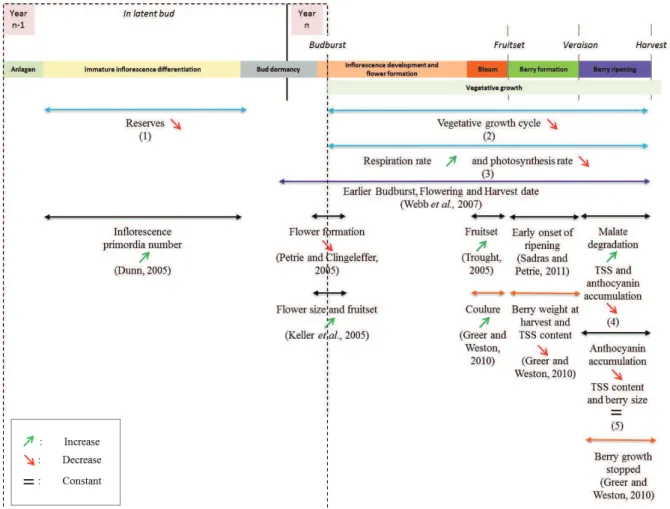
Figure 5: Elevated temperature impact on Grapevine development. Blue arrow represents elevated temperature
effect on vegetative development and on gas exchanges. Violet arrows represent elevated temperature effect on phenology. Black and orange arrows represent respectively elevated temperature and temperature stresses effect on yield elaboration. 1: Field et al., 2009; Rogiers et al., 2011; Holzapfel and Smith, 2012. 2: Lebon et al., 2006; Webb et al., 2007. 3: Jones, 1992; Zufferey et al., 2000; Greer and Weedon, 2011; Yamori et al., 2011. 4 : Poudel et al., 2009; Carbonell-Bejerano et al., 2013. 5: Mori et al., 2005, 2007; Yamane et al., 2006.
(iii) During the second year: flowering and fruit set
Temperature increase during anthesis shows different effects depending on duration and on severity. Trought (2005) shows that long-term elevated temperatures may favor final bunch weight thanks to higher fruitset. Indeed, the higher the temperature, the faster the pollen tubes growth and the longer the pollens tubes. Considering that pollen tube growth lasts only 24 hours, high temperature could favor fertilization of more flowers, as not only small flowers are able to be fertilized (Staudt, G 1982). Short spells of extreme temperature (40/25°C, Day/Night) were applied on grapevine during flowering stage by (Greer and Weston 2010). A flower abortion was observed: all flowers dropped during the few weeks following the heat stress. This phenomenon was not observed when the heat stress was applied after fruit set. Moreover, heat stress after fruit set shows no effect on further berry growth and final composition (Greer and Weston 2010).
(iv) During the second year: first phase of berry growth and lag phase
During the first phase of berry growth, yield is elaborated through cell division, cell elongation and organic acids accumulation. These processes can be impaired by temperature increase. Indeed, elevated temperature before ripening shortens berry growth period, inducing an early onset of ripening but without modification of berry final size and composition (Sadras and Petrie 2011). As for flowering and fruit set stages, long-term temperature increases must be considered separately from short heat stress. Indeed, heat stress applied during lag phase induces a decrease of berry final fresh weight and soluble sugar content (Greer and Weston 2010).
(v) During the second year: berry ripening
Temperature increase at véraison and during ripening has a negative effect on berry growth and composition (Kliewer and Lider 1970). Indeed, soluble sugar and anthocyanin accumulation is slowed down under high temperature while malic acid degradation is accelerated (Poudel et al. 2009; Carbonell-Bejerano et al. 2013). However, some other studies report that elevated temperature reduces anthocyanin accumulation in berries without any modification of soluble sugar content and berry size (Mori et al. 2005, 2007; Yamane et al. 2006). Once again, temperature increase has to be dissociated from heat stress. Indeed, Greer and Weston (2010) show that heat stress at véraison stops berry growth and impairs soluble sugar accumulation.
To conclude, temperature has a strong impact on grapevine yield, even more pronounced when the overlapping of reproductive development of shoots and winter buds is considered. However, it is difficult to determine a single pattern for the response to temperature after fruit set because many processes are involved and may be engaged simultaneously. The present study will focus on the early events of yield elaboration, for which temperature effects was consistently observed but for which a clear understanding of the causes is lacking.
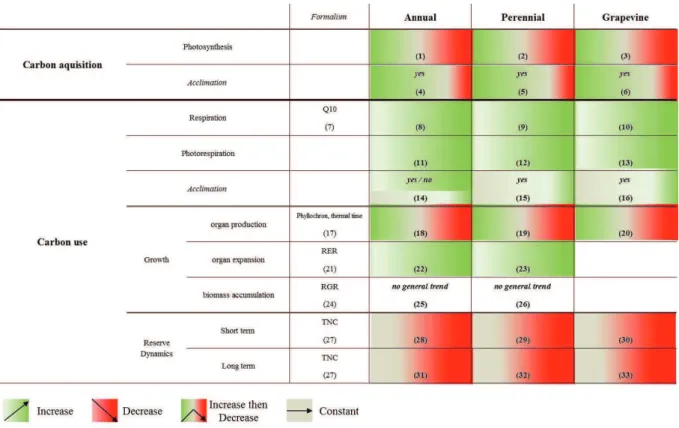
Figure 6: Temperature impact on carbon balance components in annual, perennial and grapevine plants.
Formalism used to describe carbon balance components are presented in the first column. 1: Crafts-Brandner and Salvucci, 2002; Sage and Kubien, 2007; Yamori et al., 2011; 2: Higgins et al., 1992; Warren and Dreyer, 2006; Sage and Kubien, 2007; 3: Zufferey et al., 2000; Soar et al., 2009; 4: Bunce, 2000; Hikosaka et al., 2006; Atkin
et al., 2006; 5: Warren, 2008; Way and Sage, 2008; Silim et al., 2010; 6: Zsófi et al., 2009; Greer and Weedon,
2011; Sadras et al., 2012; 7: Dewar et al., 1999; Miller et al., 2001; 8: Jones, 1992; Peng et al., 2004; Peraudeau
et al., 2015; 9: Higgins et al., 1992; Zhao et al., 2013; 10: Zufferey et al., 2000; Huang et al., 2005; Escalona et al., 201; 11: Brooks and Farquhar, 1985; 12: Warren and Dreyer, 2006; 13: Zufferey et al., 2000; 14: Talts et al.,
2004; Atkin et al., 2006; Bunce, 2007; Way and Yamori, 2014; 15: Will, 2000; Ow et al., 2008; Tjoelker et al., 2008; Silim et al., 2010; 16: Huang et al., 2005; Salazar-Parra et al. 2015 ; 17: Jones, 1992, page 92; 18: Parent
et al., 2010; 19: Malcolm et al., 2007; 20: Lebon et al., 2006; Keller and Tarara, 2010; Greer and Weedon, 2012;
Rogiers et al., 2014; 21: Granier and Tardieu, 1998; 22: Lafarge et al., 1998; Granier et al., 2002; 23: Dambreville et al., 2013; 24: Loveys et al., 2002; 25: Rajan et al., 1973; Heuvelink, 1989; Tahir et al., 2008; Nagai and Makino, 2009; 26: Bruhn et al., 2000; Loveys et al., 2002; Dambreville et al., 2013; 27:Würth et al., 2005 ; 28:Gibon et al., 2004; Smith and Stitt, 2007; Pyl et al., 2012; 29:Morandi et al., 2008; 30:Poudel et al., 2009; Carbonell-Bejerano et al., 2013; 31: Keeling et al., 1993; Tahir and Nakata, 2005; 32: Hoch and Körner, 2003; Palacio et al., 2014; 33: Holzapfel et al., 2010; Sadras and Moran, 2013.
III. Carbon balance and temperature
III.3. Elevated temperature effect on carbon acquisition Temperature effects on carbon acquisition are described in figure 6.
(i) Temperature effect on photosynthesis
In C3 plant, photosynthesis response to temperature follows an Arrhenius-type curve (Berry and Bjorkman 1980). Indeed, temperature increase leads to an increase of net photosynthesis (Pn) until an optimal temperature. Above this optimal temperature, net photosynthesis is decreased. The photosynthesis optimal temperature varies depending on the species. For instance it was measured at 26°C for Arabidopsis thaliana, 31°C for Maize and 35°C for trembling aspen, Populus tremula (Niinemets et al. 1999; Parent et al. 2010). Optimal temperature also varies between genotypes of the same species. Indeed, in grapevine it varies depending on the cultivar. Optimal temperature is about 25°C for Riesling and about 30°C for Chasselas (Zufferey et al. 2000). This optimum may also be affected by the environmental conditions. It increases up to 36°C for Semillon under atmospheric CO2 saturation because of lower photorespiration (Greer and Weedon, 2011).
(ii) Temperature acclimation
Acclimation is an important element of photosynthesis response to temperature. Photosynthesis instantaneous response to temperature depends on the temperature the plant has experienced during the previous days to weeks. This occurs both in annual and perennial plants where temperature acclimation triggers a shift in plant optimal temperature (Berry and Bjorkman 1980). Indeed, plants growing in a warm habitat show a higher optimal temperature than those acclimated to colder conditions. Way and Sage (2008) have shown that black spruce (Picea mariana) grown in warm temperature shows an optimal temperature of 30°C instead of 20°C for seedlings grown in cold environments. Yamori et al. (2010) shows that this shift in optimal temperature can be observed in several annual species such as rice and tobacco. This acclimation phenomenon can also be observed in several grapevine cultivars showing a higher temperature optimum when grown in warm condition (Schultz, 2000; Greer and Weedon 2012). Photosynthesis acclimation can be partly explained by inactivation of Rubisco at cold temperature and leakiness of photosynthetic membranes at high temperature (Atkin et al. 2006). However, major explanations of photosynthesis acclimation are related to biochemical properties of photosynthesis mechanism, as for instance an increase of RuBP carboxylation rate (Hikosaka et al. 2006).
III.2. Elevated temperature effect on carbon use Temperature effects on carbon use are described in figure 6.
(i) Temperature effect on respiration
Dark respiration (R) is increased by temperature (Atkin et al. 2005). Respiration response to temperature is often represented by the Q10 value, the relative increase of respiration when temperature increases by 10°C. Atkin et al. (2005) gathered several respirations Q10 measured in several species and organs ranging from 1 to 6, and showed for example that maize leaves Q10 was about 1.7. Higgins et al. (1992) showed that Thompson seedless grapevine has a respiration Q10 of 2.5, while Redhaven peach has a Q10 of 1.9. Respiration increase in response to temperature is true for leaf respiration but also for other organs respiration as stem (Smart 2004; Atkin et al. 2005) and root (Bryla et al. 1997; Huang et al. 2005; Atkinson et al. 2007). This simple formalism is questioned since Q10 is often shown to increase in response to temperature.
(ii) Temperature effect on photo-respiration
Photo-Respiration (PR) is the result of the oxygenase activity of the Rubisco during the diurnal phase. In C3 plants, net photosynthesis decreases partly due to an increase of photo-respiration (Berry and Bjorkman 1980). Indeed, Rubisco oxygenase activity is enhanced by temperature at the expense of its carboxylase activity (higher solubility of O2, not enough photosynthetic electron transport). PR was measured in several species such as spinach (Brooks and Farquhar 1985), Quercus canariensis (Warren and Dreyer 2006) and grapevine (Zufferey et al. 2000), showing an increase in response to temperature, except when atmospheric CO2 simultaneously increases (Greer and Weedon, 2011). PR Q10 can vary between 1 to 5 depending on the species (Atkin et al. 2005).
(iii) Temperature acclimation
As for photosynthesis, respiration may present an acclimation to temperature phenomenon. This acclimation leads to a slowdown in respiration response to temperature for plants grown in warm conditions (Atkin et al. 2005). This phenomenon is commonly described on perennials as boreal trees (Tjoelker et al. 1999) and pines (Ow et al. 2008; Tjoelker et al. 2008). However, in annual plants some species present divergent acclimation to temperature. Indeed, some species such as Arabidopsis thaliana present an acclimation of respiration to temperature (Talts et al. 2004) while others such as Amaranth (Amaranthus hypochondriacus) do not present acclimation (Bunce 2007). Acclimation of respiration to elevated temperatures was reported for grapevine roots (Huang et al., 2005) and leaves (Salazar-Parra et al. 2015).
(iv) Temperature effect on organogenesis
Vegetative organ initiation is linearly increased by temperature (Jones 1992). Indeed, the phyllochron i.e. the time between the emergences of two successive organs is reduced by temperature when
expressed in days. This phyllochron is constant when expressed in thermal time (Lebon et al. 2004). However, organ production rate slowdowns in response to extreme temperatures, supporting the view that organ production rate follows an Arrhenius-type response to temperature (Parent et al. 2010).
(v) Temperature effect on organ expansion
Organ expansion is also affected by temperature. As for organ production, thermal time is adequate to describe organ expansion. For instance, leaves follow a similar developmental pattern when thermal time is used for Arabidopsis thaliana, sorghum, and sunflower (Granier and Tardieu 1998; Lafarge et al. 1998; Granier et al. 2002). Relative expansion rate (RER) is commonly used to describe organ expansion and RER (expressed per unit of time) is linearly increased by temperature (Lafarge et al. 1998; Granier et al. 2002; Dambreville et al. 2013) owing to the proposal to express it per unit thermal time and account for temperature fluctuations (Granier et al., 2002).
(vi) Temperature effect on biomass accumulation
Relative growth rate (RGR) is commonly used to described biomass accumulation; it is calculated as the increment of dry mass per increment of time divided by the existing biomass. Leaf RGR is calculated by the multiplication of 3 parameters: leaf mass fraction (LMF), specific leaf area (SLA) and net assimilation rate (NAR). LMF is the fraction of plant biomass allocated to leaves. SLA is the ratio of leaf area to leaf dry mass; it gives an idea of tissue density (Poorter et al. 2009). NAR is the net increment of biomass per increment of time divided by the leaf area and it gives an idea of respiration to photosynthesis (R/P) ratio. No general trend of leaf RGR response to temperature can be determined from literature. Loveys et al. (2002) showed that RGR response to temperature was mainly driven by SLA (Specific leaf area) except at low temperature where net assimilation rate (NAR) was the most important determinant of RGR. Moreover, it is commonly accepted that plant root mass fraction (RMF) is decreased by temperature (Poorter et al. 2012). Indeed, biomass allocation to root is decreased under elevated temperature as described for Arabidopsis thaliana by (Vile et al. 2012).
(vii) Temperature effect on reserves dynamics
Reserves dynamics can be separated into two processes: mobilization and replenishment of plant reserve. Total non-structural carbohydrates (TNC) are commonly used to quantify these reserves. In annual plants, short-term carbon storage is performed in vegetative organs as stem and leaves while long term carbon storage takes place in reproductive organs such as grain and fruits. TNC are produced during the season of growth long before grain filling period and these carbohydrates (CHO) are used for sink organ growth (Smith and Stitt 2007). Leaves are sources organ and present their own reserves of TNC placed in the chloroplastic compartment mainly in the form of starch. These reserves vary through the day as there are consumed during the dark period and formed during the light period. Gibon et al. (2004) showed that in Arabidopsis thaliana leaves periods of carbon restriction lower carbon use and enhance storage when conditions become favorable. Elevated temperatures negatively
impact on long term TNC storage in grains in cereals (Keeling et al. 1993) although they enhance TNC remobilization from the stem and the senescent leaves (Tahir and Nakata 2005).
In perennials, short-term carbon storage is performed by the leaves as in annual plants but in addition, long term carbon storage takes place in perennial organ of the plants such as roots, stems and branches but also in reproductive organs. Under carbon starvation, carbon storage in these compartments is maintained at the expense of growth, showing that carbon storage is an active process not only triggered by C surplus but also actively maintained at some level as an insurance for further growth and survival (McDowell 2011; Palacio et al. 2014). Temperature acts on that balance between growth and storage, favoring storage at the expense of growth in conifers (Hoch and Körner 2003). In grapevine, elevated temperatures lower carbon storage toward woody reserves (Sadras and Moran 2013) and increase respiration resulting in low root reserves (S.Y. Rogiers et al. 2011). In fleshy fruits perennials such as grapevine, reproductive organs represent a major carbon sink during their development. Even it may be photosynthetically active during its young stages of developments (Lebon et al. 2005), fruits carbon supply is supported by phloem fluxes from sources organs and reserve compartments. Thus plant carbon starvation can alter fruit growth as well as flesh and seed TNC content (Morandi et al. 2008). Indeed, temperature elevation alters TNC content of fleshy fruits like tomato (Adams et al. 2001) and grapevine (Poudel et al. 2009; Carbonell-Bejerano et al. 2013).
III.3. Elevated temperature effect on carbon balance (i) Carbon balance definition
Plant carbon balance can be defined as the amount of carbon fixed by the plant per unit of time. It is the difference between carbon input and carbon output. In plant, most of the carbon is fixed by photosynthesis. Carbon outputs are carbon release through respiration and photorespiration, and carbon sequestration through biomass build-up.
(ii) Existing models?
A formalization of the evolution of the carbon balance has long been a matter of studies, both in annuals and perennials (Vercambre et al. 2013). Some models are available for annual plants as Greenlab (Dingkuhn et al. 2006; Luquet et al. 2006; Christophe et al. 2008) or the Framework Model developed by Chew et al. (2014). Many carbon balance models are also developed on perennials on different organs and plant scale such as SUGAR, Qualytree or Comon Land Model (Dai et al. 2004, 2009; Lescourret and Génard 2005; Lescourret et al. 2011). Some carbon balance models are specifically developed for grapevine such as Greenlab-vitis, Vitisim and Topvine (Lakso et al. 2007; Pallas et al. 2009; Prieto 2011). All these models are based on the same basal principle of carbon acquisition and use. However they are not based on the same relations between sources and sink and they are not constructed with the same level of specification and with the same goal (Le Roux et al. 2001). Even though they may vary in term of spatial scale (from a compartment to
a single organ) and time step (from hours to years) the majority carbon models for perennial plants can be divided in two groups regarding to reserve dynamics status. Indeed, the majority of carbon balance models consider reserves as passive compartments used to buffer carbon restriction or oversupply such as TREGRO while few other model consider carbon storage and mobilization as active process such as SIMWAL (Le Roux et al. 2001). A wide diversity of carbon balance model thus exists both in annuals and perennials. All these models are based on carbon use and acquisition laws and their responses to environmental conditions.
(iii) Temperature effect on carbon balance
There are many reasons explaining a negative effect of elevated temperature on plant carbon balance. Indeed, photosynthetic capacities increase with temperature to a certain level, then reduced over an optimum while assimilate demand is linearly increased. As a consequence, under high temperature, net carbon gain is hampered, despite the establishment of acclimation mechanism (Shen et al. 2009). Vasseur et al. (2011) shows that Arabidopsis thaliana exposed to elevated temperature present an altered carbon status and phenotypic responses that mimic carbon starvation. Moreover, Alpine trees grown in warmed conditions show a decreased carbon balance compared to trees grown in normal conditions even though acclimation phenomenon is taken into account.
To conclude, temperature has negative effect on plants carbon balance, through effects on both carbon acquisition and use, as well as in fluxes between compartments. The present study will focus on every component of carbon balance described above apart from acclimation.
IV. Working hypothesis: temperature effects on fruit set are related to carbon balance and dynamics?
Elevated temperatures show negative effect on seed-set and fruit-set when applied during floral organ development and flowering (Figure 4 and 5). Moreover, temperature elevation negatively alters plant carbon status through several mechanisms (Figure 6). It can thus be hypothesized an interplaying role of carbon balance on the responses of reproductive development to temperature elevation.
First evidences of carbon balance role on fruit set response to temperature come from observations performed on annual plants. Seed-set is impacted by elevated temperature during anthesis and mainly during female reproductive development in rice, maize, wheat, sorghum and millet (Matsui et al. 2001; Gupta et al. 2005; Prasad et al. 2008; Rattalino Edreira et al. 2011; Talukder et al. 2014). Prasad et al. (2002) show that this negative effect can be buffered in a limited manner by air CO2 concentration increase in kidney bean (i.e. a 25% seed set increase for a 350 ppm increase). Kirby (1988) shows that wheat floret abortion is concomitant with the higher stem dry matter accumulation rate, leading to competition for assimilates. Ruan et al. (2012) review support the hypothesis that fruit set and seed-
set is under the control of photo-assimilates and more precisely sucrose concentration in the phloem. Under stress condition as water deficit or elevated temperature, low sucrose concentration leads to Programmed Cell Death (PCD) genes activation in reproductive organs finally leading to abortion (Ruan et al. 2010). Guilioni et al. (2003) show that abortion in pea (Pisum sativum L.) is related to temperature effect on plant growth. Indeed, abortion act as a buffer of assimilate availability, distal flowers abort when proximal flower became an important sink during fruit development (Guilioni et al., 1997). This observations of relation between fruit set and assimilates availability was also reported on 79 species, presenting higher yields under high CO² atmosphere (Jablonsky et al., 2002). Cereal yield loss in response to temperature is related to change in assimilates availability, induced by cycle duration shortening, thus light interception reduction along the plant cycle and alteration of carbon assimilation (Barnabas et. al, 2008). Moreover, Zhao et al. (2005) show that cotton fruit abscission under elevated temperature was correlated with lower carbohydrates content in young flowers.
Finally, some evidences of the role of carbon balance in fruit set responses to temperature are observed in grapevine itself. Indeed, Lebon et al. (2008) shows that anthesis is the key stage in the success of fruit set. Moreover, this stage corresponds to the plant transition from heterotrophy to autotrophy (Lebon et al. 2008). Thus altered carbon storage during the previous vegetative cycle leads to a carbon limitation during this critical phase of reproductive development. Moreover, Duchêne et al. (2003) showed that TNC concentrations are higher in the cultivars showing the lower coulure rates. Finally, Rogiers et al. (2011) showed that variability in grapevine fruit set is related to photo-assimilatory stresses as defoliation or shading. Moreover they show that fruit set increases with TNC content in shoot and root. Finally, coulure phenomenon was observed in grapevine when reserves were altered by defoliation during the previous year (Candolfi-Vasconcelos and Koblet, 1991).
However, no a-priori considerations are made up on the fact that the whole fruit set responses are directly related to carbon balance or that some responses are direct effects of temperature of reproductive development without interplay with carbon status. The main objective of the PhD was to investigate the effects of high temperature on grapevine vegetative and reproductive development and the possible involvement of carbon balance as a mechanism of regulation of early reproductive development (fruit set and young berry development) under thermal stresses.
V. The Microvine: a new model to address scientific issues on the grapevine response to temperature?
The working hypothesis established in the previous section is not straightforward to test with current grapevine cultivars because of many limitations due to their developmental properties. In order to bypass these limitations, we used the Microvine as a possible new model.
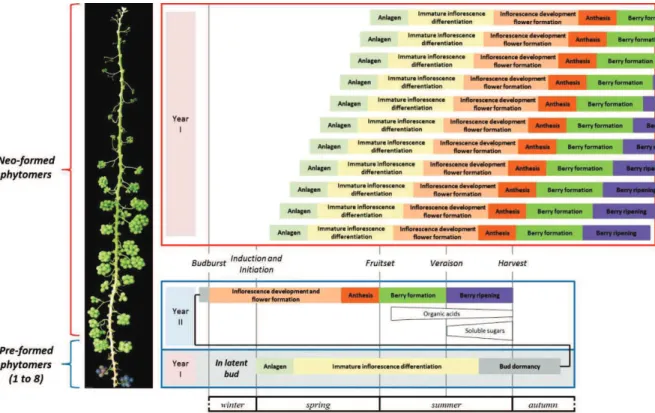
Figure 7: Microvine reproductive development description along the proleptic axis (adapted from Carmona et