HAL Id: hal-02525264
https://hal.archives-ouvertes.fr/hal-02525264
Submitted on 30 Mar 2020
HAL is a multi-disciplinary open access
archive for the deposit and dissemination of sci-entific research documents, whether they are pub-lished or not. The documents may come from teaching and research institutions in France or abroad, or from public or private research centers.
L’archive ouverte pluridisciplinaire HAL, est destinée au dépôt et à la diffusion de documents scientifiques de niveau recherche, publiés ou non, émanant des établissements d’enseignement et de recherche français ou étrangers, des laboratoires publics ou privés.
COMPOSITE
Adrien Gillard, Guillaume Couégnat, Stéphane Jouannigot, Olivier Caty,
Sylvain Chupin, Gérard Vignoles
To cite this version:
Adrien Gillard, Guillaume Couégnat, Stéphane Jouannigot, Olivier Caty, Sylvain Chupin, et al.. HIGH TEMPERATURE MECHANICAL CHARACTERIZATION OF MICRO-AND MESO-INTERFACES IN A 3D CARBON-CARBON COMPOSITE. ECCM17: 17th European Conference on Composite Materials, TU München & MAI Carbon, Jun 2016, Munich, Germany. �hal-02525264�
HIGH TEMPERATURE MECHANICAL CHARACTERIZATION OF
MICRO- AND MESO-INTERFACES IN A 3D CARBON-CARBON
COMPOSITE
Adrien P. Gillard1, Guillaume Cou´egnat1, St´ephane Jouannigot1, Olivier Caty1, Sylvain Chupin2, G´erard L. Vignoles1
1Laboratoire des Composites Thermo-Structuraux (LCTS), UMR5801-CNRS-CEA-SAFRAN, Universit´e de Bordeaux, 3 all´ee de la Bo´etie, 33600 Pessac, France
Email: gillard@lcts.u-bordeaux.fr, Web Page: www.lcts.u-bordeaux.fr 2CEA DAM, Le Ripault, BP 16, 37260 Monts, France
Keywords: interfaces, carbon-carbon composite, testing technique, high temperature push-out
Abstract
3D Carbon-Carbon (3D C/C) composites are key elements in aerospace applications thanks to their ben-eficial property-to-mass ratio at high temperature. Yet, they display complex mechanical behavior, espe-cially at high temperature, because of the local anisotropy of their constituents and the intricate behavior at the interfaces in-between. The objective of this study is to characterize the interfacial properties of a 3D C/C. This has been carried out at two scales: i) the meso-interfaces, between the yarns composing the material; ii) the micro-interfaces between the fibers and the carbon matrix into the yarns. Monotonic and cycled push-out tests brought characteristic values of these interfaces, such as strength, dissipated energy and friction. The damage mechanisms and the effect of the temperature up to 1473K are also reported. These experimental values will eventually feed a numerical multiscale modeling approach aiming at reproducing the mechanical behavior of such C/C materials.
1. Introduction
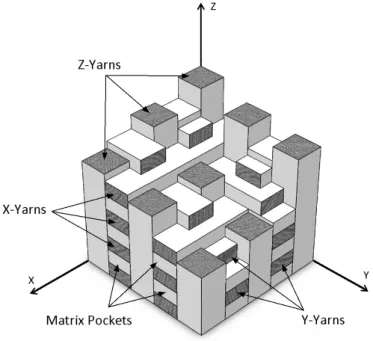
Carbon/carbon (C/C) composites are advanced material designed for aerospace applications. They are the most effective at high temperature, under mechanical and thermal loads, and are used as nozzles or braking systems [1, 2]. They are composed of a preform, usually a woven carbon fiber reinforcement densified by a carbon matrix. Many reinforcement architectures have been produced to answer to various needs [1], the fibers only providing beneficial properties along their axial direction. There are many ways to deposit carbon matrices on the preform, such as chemical vapor infiltration (CVI) or polymer impregnation and pyrolysis (PIP) [1, 2]. Each produces a singular final material for each preform, giving birth to a wide range of C/C composites. The material studied (3D C/C) in this paper is schematized in figure 1. It is composed of a 3D tri-orthogonal weaving of high modulus carbon fibers, called 3D-Block [1] and densified using high-pressure pitch impregnation and pyrolysis (HIP) and graphitized at 3000K. It contains X, Y and Z yarns and matrix pockets in the voids left by the preform. The Z-yarns have a square section (800µm x 800µm), are twice as large as the X and Y ones (800µm x 400µm) and contain 12k fibers. X and Y yarns being identical, they will be called X/Y yarns. A wide debonding gap (20µm) has been observed around each meso-constituent. This type of material has existed for more than fifty years, yet many interrogation remain on their mechanical behavior, especially at high temperature. First, particular thermal expansions have been observed on such materials [3]. Though it is commonly accepted that the properties are driven by the reinforcement, the micro-structure highly
The mechanical behavior also becomes very complex when not tested along the preform weaving axes. Sliding at the interfaces between the constituents can be observed [4, 5]. Studying the interfaces behavior in such materials will provide more information on the off-axes fracture mechanisms and could explain part of the peculiar thermal expansion behavior [6].
Figure 1. Structure and constituents of the 3D C/C.
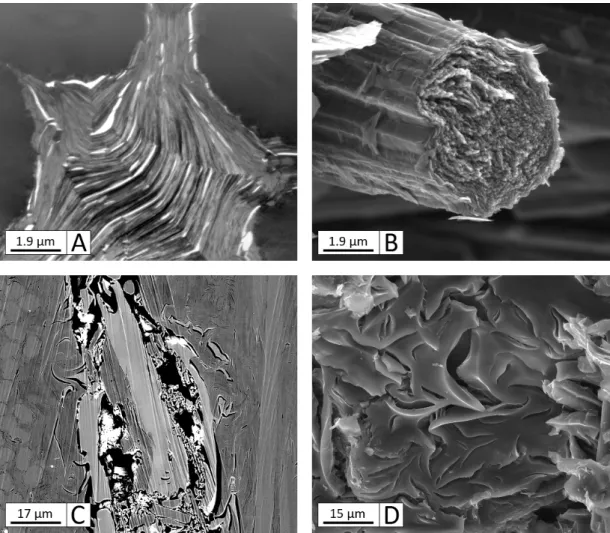
An interface is different from an interphase because of its close-to-zero thickness. It represents the link between the constituents and can be composed of a strong binding or a thin porosity. The 3D C/C in-terfaces are displayed on figure 2. Inin-terfaces can be found at two scales: the microscopic inin-terfaces are located between the fibers and the matrix and between the matrix grains themselves; the mesoscopic interfaces are between the meso-constituents (yarns, matrix pockets). Among the several ways to char-acterize these interfaces, push-out testing is one of the simplest to perform. Pushing an element out of a material provides information on the shear fracture behavior. It also emphasizes the various mechanisms that rule at the interface, such as debonding, unlocking or sliding. As explained above, two different C/C composites can display completely different behaviors, but similar experiments can be conducted on them. Hatta [4] proposed a technique on a very similar composite to study the microscopic interface. Push-out tests were conducted on bundles within yarn sections. It revealed that the densification cycles tend to increase the initial interfacial debonding and sliding stress. The preform dependency was also pointed out. Aoki investigated the interfacial properties of a similar composite [7, 8]. This study was performed at two scales, one on the fiber-matrix interface, the other on the interface around the yarns. Considering the microscopic interfaces, the effect of the temperature (up to 2273K) and degassing was considerable on the shear strength and the fracture mechanisms appeared complex. The mesoscopic interfaces were similarly examined at high temperature, with push-out and pull-out test methods. The temperature had a clear effect on the interface shear strength, probably due to thermal stress increas-ing anchor effect and frictional resistance. Nevertheless, heat treatment seemed to decrease interfacial properties, increasing residual stress and reducing bonding areas.
The work presented in this paper follows the previous work of Hatta and Aoki. Yet, the material is a variation of the one they characterized and the investigation has been carried out differently at both
Figure 2. Overview of the micrscopic (A and B) and mesoscopic (C and D) interfaces.
scales. Push-out tests were performed on X/Y and Z yarns and on 200 micron bundles, from room tem-perature up to 1473K. The goal is to inventory the debonding and sliding mechanisms at the interfaces. Surface and sectional observations with optical and electronic microscopy allowed accurate investiga-tions. Monotonic and cycled tests revealed the different steps in the fracture process during the tests. The data gathered is to be used for simulation purposes, thus quantitative values and detailed descriptions are required in this study. Fracture energy, friction stress and other relevant values are quantified.
2. Experimental setup
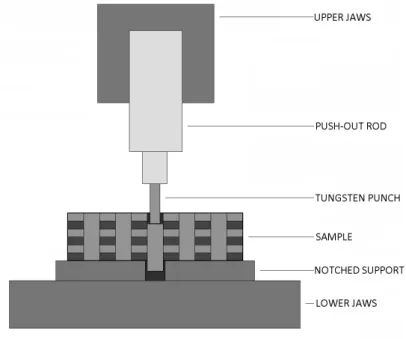
The room temperature experimental setup is designed to perform push-out test at both scales. It can push X/Y or Z yarns as well as 100-200µm wide bundles. The figure 3 describes the different parts that com-pose the device. The whole equipment is embedded between the jaws of an Instron tension/compression test machine. Displacement and load are measured from deported sensors. The sample is glued above a notched support, allowing the pushed element to pass through, which is fixed to the inferior jaw. A push rod composed of a tungsten punch is fixed on the upper jaw. The test parameters are the sample thickness, the rode shape and the notch width. To push Z rods, a 4mm long and 500µm wide cylindri-cal punch is required, over a 1mm wide notch. X and Y yarns need a punch with a 250µm to 500µm rectangular section. Finally, for the bundle push-out rods, 100-200µm large cylindrical punches were used, with adapted length to avoid bending and misalignment, above a small enough notch to prevent the
The element to be pushed through is oriented along the thickness. Mechanical polishing is performed on both surfaces (top and bottom) to facilitate positioning, gluing on the support and aiming. Several thicknesses have been tested from 100µm to 5mm: their influence is discussed on the next section.
Figure 3. Room temperature push-out experiemtnal setup.
A similar push-out device has been developed to work at 1473K, under controlled atmosphere. The sample is placed in a small furnace where the push-out tests are performed. Before the heating, a 1E-3mbar to 1E-5mbar vacuum is established in the chamber to avoid any oxidation on the material. The sample sizes and preparation method is similar to the ones used for the room temperature tests. The punches and the notches are also the same to focus the tests on the temperature effects. The load is measured right above the punch. The displacement is measured on the hull outside the vacuum chamber, the compliance of the device is assessed before the actual tests.
The tests are displacement-driven directly from the tension/compression machine. Two kind of tests can be realized, monotonic and cycled. The monotonic tests consist in a ramp up to a maximum displacement value, a plateau to observe static changes and a negative ramp back to the initial state. The cycled tests include several monotonic tests with progressive maximum values. The cycles emphasize the friction and the elastic recoil with the force-displacement hysteresis.
Postmortem examinations help understanding the fracture mechanisms. Surface observations reveal the shape of the pushed element if it made it through, though such observations lack information about what happened inside. Sectional cuts have been performed to enlighten the fracture mechanisms all along the thickness of the samples. It is a vertical section of a sample, going through the middle of the pushed element, prepared and polished in such way that the fracture surface and the debris remain unchanged. Observations can be made with an optical or electronic microscope.
3. Results and discussions
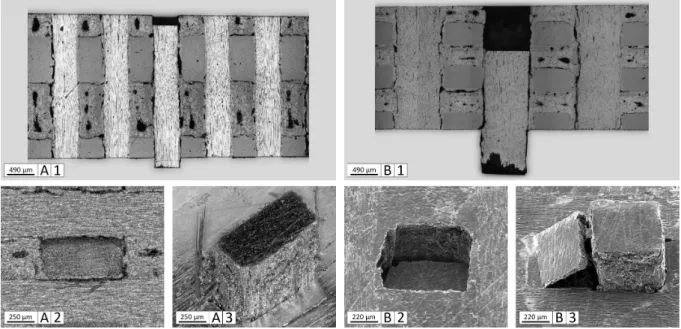
Surface and sectional postmortem observations are presented on figure 4. Push-out test were conducted on X, Y and Z yarns. In both cases, the yarns were efficiently pushed through the thickness. The surface observations display no further damage to the 3D C/C. Nevertheless, some differences appear on the sectional views. The Z yarn is undamaged and little debris seems to have been driven during the test. On the contrary, the X/Y yarn presents newly created voids and debris along its course. It appears that its undulating shape, noted by Fitzer and Manocha [1], caused an anchoring effect that may have strengthened the interface.
Figure 4. Postmortem sectional (1) and top (2) and bottom (3) surface observations for X/Y (A) and Z (B) yarn push-outs.
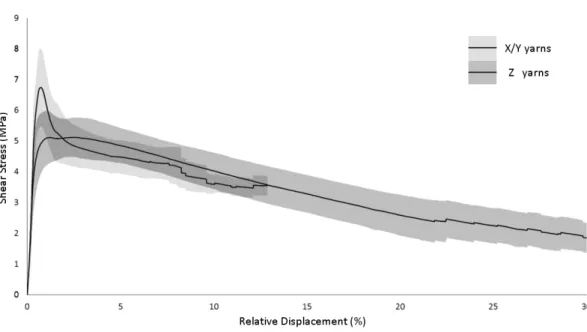
Stress-displacementt curves are presented on figure 5. The thin lines represent the average stress versus relative displacement over more than 50 push-out tests on X/Y and Z yarns; the colored areas around represent the standard deviation. To normalize results, displacement and force had to be turned into relative displacement (displacement to thickness ratio) and stress (force to yarn external surface ratio). Doing this, results for all sample thicknesses can be compared. The fracture occurs in three steps: i) an elastic loading, mostly reversible, due to the sample bending; ii) an unlocking effect, breaking the few binding areas and clearing debris, marked with a stress peak; iii) a sliding with friction marked with a slow decrease of stress. The second step, the unlocking, is far more marked for the X/Y yarns. This could be explained with their undulating shapes as observed above. However, the sliding is similar in both cases and an identical wear phenomenon has been observed. Failed tests are not represented here. They are due to misalignment that causes a bending of the yarns followed by a compression failure. This happened increasingly for thick samples. On the opposite, thin ones broke under bending before any push-out can be performed. Optimal thickness was estimated between 2mm and 2.5mm. It appears there is no real binding at the mesoscopic scale. After unlocking the interface, it slides with a non negligible friction. No fracture energy could be measured. Friction and residual thermal stress from the densification process appear to maintain the meso-constituents together. This is in agreement with the large debonding initially observed all over the 3D C/C.
Figure 5. Push-out tests on X/Y and Z yarns, shear stress versus relative displacement.
Z yarn slices. Bundle push-out tests differ from the yarn push-out tests in the absence of large initial debonding. The interface has to be broken, thus a fracture energy can be measured. Postmortem obser-vations are presented on figure 6. Surface obserobser-vations display large cracks. However, they appeared when the punch penetrates deeply inside the thickness of the sample, far after the test beginning. This put apart, the push-out test is correctly completed. The bundle section shape is the one of the punch on the top side, and slightly different on the bottom side. The fibers may be twisted inside the yarns, provok-ing such a change. The sectional views present the limits of the bundle push-out concernprovok-ing the sample thickness. Thin sample (≤800µm) would see large cracks run around, because of the local shear stress inside the yarn. Thick samples (≥1.6mm) experience a bundle compression failure, they cannot bear the force required to push them through. The optimal thickness has been estimated to be about 1.5mm.
Figure 6. Bundle push-out tests. A: Postmortem sectional observations on several thicknesses. B: Postmortem surface observations.
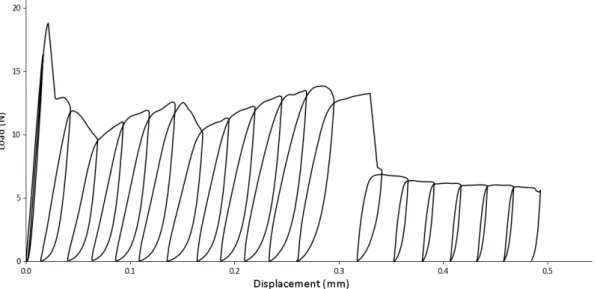
A cycled push-out test is presented on figure 7. The shear fracture of the interface can be summed up in 5 steps: i) an elastic loading almost reversible up to a peak value of 17N; ii) a drop with a critical debonding propagation up to 10-12N; iii) a debonding propagation along the thickness, marked with unlocking mechanisms; iv) a final drop with a critical debonding propagation through the remaining thickness; v) a sliding with friction along the cracked interface. The initial peak is probably caused by local compression due to yarn bending at the beginning of the test, which tends to strengthen the interface. The fast propagation that follows has been estimated to run over one period of the material RVE. This has been confirmed on thin samples where the entire debonding propagation is immediate. Concerning the sliding with friction, it is proportional to sample thickness. The cycling clearly emphasizes the large elastic displacement (with friction) of the bundle during the propagation step with large loops. The thin loops during the sliding reveal a low elastic feedback, proof that the debonding had then run its course through the thickness. The fracture energy has been estimated to 2.7J/mm, which is the value of a strong interface.
Figure 7. Cycled bundle push-out test measurement.
4. Conclusion
Push-out tests have been performed at two scales on a 3D C/C composite. It revealed the fracture mech-anisms and brought a better understanding about the mechanical behavior at the interfaces. Quantitative characteristics have been measured, allowing to pursue this work to the modeling phase. The temperature influence has not been taken into account yet, but is currently under investigation.
Acknowledgments
The authors wish to acknowledge CEA/DAM for a Ph.D. grant to A.P.G.. The authors wish to thank Mael Th´evenot for his help with testing the materials. The authors also wish to thank G. Chollon, A. Dele-houz´e, P. Bordenave and B. Humez for their help in the design of the high temperature characterization device.
[1] E. Fitzer and L. M. Manocha. Carbon Reinforcements and Carbon/Carbon Composites. Springer-Verlag Berlin Heidlberg GmbH, 1999.
[2] G. Savage. Carbon-carbon composites. Chapman & Hall Press, London, 1993.
[3] R. Luo, T. Liu, J. Li, H. Zhang, Z. Chen, and G. Tian. Thermophysical properties of carbon/carbon composites and physical mechanism of thermal expansion and thermal conductivity. Carbon, 42(14):2887–2895, 2004.
[4] H. Hatta, K. Goto, and T. Aoki. Strengths of C/C composites under tensile, shear, and compressive loading: Role of interfacial shear strength. Composites Science and Technology, 65(15-16 SPEC. ISS.):2550–2562, 2005.
[5] H. Hatta, K. Taniguchi, and Y. Kogo. Compressive strength of three-dimensionally reinforced car-bon/carbon composite. Carbon, 43(2):351–358, 2005.
[6] J. Jortner. Effect of Weak Interfaces on Thermal Expansion of 3D Carbon-Carbon Composites. Technical report, Jortner Research & Engineering, Inc., 1985.
[7] T. Aoki, K. Goto, T. Ogasawara, and H. Hatta. Measurements of fiber/matrix interfacial properties of a UD-C/C composite up to 2273K. In 16th International Conference on Composite Materials Process Simulation of Fiber Reinforced, pages 1–9, 2007.
[8] T. Aoki, Y. Yamane, T. Ogasawara, T. Ogawa, S. Sugimoto, and T. Ishikawa. Measurements of fiber bundle interfacial properties of three-dimensionally reinforced carbon/carbon composites up to 2273 K. Carbon, 45(2):459–467, 2007.