HAL Id: hal-00514111
https://hal-mines-paristech.archives-ouvertes.fr/hal-00514111
Submitted on 9 Mar 2012
HAL is a multi-disciplinary open access archive for the deposit and dissemination of sci-entific research documents, whether they are pub-lished or not. The documents may come from teaching and research institutions in France or abroad, or from public or private research centers.
L’archive ouverte pluridisciplinaire HAL, est destinée au dépôt et à la diffusion de documents scientifiques de niveau recherche, publiés ou non, émanant des établissements d’enseignement et de recherche français ou étrangers, des laboratoires publics ou privés.
Benjamin Bicqué, Pierre-Olivier Bouchard, Pierre Montmitonnet, Martine
Picard
To cite this version:
Benjamin Bicqué, Pierre-Olivier Bouchard, Pierre Montmitonnet, Martine Picard. Mechanical be-haviour of iron oxide scale: Experimental and numerical study. Wear, Elsevier, 2006, 260 (3), pp.Pages 231-242. �10.1016/j.wear.2005.03.037�. �hal-00514111�
Mechanical behaviour of iron oxide scale :
experimental and numerical study
Picqué, B.*,**1, Bouchard, P.-O.*, Montmitonnet, P.*, Picard, M.**
* Ecole des Mines de Paris – CEMEF, UMR CNRS 7635, BP 207, 06904 Sophia-Antipolis Cedex, France
** Arcelor Research S.A., Voie Romaine, BP 30320, 57283 Maizières-les-Metz Cedex, France
Corresponding author : Pierre MONTMITONNET
Ecole des Mines de Paris – CEMEF, UMR CNRS 7635, BP 207, 06904 Sophia-Antipolis CEDEX, France
Tel. +33-(0)4 93 95 74 14 Fax : +33-(0)4 92 38 97 52 [email protected]
Summary
The paper addresses the identification of constitutive parameters of thick, brittle layers on metal substrates. Application is to the iron oxide behaviour during hot rolling processes of steel, where oxide scale breaking and embedding is one of the major causes of surface defects. Contact management of a FEM software has been adapted in order to address the transitions corresponding to transverse oxide fracture, along with two other mechanisms, namely delamination and interfacial stick / slip. It is applied to the hot strip rolling process to show pre-bite cracking and its consequences (“micro-extrusion” of the metal). To approximate the stress state prevailing at roll bite entry, the four-point Hot Bending Test (4PHBT) has been selected for the measurement of oxide properties. Oxidation is made in-situ in the test rig under conditions similar to a Hot Strip Mill (HSM) environment. Comparison of load-deflection curves for oxidized and non-oxidized samples allows to determine the mechanical properties of the oxide. Above a critical temperature Tc – around 700°C, but depending on strain rate – the oxide is
ductile (with a very narrow plastic strain range, p < 10-2), Elastic-Viscoplastic (EVP)
constitutive parameters are identified numerically. Below Tc, brittleness is manifested by
an array of transverse, through-thickness cracks. Acoustic Emission (AE) has been used to help detect the onset of fracture, while numerical simulation gives the critical fracture stress at the corresponding point of the load-deflection curve. Results for four low carbon steel grades are compared.
Keywords: brittle coating, oxide scale, hot strip rolling, Finite Element Method, bending
1 Introduction
Due to the formation of a more or less thick iron oxide layer, hot rolling indeed consists in co-deforming a ceramic coating on a metal substrate. Although the thickest and most brittle, “primary scale” layers are removed by mechanical – thermal descaling [1], possible oxide residuals and fast re-oxidation are able to reform a 10 to 30 µm thick layer at the entry of the finishing Hot Strip Mill. At the strip surface temperature imposed by the contact with the cooled rolls, the oxide is most of the time much more brittle than the metal; co-deformation thus often leads to fracture of the oxide under the elongation imposed by rolling (figure 1).
Such cracks give way to fresh metal (“micro-extrusion”) which changes the tribological and thermal properties of the interface. Furthermore, oxide fragments may be embedded inside the metal (“rolled-in scale”), giving a wavy interface thought to be the origin of defects down to the finished, cold-rolled strip. These are sufficient reasons to envisage quantitative predictive modelling of the fracture / micro-extrusion process. The present paper focuses on formation and further evolution of pre-bite cracks, which occur in an area where longitudinal tension stress reigns as the strip surface bends before contacting the rolls. The literature points to three micro-mechanisms [1-3] and proposes stress or strain criteria for their occurrence : interfacial sliding, transverse fracture and interfacial fracture (delamination). In the following, the main thrust will be on pre-bite transverse cracks linked with longitudinal tension.
Tensile failure of oxide films have been observed well below 1% tensile strain [4] ; the thicker the layer, the lower the fracture strain, as predicted using linear fracture mechanics in [5]. Fracture strain also depends on strain rate [4], which has been explained by creep effects relaxing stresses at low speed.
Several mechanisms may combine in a given situation. For instance, Nagl et al. [6] show how an oxide layer in a tension test first develops an increasing number of transverse cracks ; above a critical density, interfacial cracks develop, starting from transverse crack corners, leading to delamination of oxide rafts. A transition criterion is proposed is [7,4], involving layer thickness, fracture stress and interfacial toughness; it allows to measure the ultimate shear strength of the interface [7].
In order to simulate pre-bite transverse fracture and its influential parameters, a stress-based fracture criterion has been implemented in the FEM software Forge2® by generalizing the contact and friction models (paragraph 2). Experiments have been conducted to generate the necessary data (namely the stress-strain relation for the oxide and its critical breaking stress). A hot bending test has been selected for this purpose, as it reproduces the strain pattern observed just ahead of the bite entry and allows to control precisely very small plastic strains. It is described in paragraph 3 and results for different steel grades are presented in paragraph 4.
2 Numerical simulation of pre-bite cracks in rolling
2.1 Computational model
Forge2® is a large deformation thermo-mechanically coupled FEM software with an updated Lagrangian, (V,p) formulation. 3-node P1+/P1 triangles are used to discretize both domains (the thin oxide layer and the thick metal strip); a Master / Slave technique is used to manage the contact between the two deformable bodies (metal and oxide). The tools are considered rigid, therefore given by their surface only. Elastic-viscoplastic behaviour is assumed for the metal and for the oxide scale as well. In order to be able
to simulate the phenomena mentioned above, several developments have proved necessary; they will be used for rolling simulations (paragraph 2.5), but also for interpretation of the hot bending tests (paragraph 4).
2.2 Contact and friction: standard implementation of Forge2®
The inequalities and threshold conditions in the (normal) non-penetration condition and the (tangential) stick-slip friction are relaxed and treated by a penalty technique and a regularisation method respectively. As several bodies are deformable, a “master / slave“ strategy is enforced to avoid spurious oscillations :
penetration of a point of Slave body 2 inside Master body 1 generates a repulsive force Fp:
0
. d
K
Fp p (1)
d0 is a tolerance, and <x>+ means that the force is generated only if x>0. Kp must
be large enough not to let penetration drift too far from = d 0.
The threshold frictional condition is replaced by :
t V V F ai c( ). 2 1 . (2)
where F is a continuous and differentiable function such that F(0) = 0, F'(0) and 1
F as V2 V1.t – and in fact reaches this asymptote quickly enough. Here 2
2 / )
(x x K x
transition does not exist any more strictly speaking, although an adequate choice of Kr
preserves it in practical terms – at least for the purposes of the present study.
Unilateral and bilateral contact options are available; similarly, sliding (equation 2) or sticking ( V2 V1.t 0) contact options exist. The two notions can be crossed, i.e. four cases are available. Moreover, contact and friction conditions, once chosen, are valid for a whole interface between two bodies and all along the simulation.
2.3 Extension for interfacial sliding / delamination
At the beginning of each simulation, bilateral sticking contact is selected (the oxide scale is adherent). A transition has been introduced, for each node individually, between :
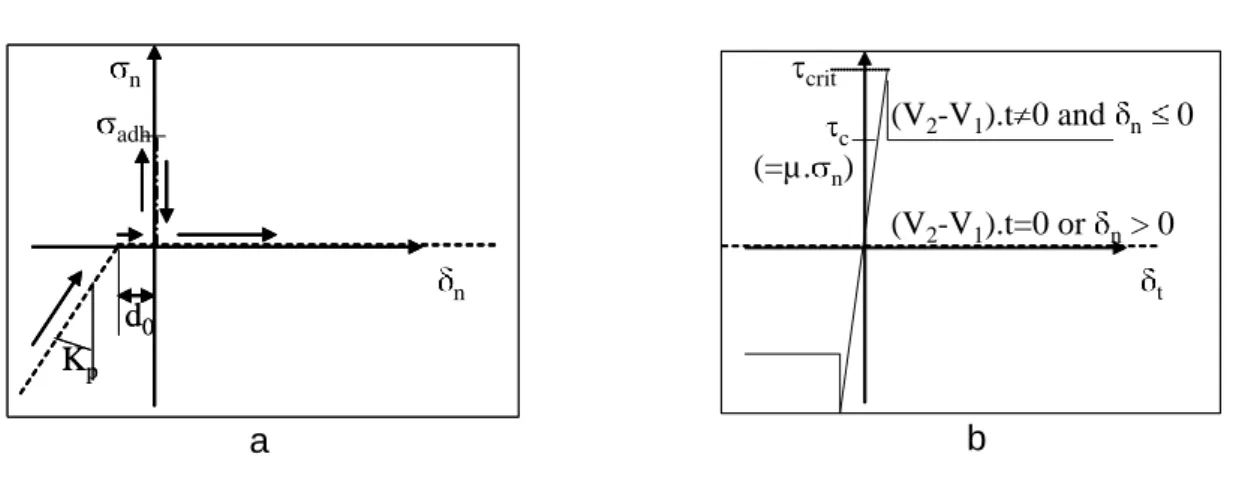
bilateral and unilateral contact: based on a critical stress criterion adh, this is
equivalent to unilateral contact with adhesion (figure 2a) :
0 . . ), ( , 0 . 2 1 1 2 V n n adh ai V V n n adh V (3)
The transition is reversible, i.e. if contact is later on resumed (with compressive stress), bilateral contact is imposed again until n > adh once more. This
supposes that diffusion is quick enough to rebuild adherence on a time scale much smaller than the time step.
sticking and sliding friction, again based on a second, tangential critical stress
crit (figure 2b). Sticking contact (regularized by a large elastic spring constant)
breaks down at crit, bringing about a fall of the tangential stress to the level
given by the friction law, which is itself regularized (hence (V2-V1).t = 0 = 0);
Note that this extension bears some resemblance to the Cohesive Zone Models (CZM) used to model in a simple way crack propagation, a technique almost systematically used to facilitate and smoothen numerical simulation of coating delamination events [8]. Major differences exist however: the present model has quite abrupt transitions and zero fracture energy, which may be well adapted for brittle materials and interfaces. No problems of convergence has been encountered yet.
2.4 Transverse fracture
Transverse cracks are often observed (see figure 1). They always extend through the whole oxide layer thickness. Therefore, a simple stress-based fracture criterion has been implemented :
) (T
crit
tt (4)
On reaching this criterion at a given surface node of the oxide scale layer, a crack is created at this position, perpendicular to the layer, immediately from the interface to the external surface. Nodes of this line are doubled, and the corresponding body is separated in two new ones, modifying the data structure of the software.
2.5 Application to a Hot Strip Mill (HSM) stand [9]
Among the tests performed to check the numerical developments is an application to the second stand of a Hot Strip Mill, which is supposed to be the most critical one in term of the rolled-in-scale defect. The data concerning the oxide are not realistic : it is assumed purely elastic and the critical fracture stress is too high; but the overall
behaviour is quite representative of what we expect in rolling, based on experimental observations. The following conditions have been selected:
Roll : Diameter : 700 mm; speed : 2.19 m.s-1; Average temperature : 200°C Strip: Inlet thickness: 20 mm ; Exit thickness: 13 mm (35% reduction);
Temperature at entry : 900°C;
Mechanical properties: E = 145 GPa, = 0.33, 143 . 0 252 . 0 72 . 0 79 . 1 . 0029 . 0 exp 8 . 17 1 . 98 T
Oxide : thickness: 25 µm; Temperature at entry : 900°C;
Mechanical properties : Eox = 145 GPa; ox = 0.3 ; crit = 600 MPa ;
Delamination not activated here (thin oxide assumed very adherent).
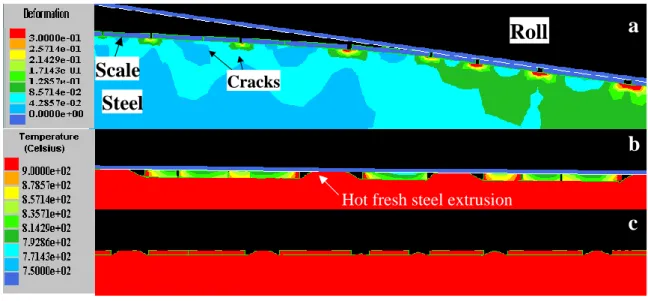
As expected [1], breaking of the oxide layer occurs even before the roll bite, because of the tensile stress associated with the bending of the surface there (figure 3a). Transverse cracks open in a quasi-periodic way : each crack opening relaxes the surrounding stress, until further advance has created enough stress for the criterion (equation 4) to be met.
In the bite, cracks opened before entry tend to open more widely and fresh metal is “micro-extruded” in the gaps between the fragments (figure 3b,c), in accordance with the results obtained before by [1]. Note that this requires extremely fine elements at the corners of the oxide scale fragments. This adds to the difficulty of such two-scale simulations where the whole strip is 20 mm thick and the oxide layer is 1000 times thinner (meshes are non-coincident at the interface).
In the present study, fragmentation of the oxide scale within the roll bite has been forbidden. It is highly probable that such cracks open not only by longitudinal tensions,
but rather by multi-fragmentation under local indentation by roll roughness peaks. It is indeed well known in practice that the rolled-in scale defects occur preferably with used rolls, where transfer of oxide particles has created sharp asperities.
The following paragraphs are devoted to the determination of the mechanical properties (including fracture) of oxide scales.
3 Description of the Four-Point Hot Bending Tests (4PHBT)
3.1 Experimental device and conditions
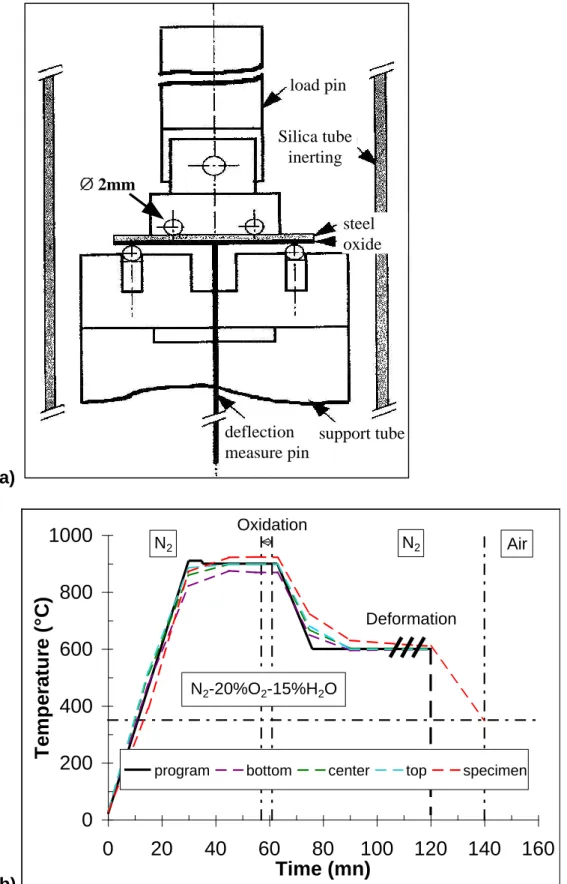
4PHBT have been performed under controlled atmosphere at Arcelor Research. Briefly (see [9] for details), a temperature and humidity cycle is imposed to mimic the conditions encountered near a rolling mill : the material is heated in N2 up to 900°C,
then air with 15% H20 is introduced for 4 to 8 minutes depending on the desired oxide
thickness, then N2 is flooded again while the material is brought down to the test
temperature (600°C, 700°C, 800°C or 900°C), then deformed (figure 4b). A 70 to 100 µm thick layer (> 95% FeO) is thus built during the second stage of this chemo-thermo-mechanical treatment, on the lower side only, which is in tension ; the other side is protected by a 1 to 2 µm-thick Cr / Cr2O3 layer. Systematically, a reference test is
performed on a non-oxidised sample (i.e. air + H20 is not introduced) before tests on
the oxidised sample.
The specimens are 50 mm long x 8 mm wide x 1 mm thick. The 4PHBT central device consists in four 2-mm-radius alumina rolls, the upper (central) ones 20 mm apart, the lower (external) ones 40 mm apart. The ram velocity is most of the time 1 mm/minute (0.0167 mm.s-1), but tests at 20 mm/minute (0.333 mm.s-1) and 200
mm/minute (3,33 mm.s-1) have also been performed. Note the very small plastic strain ( < 5. 10-3) and strain rate ( 5 1 2
10 4 . 1 10 . 7 s ) range.
The force – displacement curve is continuously recorded. The central deflection is measured by an alumina pin connected to a LVDT transducer. The whole system is enclosed in a silica vessel flooded by the gases mentioned above. On occasion, an Acoustic Emission (AE) device is added; the transducers are located on the deflection measurement pin, in the cold section of the rig.
3.2 Measurements and interpretation
The behaviour of the oxide in the 4PHBT was found to be systematically brittle at 600°C. Transverse cracks are found on cross-sections of the bent sample examined in the Scanning Electron Microscope (SEM) (figure 5a). Note the somewhat porous oxide. At 700°C, low speed, the oxide undergoes bending (2 mm deflection) without cracking transversely, which is considered as a sign of a higher toughness of the oxide connected with a certain degree of plasticity. The interface appears delaminated; this is however considered to be an artefact due to the preparation of the sample for the SEM observation (in particular the retraction of the resin).
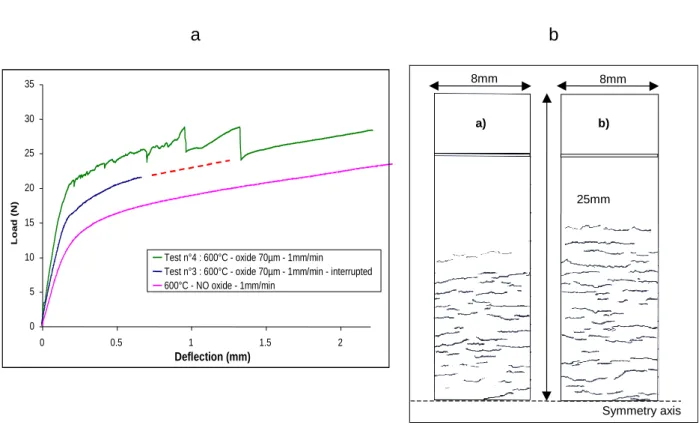
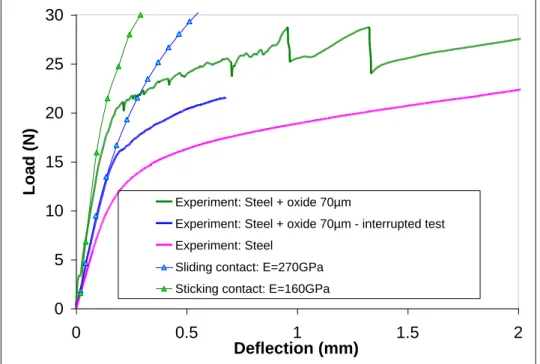
Figure 6a displays force-deflection curves. The lower one is for a non-oxidised sample. Oxidised specimens are more rigid, due to the 70 µm-thick hard oxide layer. Two samples (denoted n°3 and n°4) give rather different loads; the “softer” one gives a smooth curve (interrupted at 0.7 mm deflection for intermediate examination); the other curve is much rougher and shows three major “accidents”. Note however that both curve would apparently converge at higher strain (dashed line prolonging curve n°3); the interruption of test n°3 forbids to conclude, but other pairs of non-interrupted tests – not shown here - do confirm this impression.
The interpretation of the test will include determination of the critical stress for transverse fracture. This requires to identify the time of the first cracking, and numerically determining the stress in the oxide layer then. The question is : where should the fracture events be looked for on the load-deflection curve ? At the beginning, we thought that the major load drops where the required events, with oxide transverse fracture causing a drop in sample stiffness. However, looking at the sample surface (figure 6b), the same crack density was found on both n°3 (left) and n°4 (right) in spite of the very different load – and larger deflection for n°4. AE was installed on the rig to understand this apparent paradox. Some results are pictured in figure 7a (test n°3) and 7b (test n°4):
In both cases, AE events start at the very end of the initial linear (elastic) part of the curve, i.e. as soon as the substrate enters plastic deformation.
The major load drops in test n°4 are connected with events of much higher energy; again, this has been confirmed on several other curves.
Examination of the AE energy – duration – amplitude relations proved all these events to be of the same nature, i.e. cracks. We therefore concluded that two different kinds of cracks were present. Looking at the samples again, spalling of big oxide chunks at the roll / sample contacts were noticed on those samples with rough curves (figure 8). Our conclusion is that those curves have to be discarded since the investigated events (small transverse cracks as in figure 5a and 6b), although present, are hidden by much larger perturbing oxide spallings. Only those tests giving a smooth load deflection curve should be retained for analysis of the stress-strain relation and of the critical cracking stress (paragraph 4).
A question remains : what is there in these tests that causes spalling ? First, it is noticed that the load is systematically larger than in smooth curves. The oxide might be
harder and more brittle. However, it is clear that the elastic slope is also much larger, although the layers in e.g. tests n°3 and n°4 certainly have rather similar elastic constants. Numerical simulation was used to investigate the effect of several parameters. It turned out that friction may explain the difference. Figure 9 shows its influence : with a fictionless assumption, the rough curve n°4 can be fitted in its elastic part using an unrealistic Young’s modulus E = 450 GPa, whereas assuming sticking friction brings the fitting E down to 175 GPa (which is the value proposed by literature at 600°C [10]). Note that even the smooth test n°3 (“interrupted”) certainly undergoes rather high friction, since fitting without friction gives E = 270 GPa, too high by some 55% !
Our conclusion is therefore that the tests with rough curves are indeed perturbed by adhesion of the oxide scale to the alumina rolls, increasing the stiffness of the system and causing higher initial slope, higher plastic bending forces until spalling at the roll contact “relaxes” the system which returns to normal bending conditions (hence the convergence of all curves at high strain). In future work, this contact should therefore be protected by some lubricating or anti-seizure product. Moreover, it is concluded that hot bending is not an adequate way of measuring the elastic moduli, due to the particularly strong interference of friction in the elastic regime.
A second, quite important conclusion from these analyses is that transverse fracture of interest starts as soon as plastic deformation of the steel substrate occurs, at the transition from the linear to the non-linear part of the load – deflection curves. This is where the critical stress crit has to be determined using numerical simulation.
Interestingly, at that point, only Young’s moduli of the steel and oxide are necessary for this computation.
4 Identification of material behaviour
Identification of oxide mechanical properties is made by numerical simulation. As the steel substrate is also involved in the deformation process, its plastic characteristics are also needed. They are not available from the literature in this rather peculiar (low) strain and strain rate range. In paragraph 4.1, they are determined first for four steel grades (composition in table 1), using the non-oxidised samples.
As mentioned above, elastic constants are poorly determined by our 4PHBT, due to friction, for steel as well as for the oxide. They are drawn from literature.
For the oxide, viscoplastic (VP) parameters are determined first (paragraph 4.2), using non-cracked specimens (i.e. at 800°C and 900°C) to avoid interference of deformation and cracking in the identification process. Results are then extrapolated to lower temperatures. Then, using the final remark of paragraph 3 and the elastic parameters from the literature, the critical stress for cracking of the oxide is finally determined (paragraph 4.3) for cracked specimens, i.e. here at 600°C and 700°C.
4.1 Identification of steel behaviour
Using the non-oxidized sample load – deflection curve, constitutive parameters have been identified by a numerical inverse analysis method, detailed in [11]. At 600°C for ultra-low carbon steel ex-LC e.g. (table 1) :
m n
K. . with K = 307 MPa.s-m, n = 0.152, m = 0.1 (5)
is the von Mises equivalent stress. Figure 10 shows a rather good agreement between experimental curves and those recalculated using the fitting parameters.
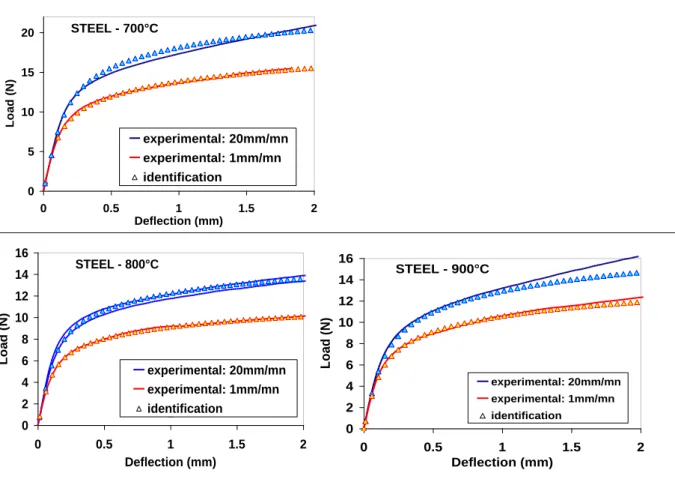
Note that identification was performed using only the curves at a ram speed of 0.0167 mm.s-1. The strain rate sensitivity exponent m was selected using other (large strain) data; nevertheless, the agreement remains correct when this constitutive equation is applied at 0.333 mm.s-1.
The full set of stress-strain curves for the four steel grades of table 1 is pictured in figure 11.
From the initial, elastic slope, assuming Poisson’s ratio = 0.3, E = 95 GPa is found at 600°C, whereas literature gives values in the range 150 - 170 MPa for similar grades. It must be noticed that quasi-identical, low values are found if the beam theory formula is used : 3 3 . . . 64 11 t w L d F E (6) (6)
F/d (force / deflection) is the initial slope, assumed elastic, L = 40 mm the distance between bottom (external) tools, w = 8 mm the width and t = 1 mm the thickness.
Therefore, the problem is not in the model; the reason for our too low values is not known (creep due to very low speed, insufficient test rig stiffness,...). Values from [12] are selected for the rest of the study :
4.2 Elastic-Viscoplastic (EVP) behaviour of the oxide
At temperatures where the absence of transverse cracks denotes a certain degree of plasticity (800°C, 900°C), the oxide is assumed elastic-viscoplastic. From [10], the Young’s modulus of the oxide (supposed independent of the steel grade) is taken as :
Esteel ≈ 175 Gpa at 600°C, 164 Gpa at 700°C, 153 Gpa at 800°C, 141 Gpa at 900°C. (8)
The plastic part is analysed according again to a power-law relation :
ox ox m n ox K MPa) . . ( (9)
The automatic, inverse FEM identification has been performed for the four steel grades. However, analysis is best presented in terms of the oxide-to-steel yield stress ratio, or ratio of Vickers hardness numbers Hv(ox) / Hv(steel). This is based on the observation that the curves for the oxidised and non-oxidised samples are generally almost parallel, betraying a rather similar strain dependency. This ratio strongly depends on temperature and strain rate however. One of the advantages of using the hardness ratio is that it allows comparison with results of [13], obtained by hardness testing (figure 12a), which show that the hardness ratio is close to 3 up to 800°C, and decreases thereafter to reach 1 around 1000°C (hence the “lubricating“ role of the iron oxides at higher temperatures [14]). Good agreement is found when the highest speed 4PHBT are considered (i.e. = 1.4 10-2 s-1 , a value similar to the estimated strain rate during a Vickers hardness test). The influence of the strain rate is considerable.
It is then necessary to obtain values at lower temperature / higher strain rate, i.e. under conditions where samples are cracked. Indeed, fracture and plasticity of the
oxide are in competition during the deformation of the oxide + steel system, and both types of characteristics must be know. The Hv(ox) / Hv(steel) curve of [13] is used for this purpose as a guideline (figure 12b) : extrapolation is done such as to give every Hv(ox) / Hv(steel) curve at various speeds for various steel grades the same shape (proportional to the curve of [13]). The values of Hv(ox) / Hv(steel) thus found are used to compute the corresponding Hv(ox), knowing Hv(steel) from figure 11. Finally, the consistency Kox is deduced, since nox = nsteel has been assumed (see above).
4.3 Critical cracking stress of the oxide
AE allowed the onset of cracking to be determined near the end of the elastic regime; the stress in the oxide layer at that point was computed and affected to crit,
thanks to the known elastic moduli of the steel and oxide (equations 7-8).
Figure 13 shows that fracture strongly depends on temperature, but also to a certain extent on strain rate. At 600°C, cracks are found at 2 mm deflection whatever the speed. At 800°C or 900°C, ductile deformation was experienced whatever the velocity. At 700°C however, tests at 1 mm.min-1 did not show any transverse crack ; upon increasing the speed to 20 mm.min-1( 3 1
10 4 .
1 s
), cracks were found again. This velocity-dependence is attributed to the viscoplastic character introduced in the constitutive equations for the oxide (equation 9) : relaxation by creep has time to occur at low speed, but not at higher speed where the critical stress is reached. Figure 13 shows also that critical fracture stresses computed as described above compare well with experimental values from [5].
Several steel grades have been studied. The fragile / ductile transitions are rather similar in the velocity / temperature diagram. Differences in ductility however show up by the density and the nature (transverse / interfacial) of the cracks.
Figure 14b-e compare experimental and computed crack densities. At low speed (1 mm/minute), the computation somewhat overpredicts density; note also that 2D numerical simulation necessarily creates full-width transverse cracks, whereas real cracks are interrupted, so that their density is not easy to define. As a consequence (figure 14a), numerical simulation leads to a more profound decrease of the mechanical properties.
At the largest speed however (200 mm/minute), the predicted density is in quite a good agreement with the experimental ones, under conditions such that viscoplastic relaxation has no time to take place. Also note that both experimental and computed cracks extend through the width of the samples.
Analyzing the tension stress and the interfacial shear stress under an existing oxide raft (thickness hox), Agrawal and Raj [7] suggest that the critical crack distance below which
delamination replaces transverse fracture is :
crit crit ox
c h
d . . (10)
Other authors [4] propose dc k.hox. crit crit where 2 < k < 4 to account for stress
relaxation by creep. At 600°C for instance, crit = 75 MPa (figure 13, blue curve),
supposed not to depend on speed. As there is no evidence of delamination, assume that the interfacial toughness crit is to be replaced by the shear stress of the ductile
metal (i.e. the maximum possible tangential stress at the interface). From figure 11, the yield stress of steel ex-LC at 600°C and 5 1
10 .
7 s
is 55 MPa, i.e. crit = 55/√3 = 32 MPa. This gives an inter-crack distance of 7.4 hox = 0.5 mm, which is not inconsistent
with figure 6b. At the highest speed 200 mm/min, the strain rate has increased by a factor 200, so that the shear yield stress of the metal ( crit) increases by a factor of
2000.1 = 1.7; as crit is assumed constant, the crack density is multiplied by 1.7, again in
reasonable agreement with the experimental results (figure 14).
From figure 13, it can finally be concluded that the four steel grades show little difference in their oxide to metal hardness ratio; the same has been found for transverse crack density. On the contrary, significant differences have been experienced in terms of oxide adhesion, which suggests that the nature and composition of the interphases between steel and oxide are more sensitive to steel composition than those of the oxide itself, which is not unexpected.
5 Conclusions
The present study has demonstrated a methodology to identify mechanical properties (small strain plastic parameters and fracture stress) of thick, brittle layers or coatings using the 4PHBT. Acoustic emission and numerical simulation have proved useful complements to avoids traps laid by unexpected phenomena such as adhesion and friction with tools, which should also be combated because it prevents elastic modulus identification.
The test has been applied to oxide scales at high temperature, in view of a study of the finishing hot strip mill. It has been shown that toughness (i.e. small strain plasticity) increases with temperature, with a transition around 700°C as expected [1].
Embrittlement of the oxide by high strain rate was also found of major importance as in [4], probably due to oxide creep relaxing stresses at very low speeds.
Other results, not shown here, have been obtained by tension tests at higher strain and strain rates, close to those prevailing at bite entry in rolling. At 1% elongation, transverse cracks were always observed on the oxide, even at 800°C or 900°C; moreover, at 2% elongation, delamination developed from the transverse cracks. This explains observations in hot rolling where cracks may be found although the surface temperature is high. These results moreover prove the importance of using several mechanical tests to cover all relevant deformation conditions with a good control.
It must be emphasized that rather thick oxide layers have been studied here : 70 or 100 µm, whereas the oxide of interest in the finishing mill is 10 to 30 µm thick. This is to improve the sensitivity of the test to the oxide mechanical properties. Thinner layers could perhaps be studied without jeopardizing sensitivity, by decreasing proportionally the metal thickness. The test rig should then be adapted to much lower loads.
The feasibility of numerical simulation of rolling with oxide fracture and the resulting metal micro-extrusion has been proved. A parametric study displaying the effects of temperature, oxide thickness and mechanical properties, and other parameters on the crack occurrence, crack density and critical rolling conditions is on its way; results will appear in a future paper.
Finally, fracture may go on inside the roll bite, as analyzed e.g. in [15]. Preliminary results by the Plane Strain Compression Test (PSCT) with smooth tools show that the more compressive conditions there do not favour cracking by elongation, as in the pre-bite area; it is however not impossible. But roll roughness may cause punching in of the oxide into the metal and indentation cracking ; it is indeed well known that degraded roll surface is a major cause of rolled-in scale. This will be the subject of future work.
References
[1] M. Krzyzanowski, J.H. Beynon: Oxide behaviour in hot rolling, in J.G. Lenard: ”Metal forming science and practice”, Elsevier, Amsterdam (2002), 259-295.
[2] Y.H. Li, C.M. Sellars: Modelling deformation behaviour of oxide scales and their effects on interfacial heat transfer and friction during hot steel rolling, in : Proc. 2nd Int. Conf. on Modelling of Metal Rolling Processes (The Institute of Materials, London, 1996) 192-201
[3] M. Schütze: Mechanical properties of oxide scales, Oxid. Met. 44 n°1-2, (1995) 29-60
[4] M.M. Nagl, W.T. Evans, D.J. Hall, S.R.J. Saunders : The failure of iron oxide scales at growth temperature under tensile stress. J. Phys. IV (Colloquium C9,1994) 933-941
[5] P. Hancock, J.R. Nicholls : Application of fracture mechanics to failure of surface oxide scales. Mat. Sci. Technol. 4 (1988) 398-406
[6] M.M. Nagl, S.R.J. Saunders , W.T. Evans, D.J. Hall : the tensile failure of nickel oxide scales at ambient and at growth temperature. Corr. Sci. 35, 5-8 (1993) 965-969
[7] D.C. Agrawal, R. Raj : Measurement of the ultimate shear strength of a metal-ceramic interface. Acta Met. 37, 4 (1989) 1265-1270
[8] A. Abdul-Baqi, E. Van der Giessen: Numerical analysis of indentation-induced cracking of brittle coatings on ductile substrates, Int. J. Solids Structures 39 (2002) 1427-1442.
[9] B. Picqué : Experimental study and numerical simulation of iron oxide scales mechanical behaviour in hot rolling. PhD Thesis, Ecole des Mines de Paris (2004)
[10] R. Morrel : Handbook of properties of technical and engineering ceramics. HSMO, London (1987)
[11] B. Picqué, Y. Favennec, A. Paccini, V. Lanteri, P.O. Bouchard, P. Montmitonnet : Identification of the mechanical behaviour of oxide scales by inverse analysis of a hot four point bending test, in M. Pietrzyk, Z. Mitura & J. Kaczmar (eds.): Proc. ESAFORM 5, Akapit, Krakow, 2002, 187-190
[12] J.D. Fletcher, Y.H. Li, J.H. Beynon, C.M. Sellars : The influence of surface conditions in hot forming determined by ring upsetting : a numerical and experimental investigation. Proc. Instn. Mech. Engrs. 212 J (1998) 453-465
[13] G. Vagnard, J. Manenc : Etude de la plasticité du protoxyde de fer et de l’oxyde cuivreux. Mem. Et. Sci. Rev. Mét. 61, 11 (1964) 768-776
[14] L.H.S. Luong, T. Heijkoop : The influence of scale on friction in hot metal working. Wear 71 (1981) 93-102
[15] H.R. Le, M.P.F. Sutcliffe, P.Z. Wang, G.T. Burstein : Surface oxide fracture in cold aluminium rolling. Acta Mat. 52 (2004) 911-920
Figure 1: breaking of oxide scale layer into a quasi periodic crack pattern after rolling [2].
a b
Figure 2: illustration of the normal (a) and tangential (b) stress – displacement relations. In (a), dashed lines represent the standard contact penalty technique, the mixed line is the added bilateral to unilateral transition; arrows follow a typical separation process.
c (=µ. n) crit t (V2-V1).t=0 or n> 0 (V2-V1).t 0 and n 0 c (=µ. n) crit t (V2-V1).t=0 or n> 0 (V2-V1).t 0 and n 0 Kp d0 adh n n Kp d0 adh Kp Kp d0 d0 adh n n
Roll
Steel
a
b
c
Scale
CracksHot fresh steel extrusion
Figure 3: fracture of the oxide layer before the roll bite (a) and subsequent micro-extrusion shown just before (b) and after (c) bite exit.
a) steel oxide load pin deflection measure pin support tube Silica tube inerting 2mm b)
0
200
400
600
800
1000
0
20
40
60
80
100
120
140
160
Time (mn)
T e m p e ra tu re ( °C )program bottom center top specimen
Deformation Oxidation
N2 N2 Air
N2-20%O2-15%H2O
Figure 4 : experimental set-up (a) and chemo-thermomechanical test cycle (b). The 4 dashed lines in (b) represent thermocouple measurements at 4 different locations.
steel Oxide scale a Oxide scale Steel Interface decohesion b
Figure 5 : examples of iron scale cross sectional micrographs (SEM) for Extra Low Carbon steel (ex-LC). Deflection 2 mm, speed 0.016 mm.s-1.
a) 4PHBT at 600°C;
b) 4PHBT at 700°C. Interfacial decohesion is thought to have initiated during specimen preparation for the SEM.
a b 0 5 10 15 20 25 30 35 0 0.5 1 1.5 2 Deflection (mm) L o a d ( N)
Test n°4 : 600°C - oxide 70µm - 1mm/min Test n°3 : 600°C - oxide 70µm - 1mm/min - interrupted 600°C - NO oxide - 1mm/min
Figure 6 : 4PHBT results.
a) force-deflection curves, steel grade ex-LC, low speed. Compare non-oxidized and oxidized samples.
b) crack networks at the end of test n° 3 (0.7 deflection, a) and of test n° 4 (2 mm deflection, b) a) b) 25mm 8mm 8mm m Symmetry axis
0 5 10 15 20 25 30 35 0 0.2 0.4 0.6 0.8 1 1.2 deflection (mm) lo a d ( N ) 25 35 45 55 65 75 a m p li tu d e Load curve AE events amplitude a 0 5 10 15 20 25 30 35 0 0.2 0.4 0.6 0.8 1 1.2 deflection (mm) L o a d ( N ) 0 10 20 30 40 50 60 70 En e rg y ( V .s ) Load curve AE events energy b
Figure 7 : Acoustic emission results during 4PHBT (steel grade ex-LC, low speed; same tests n°3 and 4 as figure 6).
a) superposition of load-deflection curve and AE events, test n°3. Occurrence = pink dots on the curve; amplitude = red crosses.
Figure 8: Observation of oxide degradation at tool / sample contact.
Red box: test n°3. Sliding contact between tools and scale : no damage. Blue box: test n°4. Sticking contact: crackling and interface cracks.
0 5 10 15 20 25 30 0 0.5 1 1.5 2 Deflection (mm) L o a d ( N )
Experiment: Steel + oxide 70µm
Experiment: Steel + oxide 70µm - interrupted test Experiment: Steel
Sliding contact: E=270GPa Sticking contact: E=160GPa
Figure 9: Impact of friction and adhesion on Young’s modulus identification from the initial part of load-deflection curves. Ex-LC grade, 1mm/min, 600°C. Lines with triangles are computational results. The experimental oxidized tests are the same as in figure 6, tests n°3 and 4 (nominally identical).
STEEL - 700°C 0 5 10 15 20 0 0.5 1 1.5 2 Deflection (mm) L o ad (N ) experimental: 20mm/mn experimental: 1mm/mn identification STEEL - 800°C 0 2 4 6 8 10 12 14 16 0 0.5 1 1.5 2 Deflection (mm) L o a d ( N ) experimental: 20mm/mn experimental: 1mm/mn identification STEEL - 900°C 0 2 4 6 8 10 12 14 16 0 0.5 1 1.5 2 Deflection (mm) L o a d ( N) experimental: 20mm/mn experimental: 1mm/mn identification
Figure 10: Comparison between experimental load-deflection curves and those computed using the identified consitutive parameters. Ex-LC steel grade, non oxidized.
0 10 20 30 40 50 60 70 80 90 0 0,002 0,004 0,006 0,008 0,01 Strain S tr e s s ( M P a ) Ex-LC 600°C Ex-LC 700°C Ex-LC 800°C Ex-LC 900°C ReP 600°C ReP 700°C ReP 800°C ReP 900°C ReN 600°C ReN 700°C ReN 800°C ReN 900°C DWI 600°C DWI 700°C DWI 800°C DWI 900°C
Figure 11 : Stress-strain curves of the four steel substrates for 5 1 10 .
7 s
.
0 0.5 1 1.5 2 2.5 3 3.5 4 600 700 800 900 1000 Temperature (°C) H v (o x ) / H v (s te e l) 0 0.5 1 1.5 2 2.5 3 3.5 4 H v (F e O ) / H v (F e ) [V a g n ] ReP-200mm/mn ReP-50mm/mn ReN-200mm/mn ReN-50mm/mn ReN-1mm/mn DWI-200mm/mn DWI-1mm/mn Ex-LC-20mm/mn Ex-LC-1mm/mn Hv (FeO/Fe) a) 0 0.5 1 1.5 2 2.5 3 3.5 4 600 700 800 900 1000 Temperature (°C) H v (o x ) / H v (s te e l) 0 0.5 1 1.5 2 2.5 3 3.5 4 H v (F e O ) / H v (F e ) [V a g n ] Hv (FeO/Fe) Ex-LC-200mm/mn Ex-LC-20mm/mn Ex-LC-1mm/mn Extrapolation Experiment b)
Figure 12 : Hardness ratio between oxide scales and their respective steel substrates. Composition and grades : see Table 1.
a) Evolution as a function of steel grade, temperature and strain rate. b) Extrapolation of hardness ratios, for damaged specimens.
0 50 100 150 200 250 300 350 500 600 700 800 900 1000 Temperature (°C) P rinci pal S tr e ss ( MPa) 1mm/mn 20mm/mn 200mm/mn No cracks in our tests Cracks in our tests Hancock Critical stress AE+simulation critical stress Extrapolated critical stress
Figure 13 : critical fracture conditions as a function of speed and temperature, grade ex-LC, 100 µm thick oxide. The 3 black curves are stresses in the oxide layer, computed without fracture, at 2 mm deflection, using the constitutive parameters identified. The blue curve is the fracture stress identified at those points of the load – deflection curve where AE firts detects cracks; the dotted part is extrapolated. The red curve is deduced from the critical fracture strain model of Hancock & Nicholls [5].
0 5 10 15 20 25 30 0,0 0,5 1,0 1,5 2,0 Deflection (mm) L o a d ( N )
Exp: Steel only
Exp: Steel + oxide 70µm - interrupted test Exp: Steel + oxide 70µm
Simul: Steel only
Simul: Steel + oxide - without damage Simul: steel+oxide with damage
a
b) c) d) e)
Figure 14: four-point hot bending test, ultra-low carbon steel Ex-LC, 600°C. (a) experimental and theoretical load – deflection curves;
(b) computed crack mapping of oxidized samples, 200 mm.min-1; (c) experimental crack mapping of oxidized samples, 200 mm.min-1; (d) experimental crack mapping of oxidized samples, 1 mm.min-1; (e) computed crack mapping of oxidized samples, 1 mm.min-1.
Table 1: Steel grades composition (x10-3 % in weight) measured by thermo-gravimetry C Mn P S Si Al Ni Cr Cu Nb Ti N Ex-LC 50 250 11 15 35 DWI 1.6 210 8.5 11 5.1 32.4 17.8 19 10 0.2 2.6 Re-Nitrided (ReN) 69.4 306 11 8.5 8.8 13.4 16.4 21.7 6.7 0 14.4 Re-Phosph. (ReP) 60 654 33.7 12.7 87.7 46.1 17.6 18.1 11.8 0.2 3 3.9
![Figure 1: breaking of oxide scale layer into a quasi periodic crack pattern after rolling [2]](https://thumb-eu.123doks.com/thumbv2/123doknet/11616552.303851/23.892.290.669.123.375/figure-breaking-oxide-scale-layer-periodic-pattern-rolling.webp)