HAL Id: halshs-00565205
https://halshs.archives-ouvertes.fr/halshs-00565205
Preprint submitted on 11 Feb 2011
HAL is a multi-disciplinary open access archive for the deposit and dissemination of sci-entific research documents, whether they are pub-lished or not. The documents may come from teaching and research institutions in France or abroad, or from public or private research centers.
L’archive ouverte pluridisciplinaire HAL, est destinée au dépôt et à la diffusion de documents scientifiques de niveau recherche, publiés ou non, émanant des établissements d’enseignement et de recherche français ou étrangers, des laboratoires publics ou privés.
countries
Andrew E. Clark
To cite this version:
Andrew E. Clark. The organisational commitment of workers in OECD countries. 2011. �halshs-00565205�
WORKING PAPER N° 2011 - 06
The organisational commitment of
workers in OECD countries
Andrew E. Clark
JEL Codes: J21, J28, J3, J6, J81, L26
Keywords: commitment, reciprocity, well-being
P
ARIS-
JOURDANS
CIENCESE
CONOMIQUES48,BD JOURDAN –E.N.S.–75014PARIS TÉL. :33(0)143136300 – FAX :33(0)143136310
www.pse.ens.fr
CENTRE NATIONAL DE LA RECHERCHE SCIENTIFIQUE –ECOLE DES HAUTES ETUDES EN SCIENCES SOCIALES ÉCOLE DES PONTS PARISTECH –ECOLE NORMALE SUPÉRIEURE –INSTITUT NATIONAL DE LA RECHERCHE AGRONOMIQUE
The Organisational Commitment of
Workers in OECD Countries
Andrew E. Clark
*Paris School of Economics and IZA
January 2011
Abstract
The degree to which workers identify with their firms, and how hard they are willing to work for them, would seem to be key variables for the understanding of both firm productivity and individual labour-market outcomes. This paper uses repeated cross-section ISSP data from 1997 and 2005 to consider three of measures of worker commitment. There are enormous cross-country differences in these commitment measures, which are difficult to explain using individual- or job-related characteristics. These patterns do, however, correlate with some country-level variables. While unemployment and inflation are both associated with lower commitment to an extent, economic and civil liberties are positively correlated with worker effort and pride in the firm.
Keywords: Commitment, Reciprocity, Well-being. JEL Codes: J21, J28, J3, J6, J81, L26.
*
PSE, 48 Boulevard Jourdan, 75014 Paris, France. Tel.: +33-1-43-13-63-29. E-mail: [email protected]. I am extremely grateful to two anonymous referees for comments which helped to structure this paper, CEPREMAP for financial support, Peter Warr for comments, John Helliwell for help with the macro data, and Simona Baldi for excellent research assistance. I also wish to thank seminar participants at the Festival Internazional del Lavora (Rome), the 1st International Conference on Labor Market and the Household (Turin) and the Job Satisfaction Revisited conference in Dubrovnik for helpful suggestions.
The Organisational Commitment of
Workers in OECD Countries
1. Introduction
There is a literature without number dealing with the issues of employee performance and worker motivation. We here consider something that has perhaps attracted less empirical attention, at least in Economics: the commitment that workers express vis-à-vis their employer. Workers’ organisational commitment can be defined as the relative strength of an individual’s identification with and involvement in a particular organization (Bishop et al., 2000), or as a mixture of a) a strong belief in and acceptance of the organization’s goals and values, b) a willingness to exert considerable effort on behalf of the organization, and c) a strong desire to maintain membership in the organization (Mowday et al., 1979).
While research on worker productivity has identified a number of important factors, it is undoubtedly true that the largest part of workers’ effort, and thus their productivity at work, remains to be explained. Understanding the nature of the relationship between the worker and the firm would seem to be important in this context. In addition to any positive effect on firm outcomes (productivity, quits), a feeling of commitment at work is also likely to be important in the context of worker well-being. In addition to simply being satisfied at work, individuals may value the interest, recognition and competence involved in their job.1 Some of the results that we consider below will indeed show that worker commitment and job satisfaction are not synonyms.
In this context, instead of appealing to information on wages, incentive packages, hours of work, or other observable characteristics of the work "package" to describe the quality of the firm-worker relationship, we here consider novel information, currently available for a
1
This bears some parallels to the distinction between hedonic measures of well-being and eudaimonic measures, where the latter refer to elements such as mastery, relations with others, self-acceptance and purpose. The recent third wave of the European Social Survey contained both types of measures (see Huppert et al, 2009).
number of OECD countries at three different points in time, on the degree of identification that workers report with respect to their firms. The approach taken will thus be subjective: to measure commitment, I will use the answers given by individuals to questions asking them explicitly to evaluate the extent to which they identify with their firm.
Although there is nothing like a consensus in Economics about the useful of such subjective measures, it is fair to say that it is not otherwise immediately obvious how worker commitment could be measured. A defence of subjective measures has equally been mounted by showing that they are able to predict individuals’ future behaviours. A flourishing literature in Psychology has examined the links between measures of job satisfaction or employee engagement, on the one hand, and firm performance on the other (where this latter includes profitability, productivity, turnover and absenteeism): see, for example, Patterson et
al. (2004) and the meta-analyses in Harter et al. (2002 and 2006) and Judge et al. (2001). One
criticism of subjective questions is that the answers to them are so coloured by individual idiosyncrasies as to render the answers incomparable in cross-section data. However, the fact that observable behaviours can be predicted from such cross-section distributions suggests that the latter do contain at least a certain amount of comparable information.
Worker commitment has also been the subject of a large literature in Organizational Behaviour. The work here has underlined the many different types of commitment that individuals may express in the domain of work, and that these seem to reflect different phenomena. While affective commitment refers to a worker’s emotional attachment to the workplace, continuance commitment rather reflects the costs to the worker of leaving their current job, and normative commitment the worker’s feeling of being obliged to stay. Commitment may also be expressed relative to the individual’s current employer, or to their current occupation or even with respect to union membership. Useful summaries of some of these measures are provided in Cooper-Hamik and Viswesvaran (2005) and Meyer et al. (2002). These two papers also carry out meta-analyses of organizational commitment. In
particular, these analyses underline that commitment and job satisfaction are not the same variable, and that commitment is correlated with a number of job outcome variables measuring turnover and employee performance.
The current paper addresses the issue of worker commitment by providing a systematic analysis of three related questions that are found in International Social Survey Programme (ISSP) data. One of the advantages of doing so is that harmonised questions on commitment are asked of workers in a number of different countries. This allows us to investigate systematic differences in organizational commitment between countries. We do indeed find sharp differences, ceteris paribus, in worker commitment between countries. One interpretation is that these are not “real” differences and instead just pick up differences in response style between cultures and languages; the alternative is that some countries do have more committed workers than do others. Given the conclusions from the literature that commitment is associated with better worker performance (and higher well-being scores, and lower stress), country differences in commitment may then be associated with the country patterns of macroeconomic and social outcomes, and would then seem to be crucial objects of study.2 In this case we would like to know why some countries have systematically more committed workers than do others. While this paper will underline some correlations in this regard, it will not be able to provide a full causal model of cross-country differences in commitment.
The remainder of the paper is structured as follows. The next section presents the ISSP commitment data, and Section 3 carries out regression analyses, relating commitment scores to a standard set of individual controls, plus country and year dummies. The coefficients on the year dummies are both large and very significant. Section 4 sets itself the task of trying to explain why worker commitment is so different between countries, and attempts to provide an
2
Cooper-Hamik and Viswesvaran (2005) suggest that with globalization the link between commitment and worker performance may even have become stronger over time.
answer via additional individual-, job- and macro-level variables. Finally, Section 5 concludes.
2. Measuring Worker Commitment
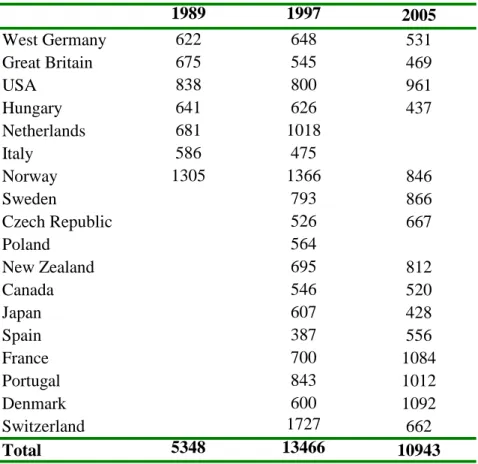
This section covers the general issue of worker commitment to their employer, analysed using repeated cross-section data over a number of countries. The data here come from two waves of the International Social Survey Programme (ISSP: see http://www.issp.org/).3 Many different countries are present in the ISSP datasets, with the number of countries tending to grow over time. The analysis of worker commitment is based on the OECD countries which are found in the “Work Orientations” waves of the ISSP. These latter took place in 1989, 1997 and 2005, and contain a great deal of both objective and subjective cross-country information about individuals, the types of jobs that they do, and (crucially for the exercise at hand) a large number of subjective evaluations of different aspects of their job. Unfortunately, there is no consistent series of job-commitment questions asked over all three of the waves. We here choose to analyse workers' answers to questions on workers being willing to exert discretionary effort to help their firm, being proud of their firm, and being ready to turn down higher wages to stay there.4 These questions are available with the same wording in the 1997 and 2005 ISSP waves.5 A related discretionary effort question, but differently-worded, appears in the 1989 and 1997 waves. Table 1 shows the distribution of OECD countries, together with the number of employees interviewed, in these three Work Orientation waves of
3
The ISSP samples were mostly stratified, and designed to be representative of adults (aged 18 or over) living in non-institutional accommodation. The mode of administration was most often face-to-face. There are a number of differences between countries in this respect. Details regarding the questionnaire, sampling, and data collection are available in the Study Monitoring Report for each ISSP wave. That for 2005, for example, is available via the following web page: http://www.gesis.org/en/services/data/survey-data/issp/modules-study-overview/work-orientations/2005/.
4
By "workers" here we mean employees, and drop the self-employed from the analysis. 5
the ISSP.6 There are 18 OECD countries that appear in at least one of the waves; 15 appear in both the 1997 and 2005 waves, and Italy, the Netherlands and Poland are present in the 1997 dataset, but not that of 2005.
The ISSP Work Orientations modules contain a number of questions that might be thought to inform us about worker commitment and feelings of reciprocity relative to the employer. The three main questions that we shall employ here appear in both the 1997 and 2005 ISSP waves. Workers are asked to what extent they agree or disagree with a number of statements about their job (where it is made explicit that reference is being made to the main job were the respondent to have more than one). The first three of these statements are:
1) “I am willing to work harder than I have to in order to help the firm or organization I
work for to succeed”.7
2) “I am proud to be working for my firm or organization”.
3) “I would turn down another job that offered quite a bit more pay in order to stay with
this organization”.
All three of these statements are answered on a five-point qualitative scale (Strongly
Agree, Agree, Neither Agree nor Disagree, Disagree, Strongly Disagree). In what follows we
will sometimes assign these five answers the values 5 through 1 respectively, so that higher values reflect a greater amount of worker commitment. These questions pick up information on workers’ commitment to their jobs that would seem to be extremely difficult to obtain by any other means. As such, we think that they are worthy of systematic analysis.
6
The ISSP samples were mostly stratified, and designed to be representative of adults (aged 18 or over) living in non-institutional accommodation. The mode of administration was most often face-to-face. There are a number of differences between countries in this respect. Details regarding the questionnaire, sampling, and data collection are available in the Study Monitoring Report for each ISSP wave. That for 2005, for example, is available via the following web page: http://www.gesis.org/en/services/data/survey-data/issp/modules-study-overview/work-orientations/2005/.
7
This question also appears in the survey of 30,000 employees of a large US multinational manufacturing firm over 19 countries in Freeman et al. (2008). The question is similar to variables used in Management to capture organizational commitment: see Jaworski and Kohli (1993). It could also, of course, reflect the employee’s effort to prevent the firm going bankrupt; however, even in this context, employees provide costly effort in order to improve the firm’s outcome.
The simple distribution of these three variables is depicted in Table 2. The responses to the first two of the questions (which we refer to as “effort” and “pride” are very similar, with over 60 percent agreeing with the proposition. The third question might be thought of as asking individuals to put a price on this reciprocity, by refusing a job with higher pay elsewhere. Here the replies are less positive, with less than thirty percent of respondents agreeing that they would act this way. The modal response is “Agree” for the first two questions, and “Disagree” for the third. This is reflected in the average replies, when we assign cardinal values of one to five to the responses in Table 2, which are 3.5, 3.7 and 2.6 respectively.
These three commitment measures are correlated between themselves, although not perfectly. The Pearson correlation between “work harder” and “proud” is just under 0.5, and the correlation between the former and “turn down higher pay” is 0.4. Last, the correlation between “proud” and “turn down higher pay” is 0.28. These are cardinal correlations, which imply that a score of four is exactly twice as high as a score of two. We can also calculate Spearman correlations, which treat the data ordinally. These give almost exactly the same results. The three measures of organizational commitment considered here are therefore not orthogonal to each other, but neither do they reflect exactly the same phenomena.
As well as the general distribution of these variables, we are also interested in their patterns over time and space. Table 3 addresses the first of these issues by reporting the (weighted) percentage of respondents who “Agree” or “Strongly Agree” with the three statements separately by sex and by year. These values are shown for the 15 OECD countries which participated in both the 1997 and 2005 waves of the ISSP. The asterisks show whether the changes from one ISSP wave to the next are significant.
There are some significant differences in this table, but overall the changes over time do not tell a particularly striking story. The percentage who agree that they would turn down another job that offered quite a bit more pay has increased for both men and women between
1997 and 2005. The percentage who say that they are proud of their firm increased slightly, but only significantly so (at the ten per cent level) for women. However, the percentage saying that they work harder than they have to help their firm has fallen for both sexes, and significantly so for men. The last line of Table 3 shows movements in overall job satisfaction. All employees in the ISSP are asked “How satisfied are you in your (main) job”? Answers are on a one-to-seven scale, where one means completely dissatisfied, and seven means completely satisfied. As analysed in Clark (2010), the percentage reporting high job satisfaction (very or completely satisfied on the one-to-seven scale) rose significantly by three percentage points for men, but only insignificantly so for women.
This job satisfaction variable is correlated with our three commitment measures but, as in the meta-analyses mentioned previously, less than perfectly so. The Pearson correlations between job satisfaction and “work harder”, “proud” and “turn down higher pay” are 0.31, 0.49 and 0.37 respectively (the Spearman correlation figures are very similar).
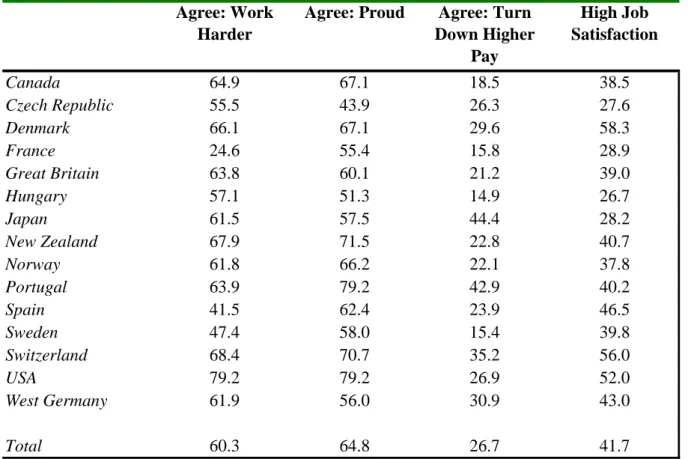
Table 4 presents the distribution of worker commitment by the fifteen OECD countries that are available in both the 1997 and 2005 ISSP waves. In contrast to the numbers in Table 3, here there are very sharp contrasts indeed. Regarding the provision of discretionary effort, the average score over OECD countries is 60%. At the top of the scale almost 80% of American employees agree that they are willing to work harder than they have to in order to help the firm. There then follows a group of countries at around the 65-70% mark, including a number of other Anglophone countries.8 At the other end of the distribution, both Spain and Sweden have scores of under 50%, and France is a notable outlier, with a score of less than 25%.9
8
Pfeffer (2007, p. 116) suggests that “Job attitudes, employee engagement, and work behaviour… are dismal in
the United States and the United Kingdom, and possibly elsewhere as well”. According to Table 4, they are
actually much worse elsewhere in this sample of OECD countries. 9
If we calculate the average score on the 1-5 scale, the USA has an average score of 4, with Spain, Sweden and France having scores of 3.1, 3.4 and 2.7 respectively.
The distribution with respect to the percentage who are proud of their job is somewhat tighter, but there is still almost a two to one difference between the top-ranked and bottom-ranked countries. The USA again tops the ranking, with a figure of almost 80%, whereas the bottom three places are occupied by the Czech Republic, Hungary and France. The percentage who would “turn down a job that offered quite a bit more pay in order to stay with this
organization” is highest in Japan and Portugal (both over 40%), and lowest in Hungary
Sweden and France (under 16%).10
In the last column of Table 4, the cross-country distribution of overall job satisfaction mirrors to some extent the pattern of worker commitment. The lowest job satisfaction countries are (in order) Hungary, the Czech Republic, Japan and France, while the highest job satisfaction countries (with over 50% of workers reporting job satisfaction of 6 or 7 on the 1-7 scale) are the USA, Switzerland and Denmark.
The numbers in Table 4 are based on the raw data, describing the experience of the average person in the economy. In terms of the time series, this average person is not the same over time. Equally, cross-country differences in average commitment may well reflect composition effects (with respect to the age, sex, education etc. of the workforce) rather than any underlying ceteris paribus difference in the way workers feel about their firm between countries. A first key empirical question is then the extent to which the time and country effects described in Tables 3 and 4 can be explained by typical demographic variables. This question is analysed in a standard way, by carrying out regression analyses of worker commitment, including individual demographic controls, as well as country and year dummies, as explanatory variables. The estimated coefficients on the year and country dummies will measure any systematic differences in worker commitment, conditional on the other right-hand side variables.
10
France in fact seems to do badly in a number of international comparisons. Senik (2010) notes that the French report exceptionally low well-being scores, particularly in the domain of work. Bonsang and van Soest (2010) suggest that France is something of an outlier, in the sense that income satisfaction scores should be higher given the actual incomes that the French earn.
A second question is, given the similarity between the country rankings in Table 4 above, whether commitment and satisfaction are pretty much synonyms for each other. We will investigate this possibility by comparing the country rankings of worker commitment with and without controlling for overall job satisfaction.
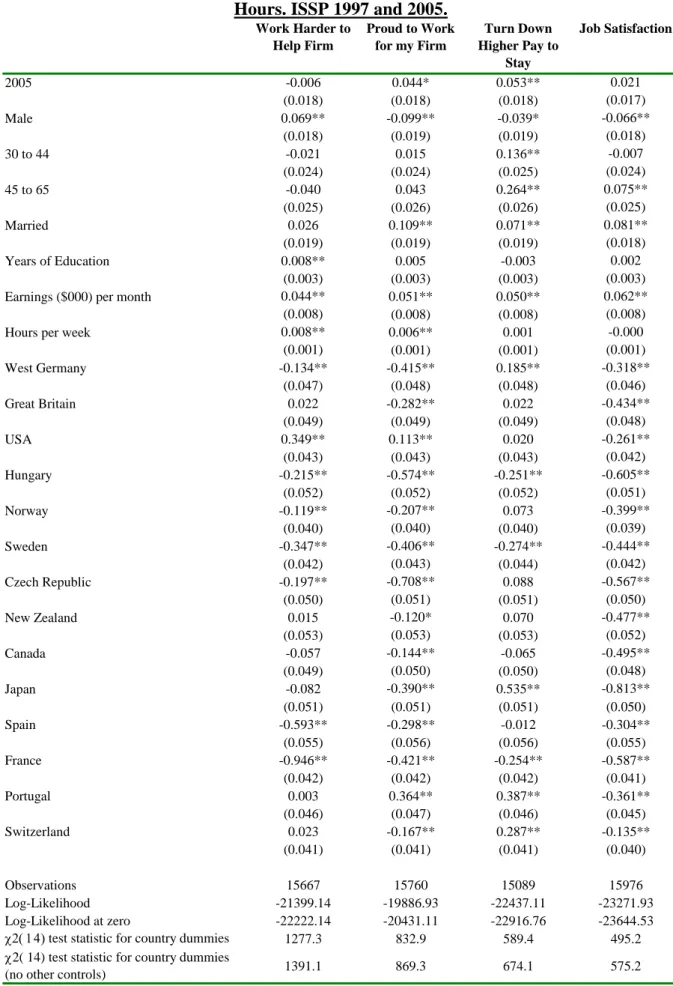
The regression analysis will be based on two separate specifications: one without and one with real monthly earnings11 and weekly hours of work as part of the right-hand side variables. The latter of these analyses therefore asks whether an employee with identical hours of work and real earnings would report different commitment scores in different countries, and as such isolates the role of earnings and hours in explaining cross-country differences in worker commitment. The regression analyses are presented in Section 3 below.
3. Worker Commitment: Regression Analysis
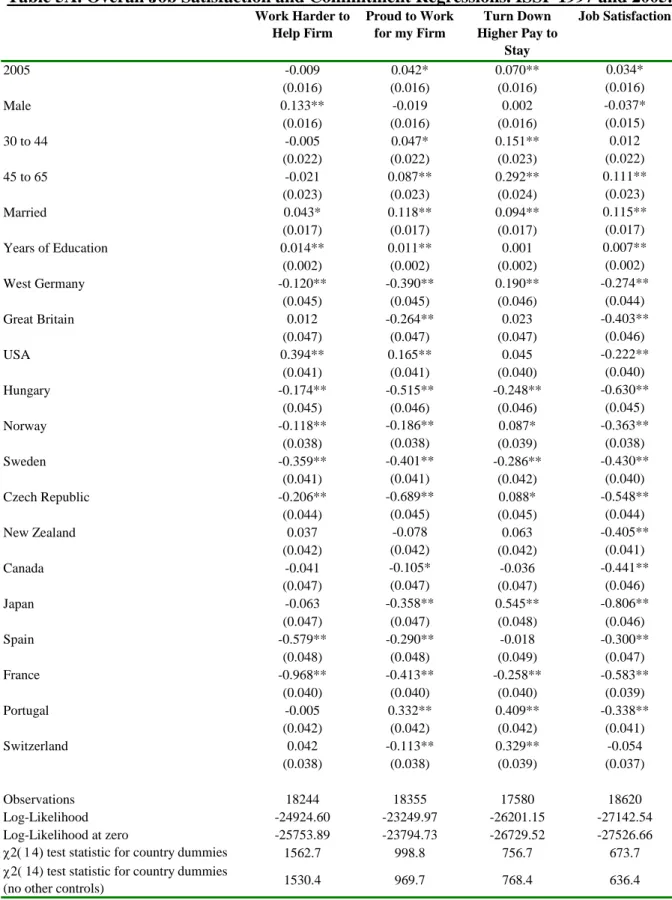
The regression results for worker commitment are presented in Tables 5A and 5B: the former does not control for individual worker earnings and hours, while the latter does. All of the regressions include a standard set of controls, including sex, age, marital status, education, and year and country dummies. Both tables are divided up into four columns. The first three show the regression results for the three commitment questions outlined in Section 2, while column four shows, for comparison purposes, the results of the estimation of a “standard” job satisfaction equation; all of these regressions are estimated using ordered probit techniques.
11
Respondent’s monthly net earnings, converted to US dollars using Purchasing Power Parities from the OECD (http://www.oecd.org/dataoecd/61/56/39653523.xls). All figures are expressed in real 1997 values by deflating for US CPI inflation (ftp://ftp.bls.gov/pub/special.requests/cpi/cpiai.txt). The following countries have their gross earnings converted to net:
1989 - GB, USA, Norway;
1997 - GB, USA, Norway, Sweden, New Zealand, Italy, Canada, Japan, France, Denmark, Switzerland 2005 - GB, USA, Norway, Sweden, New Zealand, Canada, Japan, France, Denmark, Switzerland. These conversions are all carried out using the OECD tax database
(http://stats.oecd.org/OECDStat_Metadata/ShowMetadata.ashx?Dataset=AWCOMP_OLD&ShowOnWeb=true &Lang=en). This provides data for 1997 to 2004. The 1997 tax rates were used to convert the 1989 and 1997 ISSP data from gross to net as necessary, and that from 2004 to convert the 2005 ISSP data.
The estimated coefficients on the standard control variables in Table 5A show that men say that they are more willing to work harder for their firm, although the estimated coefficients on male in the regressions in columns two and three are insignificant. The effect of age on worker commitment is positive and monotonic across the age groups. The married equally report higher scores in all of the commitment regressions.12 Last, years of education is positively and significantly correlated with worker commitment in Table 5A (except for reporting that they will turn down higher pay to stay with their current firm).13
Controlling for earnings and hours of work in Table 5B changes some of these correlations. That with education becomes weaker, suggesting that part of the partial correlation with education in Table 5A reflected the fact that the better-educated earn more. In addition, the coefficient on “Male” is more negative in Table 5B than in Table 5A, again suggesting that part of males’ higher commitment levels in the latter reflects their higher earnings.
The estimated coefficients on earnings itself in Table 5B is positive and significant: workers feel more reciprocity towards their firm when they are paid more. While this might be thought of as a vindication of efficiency wage theory, it is perhaps worth bearing in mind that the standard model requires higher wages in order to limit worker shirking. The dependent variable in column 1 is rather about the supply of discretionary effort, beyond what is required, where required effort probably includes that which is necessary to avoid being sacked. Equally, it is not clear whether the higher wages in an efficiency-wage model would be associated worker pride in their job, whereas this is what is suggested in column 2 of Table 5B.14
12
There is a possibility of reverse causality here, in that those who are able of being more reciprocal in general may be so with respect to their firm, and also have a better chance of getting (and staying) married.
13
These results tie in to an extent with those in the meta-analysis in Meyer et al. (2002), where commitment only has a weak correlation with gender overall, but that with age is positive and significant.
14
We here consider the absolute level of earnings. It is likely that individual effort and commitment to the firm depend on relative earnings as well. Clark et al. (2010b) provide evidence consistent with this, based on both an experimental approach and analysis of the 1997 ISSP data, and Brown et al. (2010) find that the worker’s relative wage (own weekly wage divided by the average weekly wage by industry and occupation) is a
The correlations with respect to hours of work (per week) are also all significant, and are positive: those with greater reported levels of reciprocity work longer hours of work per week. Although it is tempting to see this result as being at odds with that regarding pay, there is probably a reasonable amount of reverse causality present here: those who feel better about working for the firm are willing to work longer hours for that firm.
With respect to the time profile of worker commitment, inasmuch as we can measure it with data from only two ISSP waves, this is largely positive in both Tables 5A and 5B. To this extent, it has followed the upturn in job satisfaction noted in Clark (2010).
All of the estimated country coefficients should be read as relative to Denmark, which is the omitted category. Perhaps the most remarkable finding with respect to the country dummies in these tables is how similar they are to those found in the raw data in Table 4. With respect to worker effort (in the first column), the bottom four countries and five of the top six countries in Table 5A are the same as in Table 4; in Table 5B this holds for the bottom five and for the top seven countries.
The same story holds in columns 2 and 3, which show the results from ordered probit regression of feeling proud of one’s firm. The country ranking from this regression in Table 5A is very similar to that found in Table 4, with in particular the same six countries in the bottom positions and Portugal and the USA at the top. Equally, with respect to the regression for turning down higher pay elsewhere in order to stay at one’s firm, the bottom three and the top four countries are the same in Tables 4 and 5A.
This similarity is somewhat formalised by the test statistics at the foot of each column of Tables 5A and 5B. These show two statistics. The first tests the joint exclusion of all of the country dummies in the regression reported in the Table. The second tests the joint exclusion
significant predictor of worker commitment. Nagin et al. (2002) shows that the higher is the estimate of outside earnings, the less likely workers are to agree that the employer “cares about me,” and the more likely they are to say that the employer “takes advantage of me”. It would equally be of interest to consider the relationship between commitment and within-firm wage inequality, which is found to be negative in Lincoln and Kalleberg (1996).
of all of the country dummies in a regression with only the country dummies as explanatory variables. The comparison of these two test statistics shows how much of the country pattern in the raw data (as picked up in the second test statistic) is explained by the additional variables introduced into the regressions in Tables 5A and 5B. A quick glance at the figures shows that the two statistics are actually very similar in size. In other words, the demographic controls that we have introduced here actually explain very little of the cross-country distribution of reciprocity.
The next question we address is whether we gain more from the analysis of these three specific reciprocity questions than we would have learnt from a more general question regarding the individual’s evaluation of their job. This might be thought of as related to the debate over top-down and bottom-up measures of well-being. If the former applies, then any subjective evaluation of a work domain will be coloured by the individual’s overall evaluation of the job.15
To carry out this analysis, we construct dummy variables for the seven different job satisfaction values reported by individuals in the ISSP dataset. Six of these are then introduced as additional right-hand side variables in the regressions documented in Tables 5A and 5B. The results16 of these regressions first underline that the commitment measures are indeed strongly correlated with overall job satisfaction. All of the six job satisfaction dummies are significant in each regression, with t-statistics that are typically of around ten or over. Second, the introduction of job satisfaction does not drive the estimated country coefficients to zero, so that the country distribution of reciprocity is not just the cross-country distribution of job satisfaction. Last, the shape of this cross-cross-country distribution is almost unchanged by the introduction of controls for job satisfaction. The Pearson correlation between the estimated coefficients on the country dummies in Table 5A and those from the
15
And indeed the individual’s evaluation of their job may be coloured in the same way by their overall evaluation of their life.
16
equivalent regression including job satisfaction dummies is over 0.9 for all three regressions; the analogous Spearman rank correlation coefficients are also extremely high.17 The same analysis can be carried out with respect to the regressions that control for earnings and hours of work, without any change in the qualitative conclusions regarding the shape of the estimated country dummies.
The conclusion from this empirical analysis of ISSP data is then that a number of individual and job-related characteristics are correlated with worker reciprocity. There remain, however, very sharp differences in average reciprocity between OECD countries. Section 4 below concentrates on these cross-country differences and asks to what extent they are correlated with a number of individual, firm, economic and institutional variables.
4. Explaining the Country Distribution of Worker Commitment
Tables 5A and 5B above insisted above all on the sharp differences in worker reciprocity, on all three of the measures used here, between OECD countries.18 The regressions behind these tables controlled for a number of standard variables, such as sex, age and education. This section asks whether it is possible to find additional right-hand variables which will help to explain this distribution. This exercise is first carried out at the individual level, before moving onto a number of country-level macroeconomic and societal characteristics.
17
Mowdray et al. (1979) equally insist that commitment and job satisfaction are different constructs. 18
Coefficients can be significant but small: does this apply to cross-country differences? Gerhart and Fang (2005) and Gerhart (2008) make the point that country differences in such variables sometimes explain only a tiny amount of the overall variance. For illustrative purposes, the equations in Table 5A were re-estimated including only country dummies via OLS to produce an R-squared figure: this was 8.6%, 5%, 4.4% and 3.2% in columns one to four respectively. Whether these figures are large or small is open to debate. One potentially germane point here is that percentage of variance explained will necessarily fall with the amount of noise in individuals’ answers.
i) Religion
While the regressions in Tables 5A and 5B did control for standard individual right-hand variables, we can easily imagine others that might be thought to play a role. In particular, we know that the religious are more altruistic towards other individuals (Reinikka and Svensson, 2010): can this explain the prevalence of more reciprocal attitudes towards employers? To check, we re-estimated our standard regressions adding a measure of individual religiosity. In the ISSP, individuals are asked how often they attend religious services.19
The estimated results on the religion variables conform to expectations: the more often the individual attends religious services, the greater is their feeling of reciprocity with respect to the firm. This holds for all three measures of worker reciprocity with respect to the firm. Religion is indeed a fairly significant predictor of reciprocity: the chi-squared statistic for the exclusion of the religion variables is significant at better than the 0.01 percent level for all three reciprocity variables. However, this significance does very little in terms of explaining the country distribution of reciprocity: the correlation coefficient between the estimated country coefficients from regressions with and without religion is greater than 0.99 for all three measures.
ii) Job Characteristics
The first job characteristic we consider is whether the firm is in the public or the private sector.20 The results here are worthy of note. Public-sector workers are very significantly less likely to say that they are willing to work harder than they have to in order to help their firm or organization to succeed. However, they are significantly more likely to
19
The response scale is different in 2005 to those used in 1989 and 1997. The former has been recoded to make it compatible with the latter.
20
Luechinger et al. (2008) provide an analysis of the public-private sector life satisfaction differential, and note that, across countries, this is lower in countries with impartial judiciaries, and higher in countries with more corruption and more red tape. Luechinger et al. (2009) analyse German (GSOEP), American (GSS) and European (Eurobarometer) data and suggest that public-sector workers are insulated against macro shocks. Last, Lanfranchi and Narcy (2008) analyse the job-satisfaction differential in seven European countries across the profit and not-for-profit sectors.
say that they are proud to work for their firm, and that they would be would turn down another job offering more money. One way of understanding this pattern of results is to think of workers’ answers to the first question as reasserting the non-profit motive of the public sector (although another is to imagine that there may be less competitive pressure on workers in the public sector: see Delfgaauw and Dur, 2008). Be that as it may, the addition of a variable for the public sector again has very little effect on the general shape of the estimated country coefficients: as above, the correlation coefficients between the two sets of estimated coefficients on the country dummies are all greater than 0.99.
We then consider whether the individual supervises others at work or not. This variable attracts a positive and very significant estimated coefficient in all three regressions. It is of course difficult to establish causality here, as more motivated individuals may be more likely to access managerial positions. The addition of this variable does not change the shape of the estimated country dummies, however.
We last look at trade union membership. Clark and Tomlinson (2001) use data from the 1992 Employment in Britain survey, which includes a question on discretionary effort: “How much effort do you put into your job, beyond what is required”? They show that this effort rises with the wage, but is lower for union members. In our data, the estimated coefficient on a dummy variable for the individual being a union member is also negative and significant in the effort equation, but insignificant in the other two equations. As for the other job characteristics, the addition of this variable in no way explains the country distribution of worker reciprocity.21
21
It would have been extremely interesting to look at worker commitment as a function of permanent/temporary employment contracts. Unfortunately this information is not available in the ISSP data. Nichols et al. (2009) find no effect of permanent contracts on employee trust in management. In line with some of the results mentioned in this section they also find that trust is lower for union members, and higher for managers. There is no significant difference between the private and public sectors.
iii) Macro Variables
The above two sub-sections revealed that additional individual- and job-related factors, added to the regressions in Table 5B, were important in their own right in explaining worker reciprocity, but added very little in terms of our understanding of why workers in some countries are so much more reciprocal than those in others. In this sub-section we move towards a more aggregated analysis.
We first consider the macroeconomic characteristics of unemployment, inflation and labour productivity (these are all OECD figures). We interact country with year in the reciprocity regressions, producing two separate coefficients for each country. There is no hours information for New Zealand in 1997, so that we end up with 29 country times year coefficients. These are used as dependent variables in a regression with the macroeconomic characteristics as explanatory variables.
The results are shown in Table 6. None of the three variables are correlated with the cross-country distribution of feeling proud to work in one’s firm. The unemployment rate is negatively and significantly correlated with effort provision, and negatively but insignificantly correlated with turning down another job with higher pay.22 Inflation is also marginally significantly correlated with the latter, suggesting that workers pay more attention to nominal salaries in times of higher inflation. Labour productivity is not correlated with any of the measures.
Unemployment, and to a lesser extent inflation, do thus help to explain the cross-country distribution of worker reciprocity, producing R-squared values of around 25% in columns 1 and 3 of Table 6. We now ask whether other, sometimes less well-known, country characteristics might be important. As with the variables in Table 7, we can make no
22
This is consistent with the fact that Managers in firms where layoffs had taken place report that these had deleterious effects on the remaining workers’ productivity, morale and commitment to the firm (Brockner, 1988 and 1992). Equally, Hartley et al. (1991) note that those who perceived increasing job insecurity also reported lower job satisfaction, reduced organisational commitment and trust in management, resistance to change and deteriorating industrial relations.
watertight claim as to causality here: we are identifying variables with which the conditional23 cross-country distribution of commitment is correlated. The country descriptive data here is the same as that used in Helliwell and Huang (2008).
The results in Table 7 are necessarily only fairly sketchy, due to a number of missing observations. It can be seen that worker commitment is to an extent higher in larger countries. Worker effort is also higher when there is more wage and price freedom (according to the Heritage/Wall Street wages and prices freedom index: http://www.heritage.org/). As in Table 6, feelings of pride in one’s firm are less well-explained (in terms of the R2) than are the other two commitment measures. Pride is significantly higher in countries which have a higher Civil Liberties score (this latter is the Freedom House index rescaled to lie between zero and one: http://www.freedomhouse.org/). Finally, turning down higher pay in order to stay in the current job is negatively correlated with the fiscal burden of government.24
Again, these results are not conclusive as to causality. However, they do show that the distribution of worker commitment across countries is not only correlated with macro-economic outcomes, but also with some institutional and social variables describing how society is organised.
5. Conclusion
This paper has analysed the distribution of three different measures of organisational commitment over 15 OECD countries in 1997 and 2005. There is some evidence that commitment has broadly risen over this period, both in the raw data and in multivariate regressions. Perhaps the most striking result to come out of the latter is the enormous variation in worker organisational commitment between these 15 developed countries. A
23
Conditional on the other right-hand variables in Table 5B, that is. 24
Although the results here should not be oversold, some of them are reminiscent of the link between tax morale (which we could think of as commitment to the Government) and democracy that are underlined in Frey (1997). The percentage of income not declared in Swiss cantons is shown to fall with the cantonal degree of democracy.
number of attempts to explain this country distribution by individual and job-related characteristics were not particularly successful. In addition, job satisfaction was shown to be strongly correlated with commitment (which is perhaps unsurprising). However, again its addition as a right-hand side variable in a regression analysis did not affect the country distribution of commitment in a particularly strong way. In other words, worker organisational commitment and job satisfaction are distinct from each other.
The country distribution of commitment was shown to be affected by country-level variables. There is some evidence that higher inflation rates reduce the percentage of workers who would turn down a job that offered more pay to stay with their firm: inflation may thus make workers more sensitive to nominal returns. Greater unemployment was shown to reduce workers’ discretionary effort. Poor Macroeconomic conditions then negatively affect those who directly suffer from them, but also seem to have consequences for those who remain in work. While work on British and German panel data has shown that aggregate unemployment reduces the well-being of workers (Clark, 2003, and Clark et al., 2010a), we here see that it also has negative consequences on firm-employee relations.
As well as macroeconomic outcomes, other variables describing the way in which the society functions exhibited significant correlations with country-level worker commitment (although it is important to remember that causality has not been established here). In particular, measures of freedom, both in terms of wages and prices and civil liberties, were associated with greater commitment scores (although it is probably worth underlining that we do not have a very clear theory of the mechanism behind this correlation).
The work described here has been partial in a number of respects. First, while a number of the regressions highlighted differences in the three commitment measures analysed here, we do not necessarily know which of these three is the most important for workers. In this context, it would be of great use to appeal to panel data to see which of these three is most salient in predicting future firm quitting. Second, all of the effects estimated above are
average effects. The way in which organisational commitment is correlated with the explanatory variables, such as income or education, may well differ between groups. We can analyse this heterogeneity either by defining the groups in question ex ante, as in Lanfranchi and Narcy (2008), or by letting the data determine the different groups themselves, as in the latent class analysis in Clark et al. (2005).
Last, given the substantial literature noting the positive correlates of commitment in term of firm performance and worker behaviour, the substantial cross-country differences in commitment remain only very partially explained. Further analysis at the aggregate level would be useful here, adding more countries and more time points, to identify better the role of institutions on worker commitment. The same exercise could also be imagined at the firm level, whereby changing the way in which the employment relation is structured at the firm level (in terms of worker representation, pay secrecy, union recognition or whatever) may have a significant impact on commitment. This kind of analysis could be carried out with survey data, or using experimental economic techniques. In any case, the analysis of worker-firm reciprocity will likely remain a fruitful area of research.
Table 1. Number of employees interviewed in OECD countries: ISSP Module on Work Orientations. 1989, 1997 and 2005.
1989 1997 2005 West Germany 622 648 531 Great Britain 675 545 469 USA 838 800 961 Hungary 641 626 437 Netherlands 681 1018 Italy 586 475 Norway 1305 1366 846 Sweden 793 866 Czech Republic 526 667 Poland 564 New Zealand 695 812 Canada 546 520 Japan 607 428 Spain 387 556 France 700 1084 Portugal 843 1012 Denmark 600 1092 Switzerland 1727 662 Total 5348 13466 10943
Table 2. The Distribution of Worker Commitment.
Work Harder to Help Firm
Proud to Work for my Firm
Turn Down Higher Pay to Stay
Strongly Agree 18.0 20.9 9.1
Agree 42.3 43.9 17.7
Neither Agree nor Disagree 23.5 26.5 23.8
Disagree 11.1 6.3 29.5
Strongly Disagree 5.1 2.5 20.0
Source: Employees in ISSP 1997 and 2005. Note: Weighted Data.
Table 3. Satisfaction and Commitment over Time (%).
1997 2005 1997 2005
Agree: Work Harder 58.0 56.5 64.2 *** 61.6
Agree: Proud 64.0 * 65.6 64.1 65.4
Agree: Turn Down Higher Pay 24.3 *** 27.3 26.2 *** 28.9
High Job Satisfaction 41.1 42.0 40.3 *** 43.3
Women Men
Source: Employees in ISSP 1997 and 2005. Notes: Weighted Data; ***, ** and * denote significant differences by year at the one, five and ten per cent levels respectively.
Table 4. The Country Distribution of Worker Commitment. ISSP 1997 and 2005 Agree: Work
Harder
Agree: Proud Agree: Turn Down Higher Pay High Job Satisfaction Canada 64.9 67.1 18.5 38.5 Czech Republic 55.5 43.9 26.3 27.6 Denmark 66.1 67.1 29.6 58.3 France 24.6 55.4 15.8 28.9 Great Britain 63.8 60.1 21.2 39.0 Hungary 57.1 51.3 14.9 26.7 Japan 61.5 57.5 44.4 28.2 New Zealand 67.9 71.5 22.8 40.7 Norway 61.8 66.2 22.1 37.8 Portugal 63.9 79.2 42.9 40.2 Spain 41.5 62.4 23.9 46.5 Sweden 47.4 58.0 15.4 39.8 Switzerland 68.4 70.7 35.2 56.0 USA 79.2 79.2 26.9 52.0 West Germany 61.9 56.0 30.9 43.0 Total 60.3 64.8 26.7 41.7
Table 5A. Overall Job Satisfaction and Commitment Regressions. ISSP 1997 and 2005. Work Harder to Help Firm Proud to Work for my Firm Turn Down Higher Pay to Stay Job Satisfaction 2005 -0.009 0.042* 0.070** 0.034* (0.016) (0.016) (0.016) (0.016) Male 0.133** -0.019 0.002 -0.037* (0.016) (0.016) (0.016) (0.015) 30 to 44 -0.005 0.047* 0.151** 0.012 (0.022) (0.022) (0.023) (0.022) 45 to 65 -0.021 0.087** 0.292** 0.111** (0.023) (0.023) (0.024) (0.023) Married 0.043* 0.118** 0.094** 0.115** (0.017) (0.017) (0.017) (0.017) Years of Education 0.014** 0.011** 0.001 0.007** (0.002) (0.002) (0.002) (0.002) West Germany -0.120** -0.390** 0.190** -0.274** (0.045) (0.045) (0.046) (0.044) Great Britain 0.012 -0.264** 0.023 -0.403** (0.047) (0.047) (0.047) (0.046) USA 0.394** 0.165** 0.045 -0.222** (0.041) (0.041) (0.040) (0.040) Hungary -0.174** -0.515** -0.248** -0.630** (0.045) (0.046) (0.046) (0.045) Norway -0.118** -0.186** 0.087* -0.363** (0.038) (0.038) (0.039) (0.038) Sweden -0.359** -0.401** -0.286** -0.430** (0.041) (0.041) (0.042) (0.040) Czech Republic -0.206** -0.689** 0.088* -0.548** (0.044) (0.045) (0.045) (0.044) New Zealand 0.037 -0.078 0.063 -0.405** (0.042) (0.042) (0.042) (0.041) Canada -0.041 -0.105* -0.036 -0.441** (0.047) (0.047) (0.047) (0.046) Japan -0.063 -0.358** 0.545** -0.806** (0.047) (0.047) (0.048) (0.046) Spain -0.579** -0.290** -0.018 -0.300** (0.048) (0.048) (0.049) (0.047) France -0.968** -0.413** -0.258** -0.583** (0.040) (0.040) (0.040) (0.039) Portugal -0.005 0.332** 0.409** -0.338** (0.042) (0.042) (0.042) (0.041) Switzerland 0.042 -0.113** 0.329** -0.054 (0.038) (0.038) (0.039) (0.037) Observations 18244 18355 17580 18620 Log-Likelihood -24924.60 -23249.97 -26201.15 -27142.54 Log-Likelihood at zero -25753.89 -23794.73 -26729.52 -27526.66 χ2( 14) test statistic for country dummies 1562.7 998.8 756.7 673.7 χ2( 14) test statistic for country dummies
(no other controls) 1530.4 969.7 768.4 636.4
Table 5B. Overall Job Satisfaction and Commitment Regressions with Earnings and Hours. ISSP 1997 and 2005.
Work Harder to Help Firm Proud to Work for my Firm Turn Down Higher Pay to Stay Job Satisfaction 2005 -0.006 0.044* 0.053** 0.021 (0.018) (0.018) (0.018) (0.017) Male 0.069** -0.099** -0.039* -0.066** (0.018) (0.019) (0.019) (0.018) 30 to 44 -0.021 0.015 0.136** -0.007 (0.024) (0.024) (0.025) (0.024) 45 to 65 -0.040 0.043 0.264** 0.075** (0.025) (0.026) (0.026) (0.025) Married 0.026 0.109** 0.071** 0.081** (0.019) (0.019) (0.019) (0.018) Years of Education 0.008** 0.005 -0.003 0.002 (0.003) (0.003) (0.003) (0.003)
Earnings ($000) per month 0.044** 0.051** 0.050** 0.062**
(0.008) (0.008) (0.008) (0.008)
Hours per week 0.008** 0.006** 0.001 -0.000
(0.001) (0.001) (0.001) (0.001) West Germany -0.134** -0.415** 0.185** -0.318** (0.047) (0.048) (0.048) (0.046) Great Britain 0.022 -0.282** 0.022 -0.434** (0.049) (0.049) (0.049) (0.048) USA 0.349** 0.113** 0.020 -0.261** (0.043) (0.043) (0.043) (0.042) Hungary -0.215** -0.574** -0.251** -0.605** (0.052) (0.052) (0.052) (0.051) Norway -0.119** -0.207** 0.073 -0.399** (0.040) (0.040) (0.040) (0.039) Sweden -0.347** -0.406** -0.274** -0.444** (0.042) (0.043) (0.044) (0.042) Czech Republic -0.197** -0.708** 0.088 -0.567** (0.050) (0.051) (0.051) (0.050) New Zealand 0.015 -0.120* 0.070 -0.477** (0.053) (0.053) (0.053) (0.052) Canada -0.057 -0.144** -0.065 -0.495** (0.049) (0.050) (0.050) (0.048) Japan -0.082 -0.390** 0.535** -0.813** (0.051) (0.051) (0.051) (0.050) Spain -0.593** -0.298** -0.012 -0.304** (0.055) (0.056) (0.056) (0.055) France -0.946** -0.421** -0.254** -0.587** (0.042) (0.042) (0.042) (0.041) Portugal 0.003 0.364** 0.387** -0.361** (0.046) (0.047) (0.046) (0.045) Switzerland 0.023 -0.167** 0.287** -0.135** (0.041) (0.041) (0.041) (0.040) Observations 15667 15760 15089 15976 Log-Likelihood -21399.14 -19886.93 -22437.11 -23271.93 Log-Likelihood at zero -22222.14 -20431.11 -22916.76 -23644.53 χ2( 14) test statistic for country dummies 1277.3 832.9 589.4 495.2 χ2( 14) test statistic for country dummies
(no other controls) 1391.1 869.3 674.1 575.2
Table 6. Worker Commitment and the Macro Economy Work Harder to Help Firm Proud to Work for my Firm Turn Down Higher Pay to Stay Unemployment Rate -0.044** -0.009 -0.023 (0.016) (0.016) (0.013) Inflation -0.001 -0.018 -0.027 (0.018) (0.019) (0.015) Labour Productivity -0.001 0.004 -0.006 (0.006) (0.007) (0.005) Constant 0.285 0.047 0.315 (0.265) (0.277) (0.217) Observations 29 29 29 R-squared 0.243 0.085 0.211
Notes: Standard errors in parentheses. * significant at 5%; ** significant at 1%.
Table 7. Worker Commitment and Societal Variables
Work Harder to Help Firm Proud to Work for my Firm Turn Down Higher Pay to Stay
Population (in 10 Millions) 0.016* 0.011
(0.005) (0.008)
Wage and Price Freedom 0.265** (0.087)
Civil Liberties Index 1.625*
(0.712)
Fiscal Burden of Government -0.202*
(0.085) Voting Turnout -1.036* (0.407) Constant 0.332 -1.678* -0.315 (0.188) (0.680) (0.426) Observations 17 26 16 R-squared 0.549 0.235 0.473
References
Bishop, J., Scott, K., and Burroughs, S. (2000). “Support, Commitment, and Employee Outcomes in a Team Environment”. Journal of Management, 26, 1113-1132.
Bonsang, E., and Van Soest, A. (2010). "Satisfaction with job and income among older individuals across European countries". University of Maastricht: ROA, Research Memoranda 011.
Brockner, J. (1988). “The Effects of Work Layoffs on Survivors: Research, Theory and Practice”, in B. Staw and L. Cummings (Eds.): Research in Organizational Behaviour, Vol. 10, Greenwich: JAI Press, 213-55.
Brockner, J. (1992). “Managing the Effects of Lay offs on Survivors”, California
Management Review, 34, 9-28.
Brown, S. McHardy, J. McNabb, R. and Taylor, K. (2010), "Firm Performance, Worker Commitment and Loyalty", Journal of Economics and Management Strategy, forthcoming.
Clark, A.E. (2003). "Unemployment as a Social Norm: Psychological Evidence from Panel Data". Journal of Labor Economics, 21, 323-351.
Clark, A.E. (2010). "Work, Jobs and Well-Being Across the Millennium". In E. Diener, J. Helliwell, and D. Kahneman (Eds.), International Differences in Well-Being. Oxford: Oxford University Press.
Clark, A.E., Etilé, F., Postel-Vinay, F., Senik, C., and van der Straeten, K. (2005). "Heterogeneity in Reported Well-Being: Evidence from Twelve European Countries".
Economic Journal, 115, C118-C132.
Clark, A.E., Knabe, A., and Rätzel, S. (2010a). "Boon or Bane? Others' Unemployment, Well-being and Job Insecurity". Labour Economics, 17, 52-61.
Clark, A.E., Masclet, D., and Villeval, M.-C. (2010b). "Effort and Comparison Income".
Industrial and Labor Relations Review, 63, 407-426.
Clark, K., and Tomlinson, M. (2001). "Effort and Earnings: Evidence from the Employment in Britain Survey". University of Manchester, mimeo.
Cooper-Hakim, A., and Viswesvaran, C. (2005). "The Construct of Work Commitment: Testing an Integrative Framework". Psychological Bulletin, 131, 241–259.
Delfgaauw, J., and Dur, R. (2008). "Incentives and Workers' Motivation in the Public Sector".
Freeman, R., Kruse, D., and Blasi, J. (2008). "The same yet different: Worker reports on labour practices and outcomes in a single firm across countries". Labour Economics,
15, 749-770.
Frey, B. (1997). "A constitution for knaves crowds out civic virtues". Economic Journal, 107, 1043-1053.
Gerhart, B. (2008). "How much does national culture constrain organization culture?".
Management and Organization Review, 5, 241-259.
Gerhart, B., and Fang., M. (2005). "National culture and human resource management: assumptions and evidence". International Journal of Human Resource Management,
16, 971-986.
Harter, J., Hayes, T. and Schmidt, F. (2002). "Business-Unit-Level Relationship Between Employee Satisfaction, Employee Engagement, and Business Outcomes: A Meta-Analysis". Journal of Applied Psychology, 87, 268–279.
Harter, J., Schmidt, F., Killham, E. and Asplund, J. (2006). "Q12® Meta-Analysis". The Gallup Organization, mimeo.
Hartley, J., D. Jacobson, B. Klandermans, T. van Vuuren, with L. Greenhalgh and R. Sutton (1991). Job Insecurity: Coping with jobs at risk, London: Sage.
Helliwell, J.F., and Huang, H. (2008). "How’s Your Government? International Evidence Linking Good Government and Well-Being". British Journal of Political Science, 38, 595-619.
Huppert, H., Marks, N., Clark, A.E., Siegrist, J., Stutzer, A., Vittersø, J., and Wahrdorf, M. (2009). "Measuring well-being across Europe: Description of the ESS Well-being Module and preliminary findings". Social Indicators Research, 91, 301-315.
Judge, T., Thoresen, C., Bono, J. and Patton, G. (2001). "The job satisfaction-job performance relationship: A quantitative and qualitative review". Psychological Bulletin, 127, 376-407.
Lanfranchi, J., and Narcy, M. (2008). "Différence de Satisfaction dans l'Emploi entre Secteurs à But Lucratif et à But Non Lucratif: Le Rôle Joué Par les Caractéristiques d'Emploi".
Annals of Public and Cooperative Economics, 79, 323-368.
Lincoln, J., and Kalleberg, A. (1996). "Commitment, quits and work organization in Japanese and U.S. plants". Industrial and Labor Relations Review, 50, 39-59.
Luechinger, S., Meier, S., and Stutzer, A. (2008). "Bureaucratic Rents and Life Satisfaction".
Luechinger, S., Meier, S., and Stutzer, A. (2009). "Why Does Unemployment Hurt the Employed? Evidence from the Life Satisfaction Gap between the Public and the Private Sector". Journal of Human Resources, 45, 998-1045.
Meyer, J., Stanley, D., Herscovitch, L., and Topolnytsky, L. (2002). "Affective, Continuance, and Normative Commitment to the Organization: A Meta-analysis of Antecedents, Correlates, and Consequences". Journal of Vocational Behavior, 61, 20–52.
Mowday, R., Steers, R., and Porter, L. (1979). "The measurement of organizational commitment". Journal of Vocational Behavior, 14, 224-247.
Nagin, D., Rebitzer, J., Sanders, S., and Taylor, L. (2002). "Monitoring, Motivation, and Management: The Determinants of Opportunistic Behavior in a Field Experiment".
American Economic Review, 92, 850-873.
Nichols, T., Danford, A., and Tasiran, A. (2009). "Trust, Employer Exposure and the Employment Relation". Economic and Industrial Democracy, 30, 241-265.
Patterson, M., Warr, P., and West, M. (2004). "Organizational Climate and Company Productivity: The Role of Employee Affect and Employee Level". Journal of
Occupational and Organizational Psychology, 77, 193-216.
Pfeffer, J. (2007). "Human Resources from an Organizational Behavior Perspective: Some Paradoxes Explained". Journal of Economic Perspectives, 21, 115-134.
Reinikka, R., and Svensson, J. (2010). "Working for God? Evidence From A Change In Financing Of Nonprofit Health Care Providers In Uganda". Journal of the European
Economic Association, 8, 1159–1178.
Senik, C. (2010). "Peut-on dire que les Français sont malheureux ?". In P. Askenazy and D. Cohen (Eds.), Nouvelles Questions D'Economie Contemporaine. Economiques 2. Paris: Albin Michel.