HAL Id: hal-01880337
https://hal-univ-pau.archives-ouvertes.fr/hal-01880337
Preprint submitted on 24 Sep 2018HAL is a multi-disciplinary open access archive for the deposit and dissemination of sci-entific research documents, whether they are pub-lished or not. The documents may come from teaching and research institutions in France or abroad, or from public or private research centers.
L’archive ouverte pluridisciplinaire HAL, est destinée au dépôt et à la diffusion de documents scientifiques de niveau recherche, publiés ou non, émanant des établissements d’enseignement et de recherche français ou étrangers, des laboratoires publics ou privés.
The impact of Migrant Workers’ Remittances on the
Living Standards of families in Morocco: a Propensity
Score Matching Approach
Jamal Bouoiyour, Amal Miftah
To cite this version:
Jamal Bouoiyour, Amal Miftah. The impact of Migrant Workers’ Remittances on the Living Standards of families in Morocco: a Propensity Score Matching Approach. 2014. �hal-01880337�
Centre d’Analyse Théorique et de
Traitement des données économiques
CATT-UPPA
UFR Droit, Economie et Gestion Avenue du Doyen Poplawski - BP 1633 64016 PAU Cedex Tél. (33) 5 59 40 80 01 Internet : http://catt.univ-pau.fr/live/
CATT WP No. 10
February 2014
THE IMPACT OF MIGRANT
WORKERS' REMITTANCES
ON THE LIVING STANDARDS
OF FAMILIES IN MOROCCO:
A PROPENSITY SCORE
MATCHING APPROACH
Jamal BOUOIYOUR
Amal MIFTAH
1
The impact of Migrant Workers' Remittances on the Living Standards of
families in Morocco: a Propensity Score Matching Approach
Jamal Bouoiyour a and Amal Miftah b a
University of Pau, CATT, France.
jamal.bouoiyour@univ-pau.fr
b
University of Paris Dauphine, LEDa, France. IRD, UMR225-DIAL, France.
Corresponding author
jamal.bouoiyour@univ-pau.fr
Abstract: This article attempts to assess empirically the impact of remittances on household
expenditure and relative poverty in Morocco. We apply propensity score matching methods to the 2006/2007 Moroccan Living Standards Measurement Survey. We find that migrants’ remittances can improve living standards among Moroccan households and affect negatively the incidence of poverty. The results show a statistically significant and positive impact of hose remittances on recipient households’ expenditures. They are also significantly associated with a decline in the probability of being in poverty for rural households; it decreases by 11.3 percentage points. In comparison, this probability decreases by 3 points in urban area.
Keywords: Poverty, Remittances, propensity score matching, Morocco. JEL Classification: F24, I32, O15, O55.
1
The authors would like to thank Moroccan Institute of statistics for providing access to the national data. We thankfully acknowledge several anonymous reviewers for their comments on a previous draft of this manuscript.
2
1. Introduction
For several decades the fight against poverty has become a major policy concern for national governments and international institutions. The Millennium Declaration of the United Nations (2000) has placed the fight against poverty at the center of development policies. Morocco committed –like all other signatories of this statement- itself to achieve measurable targets by 2015, among them the fight against poverty1
1
The other Millennium Development Goals (MDGs) are relate to primary education, gender equality, reducing child mortality, improving maternal health, the fight against HIV / AIDS and other diseases, environmental sustainability, and creating a global partnership for development.
. While some progress has been made in the eradication of extreme poverty, continuous and very substantial efforts are still needed to fight poverty and accelerate measures in areas of education, health, gender equality, etc. But according to a fairly large body of literature, private and public transfers often constitute a significant component of total household income and thus contribute to the reduction of income poverty and to the increase of the investment in human capital in certain developing countries. This is the case, for example, of private transfers from migrant workers. In general, a rich literature on welfare impacts of these private transfers highlights their positive effect on the poverty reduction in the counties of origin by increasing household income and smoothing consumption (see for example Adams, 1991, Brown and Jimenez, 2007, Acosta et al., 2007, Gubert et al., 2010, Combes et al., 2011, Esquivel and Huerta-Pineda, 2006, Adams and Page, 2005). At macro-level, Anyanwu and Erhijakpor (2010) have used a panel data set on poverty and international remittances for 33 African countries to examine the impact of international remittances on poverty reduction over the period 1990–2005. They found that international remittances reduce incidence, depth and severity of poverty in African countries. Adams and Page (2005), in their broader analysis of the impact of international migration and remittances on poverty indicators in 71 developing countries, showed that a 10 percent increase in the proportion of international migrants in the country of origin leads to a 2.1 percent fall in the number of people living on less than 1 US$ a day. Similar conclusions were also drawn at the micro-level by Adams (1991). The author finds that in Egypt the number of poor rural households declines by 9.8 percent when they receive international remittances. However, the link between international migration and poverty needs to be probed especially if a majority of migrants come from the wealthiest households because migration is selective on age, gender, wealth, etc. It is argued that the migration selective process is one of the key determinants of returns to international migration and thus its effect on poverty reduction. In
3 reality, as De Haas (2007) suggests, if migration is a selective process, most direct benefits of remittances are also selective, tending not to flow to the poorest members of communities. In other words, if the migrants are not being drawn from the lowest quintiles of the income distribution in their country of origin, the impact of migration on poverty might not be direct and immediate and its effects on structural poverty are likely to occur through substantial indirect effects (Kapur, 2004). Recently, these challenges have given rise to innovative methods for estimating the possible impacts of remittances on poverty in recipient countries. The counterfactual approach, usually taken in the migration and remittances literature, was focused on estimating household’s income level that would have been in the absence of migration and then to compare that with actual household income with remittances (Adams, 1991, Brown and Jimenez, 2007, Gubert et al., 2010, Acosta et al., 2007). Esquivel and Huerta-Pineda (2006) have analyzed the relationship between international migration and poverty in Mexico by comparing incomes and poverty rates amongst remittance receiving households with those estimated for similar households who do not receive remittances. They find that receiving remittances reduces a household’s probability of being in poverty by 8-6 percentage points.
In the past two decades, remittances by Moroccans residing abroad have increased. According to data from the World Bank, remittance inflows reached more than 7.25 billion $ in 2011. In addition, migrant workers' remittances remain an important source of financing for the Moroccan economy (7.28 percent of Morocco’s gross domestic product in 2011) and one of the main means to ensure recipient family income. In fact, the well-being of households may be affected by the international migration, thus for example, it is estimated that, in 2007, approximately 13 percent of rural incomes depend on migrants' remittances to Morocco. Thus, after the consumption of food products, health and education constitute the main priorities in terms of household expenditure.
The existing studies on the relationship between Moroccan migration and poverty are rare. To the best of our knowledge, there is a single study on the subject (Bourchachen, 2000). The author suggests that international remittances have decreased the number of Moroccan living in poverty from 6.5 million to 5.3 million. Our contribution proposes to estimate the effect of these financial flows on the households' welfare levels by using carrying out a micro-econometric approach. In particular, we assess the impact of migrants’ remittances on poverty and standards of living in Morocco using propensity-score matching (PSM) methods. These methods were initially used to evaluate whether a medical treatment has an effect. In our study, we consider the receipt of international remittances as a treatment. In reality, the
4 heterogeneity of households and the problem of self-selection are challenging the evaluation of the “real” effect of remittances on household expenditure and poverty. Overcoming these problems can be done by exploring some of econometric methods like the PSM approach. In this paper we apply this method in order to obtain treatment effects from the migrants’ remittances on the well-being of remittances-recipient households. We also evaluate the extent to which selection bias on unobserved covariates would nullify propensity score matching estimates of the effects of migrants’ remittances.
The rest of the paper is structured as follows. Section 2 describes the data and the variables under consideration. Section 3 explains our methodological procedure. The empirical results are then presented in Section 4. Section 5 provides an application of sensitivity analysis in order to judge on the causality of the different results. The last section concludes.
2. Data and variables used in estimation
The data used in this paper are from the Moroccan Living Standard Measurement Survey (LSMS) which was implemented by the High Commission for Planning (HCP)2
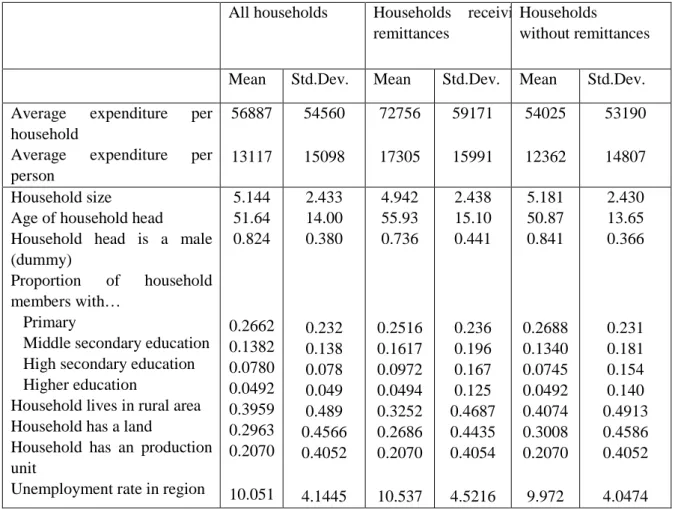
A detailed analysis of this household survey shows that 15 percent of households receive transfers from abroad. The average annual amount transferred exceeds 11,540 MAD
in 2006-2007. The survey is based on a weighting sample of 7,062 households, drawn from all regions of Morocco (1,079 households receive international remittances, the remaining 5,983 households in the sample did not benefit from such transfer). The descriptive analysis of the sample shows that remittances are a major component in recipient household income: the share of remittances in household expenditure is about 40 percent.
3
Table 1 depicts that remittances increase the annual expenditure of a recipient household. Remittance-receiving households have more members with middle and high secondary
. Of all migrants, 66 percent transfer funds to Morocco. Furthermore, remittances are sent at very high frequencies: 36 percent of individuals sent twelve or more remittances over the sample period (at least monthly), 15.52 percent sent one or more, and 19 percent did not send remittances regularly.
2
This database has been used for international migration research for the first time.
3
5 education than non-remittance households; further, household heads are older in remittance-receiving households4.
Table 1. Selected descriptive statistics All households Households receivi
remittances
Households
without remittances Mean Std.Dev. Mean Std.Dev. Mean Std.Dev. Average expenditure per
household
Average expenditure per person 56887 13117 54560 15098 72756 17305 59171 15991 54025 12362 53190 14807 Household size
Age of household head
Household head is a male (dummy)
Proportion of household members with…
Primary
Middle secondary education High secondary education Higher education
Household lives in rural area Household has a land
Household has an production unit
Unemployment rate in region
5.144 51.64 0.824 0.2662 0.1382 0.0780 0.0492 0.3959 0.2963 0.2070 10.051 2.433 14.00 0.380 0.232 0.138 0.078 0.049 0.489 0.4566 0.4052 4.1445 4.942 55.93 0.736 0.2516 0.1617 0.0972 0.0494 0.3252 0.2686 0.2070 10.537 2.438 15.10 0.441 0.236 0.196 0.167 0.125 0.4687 0.4435 0.4054 4.5216 5.181 50.87 0.841 0.2688 0.1340 0.0745 0.0492 0.4074 0.3008 0.2070 9.972 2.430 13.65 0.366 0.231 0.181 0.154 0.140 0.4913 0.4586 0.4052 4.0474
Table 2 presents the importance of remittances in the income distribution. As can be seen, the proportion of households receiving remittances increased from 13.9 percent of those in the lowest income quintile to 14.17 percent in the second quintile and 30.76 percent in the highest quintile (i.e., the 20 percent of households with the highest income). Interestingly, in the case of Morocco, it is possible that all international migrants do not come from the lowest quintiles of the income distribution. This outcome may have methodological challenges for researchers in carrying out quantitative analyses of remittances impacts. In the spirit of the counterfactual analysis with observational data, this study uses an econometric technique called propensity-score matching for gauging empirically these impacts.
4
Some studies have shown that international migration may contribute to human capital accumulation in migrant-sending societies. They highlight a positive impact of migrants’ remittances on the education of the family members who live in the country of origin (see for example Bouoiyour and Miftah (2013)’study for the case of rural Morocco).
6 Table 2. Remittances by quintile of household expenditure and areas of residence (%)
Quantile
Remittances receipt
Total
No Yes
Rural Urban All Rural Urban All
1 29.19 28.30 00.03 12.36 15.24 13.90 100 2 22.57 21.31 00.02 14.56 16.50 14.17 100 3 19.40 18.24 00.02 14.56 21.11 20.01 100 4 17.68 16.81 00.01 24.17 20.83 21.13 100 5 11.14 15.31 14.19 34.34 26.29 30.76 100 Total 86.98 83.23 84.72 13.01 16.76 15.27 100
Source: LSMS 2006/2007, authors’ computations.
To do so, we consider two types of explanatory variables of household income:
- The socio-economic characteristics of the household: age, education and sex of household head, proxy for household income, education level within the household (indicators for the proportion of household members with primary, middle and high secondary education, and higher education), and area of residence (urban and rural). As we look to estimate the level of welfare of both urban and rural household, productive capital detained by households takes two forms: land and/or businesses.
- The characteristics of the commune of residence: We introduce the regional unemployment rate in order to control the characteristics of the municipality involved.
We chose to assimilate the standard of living of the household to his actual expenditure and not to his income. This choice is dictated by the fact that income is generally poorly measured especially in the rural areas5
In our analysis, household expenditure includes food and tobacco, clothing, health care, housing, home furnishings, transportation, education, leisure and culture, and other goods. A household is considered to be poor if its members cannot cover their expenses. According to the HCP definition
. In addition, household expenditure can take into account the price differences according to the different municipalities.
6
5
The World Bank recommends the use of expenditure instead of income for several reasons. First, expenditure is a better indicator of performance than earnings, then it can be better measured as income and finally, consumption may reflect more accurately the actual standard of living of a household and his ability to meet his needs fundamental (Coudouel et al., 2002).
, this variable takes the value 1 if the household’s net per capita income is
6
The Moroccan High Commission for Planning measures the relative poverty threshold using the FAO-WHO standards and the World Bank estimation method. It usually sets poverty line by adding to the food poverty line (i,e., cost of the food basket satisfying a specific calorie requirement) additional
7 less than - or equal to - 3,834 MAD (for households in urban areas) and less than - or equal to - 3,569 MAD (for households in rural areas). Nationally, in 2007, 8.9 percent of the population in Morocco was under this condition (14.4 percent in rural areas and 4.8 percent in urban areas). As regards the extreme poverty, Morocco has been successful at achieving Goal 1 of the Millennium Development Goals (MDGs) by reducing the number of people living in extreme poverty. According to statistics provided by HCP, poverty at U.S $ 1 (PPP) per day per person has declined from 3.5 percent in 1990 to 2 percent in 2001 and 0.6 percent in 2008.
3. Methodological Approach
Matching techniques aim to estimate the specific effect of a measure (the receipt of international remittances in our case) on the situation of its beneficiaries. If these were chosen based on a number of characteristics, the effect of the measure is not clearly identified. Matching methods try thus to correct the composition bias. In fact, remittance decisions could influence the living conditions of recipient household. In this case, households receiving remittances may be different from households that do not receive international transfers: the two populations differ. Therefore, it is necessary to ensure that the effect attributed to these financial flows is not due solely to the particular profile of remittances-recipient households. To control for these potential biases, the researchers constructed, under the propensity score matching method, a population that includes households receiving remittances identical to the population of non-recipients, such that migration and transfers became a random event. If the observed differences are significant, they will be attributed to remittances inflows.
Define an indicator variable Ti equal to one if a household receives transfers from abroad and to zero otherwise. Yi is the potential outcome variable, represented in our study by the poverty status of the household i, defined on the basis of the national poverty line; Yi0 represents the counterfactual outcome value when Ti =0.
We define the average treatment effect on the treated group of household: ) 1 / ( ) 1 / ( ) 1 / (Υ1−Υ0 = = ΕΥ1 = −ΕΥ0 = Ε =
∆ATT i i Ti i Ti i Ti and the average treatment effect on the entire population: ∆ATE = Ε(Υi1−Υi0)= Ε(Υi/T =1)−Ε(Υi/T =0) with Υi =TYi1+(1−T)Υi0 We have ∆ATE = ∆ATT + Ε(Υi0/Ti=1)−Ε(Υi0/Ti =0)
funds for the purchase of non food goods. According to HCP report (2010), in 2007, the relative poverty line per person per year was 3,834 MAD in urban areas and 3,569 MAD in rural areas, i.e. an average of US$ 2.15 PPP per person per day ($1 PPP = MAD 4.88).
8 ) 0 / ( ) 1 / (Υ0 = −Ε Υ0 =
Ε i Ti i Ti is a sampling bias due to a non-random sample of a population. In other words, the populations of recipient and non-recipient households are not identical. If we have used a random sampling, the likelihood of bias could be reduced and there will be no systematic difference between treated and untreated units, so in this case we can have Ε(Υi0 /Ti =1)−Ε(Υi0 /Ti =0)= 0. Consequently, to eliminate this sampling bias, Yi0 and Ti must be independent. For this purpose, matching methods make the assumption of conditional independence, and assume that conditional on observable individual variables X, the assignment to treatment is random (Fougère, 2007, pp. 111). It means that, conditional on X, the outcomes are independent of treatment and thus the outcomes of non-treated units can be used to approximate the counterfactual outcome of treated units in the absence of treatment.
In practice, matching a large number of characteristics is difficult, which is why propensity score matching is important (Rosenbaum and Rubin, 1983) because it provides a one-dimensional summary of all these characteristics i.e., a propensity score.
If a propensity score is defined by P(X) = Pr (T = 1| X) and the household untreated noted ĩ is
paired with the treated household i, we have ( ) ( ~)
i i P X X P = and ) , 0 / ( ˆ ) , 1 / ( ˆ 0 0 ~ i i i i i i i T X T X Y =Ε Υ = =Ε Υ = .
The final estimator for the average treatment effect is obtained as the average of the differences between the situation of households treated and their counterfactuals:
) ( 1 ˆ ~ i I i yi y N TT A = − ∆
∑
=where I is the subsample of households treated, N is the number of households treated.
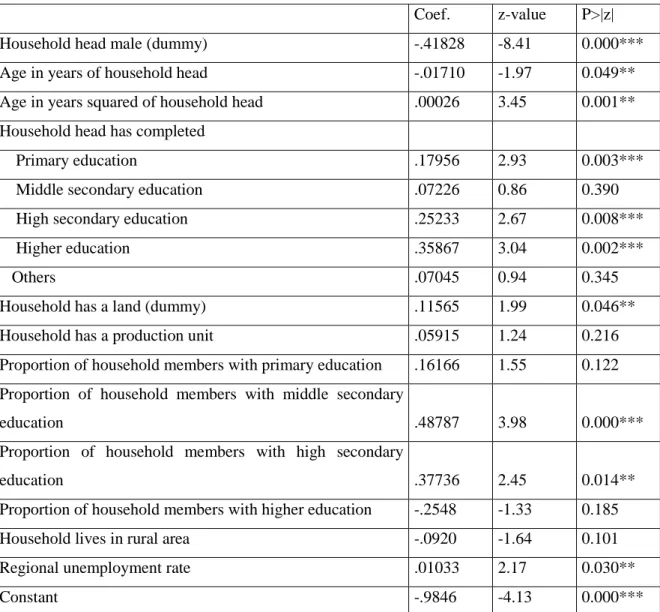
The estimate using matching models propensity score requires two steps. In the first step, we estimate the propensity scores of households with a logit or probit model containing the explanatory variables of the probability of receiving remittances7
In the second step, we estimate an average treatment effect on the treated (ATT). The final estimator for this average treatment effect is obtained as the average of the differences in the : age, education and sex of household head, proxy for household income, education level within the household (indicators for the proportion of household members with primary, middle and high secondary education, and higher education), area of residence (urban and rural), and regional unemployment rate. The main results of the estimation of the probit model are presented in appendix (Table A.2).
7
The vector X includes all variables that simultaneously influence treatment assignment and potential outcomes.
9 situation of treated households and their counterfactuals. The mean difference of the two groups should be statistically significant to speak of an effect of remittances on the households surveyed.
Many mechanisms can be used to find the non-recipients households which have propensity scores close to those of recipient households. These include, among others, nearest neighbour matching and kernel matching. In practice, the nearest neighbour method chooses a counterfactual household for each recipient household who is closest in terms of propensity score. Nearest neighbours are not determined by comparing treated observations to every single control, but rather by first sorting all records by the estimated propensity score, and then searching forward and backward for the closest control unit. With Kernel Matching, all treated are matched with a weighted average of all controls with weights that are inversely proportional to the distance between the propensity scores of treated and controls (see Becker and Ichino, 2002). Nearest neighbour method requires a maximum distance between the propensity scores of treated households and their nearest neighbours (caliper) beyond which it can be no matching. The caliper threshold set in the analysis is 0.01.
Econometric studies insist that the property of balancing variables observed in the two groups (treated and counterfactual) should be satisfied in order to confirm the validity of matching (balancing tests for propensity score matching). In other words, equality of means (of each variable which explains the probability of receiving remittances) for treatment and control groups must be ensured. We use the pstest command in Stata to test the balancing. We find that the balancing property of propensity scores is satisfied (Results are reported in Table A.2 in Appendix).
4. Empirical results
Recall that our analysis evaluates the relative importance of international remittances in improving the living standards of recipient households and the financial contribution of migrants to the income of their households of origin. We start by deriving the estimations for total households and then applying the same specification for urban areas and rural areas separately. In Table 3, we present the results of our first estimation. Firstly, it appears that the estimates using different matching methods provide very similar results. Secondly, the ATT is significant for all outcome categories (significant at 1 percent level). Thirdly, the results based on the poverty indicator (outcome variable) show that remittances significantly reduce a
10 household’s probability of being in poverty, i.e, there is a negative (causal) effect of the receipt of remittances on the propensity of their recipient to be poor.
Table 3. Average treatment effects on remittances on household poverty and expenditure
Variable Sample Treated Controls Difference S.E. T-stat Nearest neighbour
Poverty Unmatched .01111 .07526 -.06415 .00849 -7.55
ATT .01113 .05668 -.04554 .00808 -5.64
Expenditure per person Unmatched 17073 12472 4600.6 514.6 8.94
ATT 17011.2 13869.4 3141.8 745.3 4.22
Expenditure per household Unmatched 71964 54429 17534 1858.5 9.43
ATT 71746.7 59579.4 12167.3 2883.1 4.22
Kernel estimator
Poverty Unmatched .01111 .07526 -.06415 .00849 -7.55
ATT .01111 .06655 -0.055 0.005 -10.2
Expenditure per person Unmatched 17073.2 12472.6 4600.6 514.6 8.94
ATT 17073.2 13067.3 4002.5 608.3 6.57
Expenditure per household Unmatched 71964.2 54429.2 17534 1858.5 9.43
ATT 71964.2 56578.9 15370.6 1907.6 8.05
Note: For the kernel estimator, we applied the bootstrap to calculate the standard errors (50 replications), Abadie and Imbens (2006) show that bootstrapped standard errors are not valid for nearest-neighbour matching with a fixed number of neighbours. We impose common support condition in Stata to reduce poor quality matches. Psmatch2 command is used to estimate the different models. The Caliper is equal to 0.01, it corresponds to maximum allowable distance between the propensity scores (with nearest neighbour). Matching with the nearest neighbour is without replacement (individual control group can only be chosen once in the construction of the counterfactual), and in descending order.
Source: LSMS 2006/2007.
This effect takes values between 4.5 and 5.5 percentage points depending on the specification. These results confirm those obtained by the majority of studies on the subject (see for example Gubert et al., 2010 or Brown and Jimenez, 2007). It is important to mention that some studies have suggested that the poor household can and do benefit indirectly from international migration but also that the economic status of households could explain their use of remittances: richer households are, more expected to invest these remittances on various forms of productive investments and poorer households spend a greater share of their income on durable goods, healthcare, and housing8
8
De Brauw (2007) thinks that “There are three indirect channels by which migration can help poor or vulnerable households, even if they do not participate in migration themselves. First, migrants leave the local labor force, increasing the scarcity of local labor. Therefore, jobs become available that can . Taylor et al. (1999), for example, think that
11 income and employment multipliers from remittances are quite high, and many of the indirect benefits do not accrue to migrant households themselves, but to others. In other words, it's also necessary to take into account the indirect multiplier effects of migration and remittances upon communities of origin as a whole (including households without remittances). This would require positive effects of international migration on employment, income, and production.
Table 3 also points out some key differences between households with and without migrants' transfers. It reveals that the expenditures of treated households increase in average by about 12,167 MAD per year (15,370 MAD with kernel matching) more than that of the control households.
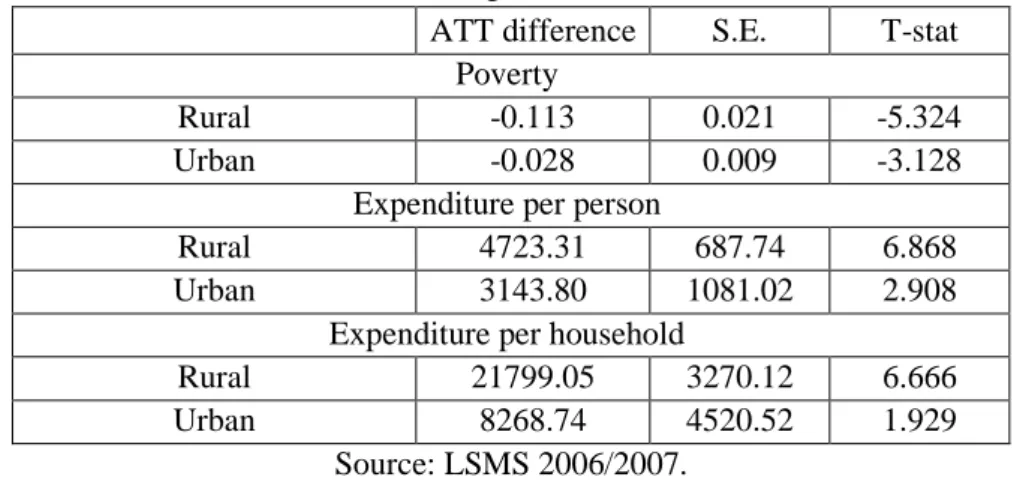
Using the matched subsamples, we can estimate the ATT difference for rural households as well for urban households similar to the procedure when the whole sample is used. As Table 4 depicts, for rural households, remittances reduce the probability of being below the poverty line by 11.3 percentage points. In comparison this probability decreases by only 2.8 points for urban households. This reveals that there is significant variability in the average results when the ATT is estimated after taking areas of residence into account. It is interesting to note that in Morocco, poverty is most severe and most widespread in these areas. In fact, the most recent data from national household surveys show that, the majority of the country's poor still live in rural areas (14.4 percent in rural areas and 4.8 percent in urban areas in 2007).
Table 4. Average treatment effects on remittances on poverty and expenditures, by areas of residence (Nearest neighbour method)
ATT difference S.E. T-stat Poverty
Rural -0.113 0.021 -5.324
Urban -0.028 0.009 -3.128
Expenditure per person
Rural 4723.31 687.74 6.868
Urban 3143.80 1081.02 2.908
Expenditure per household
Rural 21799.05 3270.12 6.666
Urban 8268.74 4520.52 1.929
Source: LSMS 2006/2007.
potentially be filled by the poor, or wages may be pressured upward, also potentially benefiting the poor. Second, remittances add liquidity to local markets, potentially stimulating economic activity. Third, when migrants return from urban areas or abroad, they bring new skills and experiences with them, sometimes even starting microenterprises that create local employment.”
12 Furthermore, the results show a statistically significant and positive ATT difference for rural household’s expenditure. The average development of expenditures of treated rural households is 21,799 MAD (i.e. 4,723 MAD per person) higher and statistically significant at the 1% level or better (see Table 4).
5. Robustness check
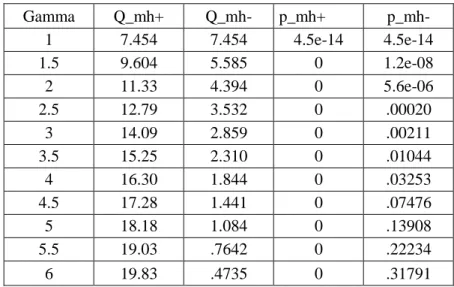
We conduct a sensitivity analysis on the estimation results. It is undertaken to check the strength of the conditional independence assumption, and if the influence of unobservable factors that may influence both remittances receipt and the outcome variables on the selection process is so strong to alter the matching estimates.
.
Table 5. Mantel-Haenszel (1959) bounds for variable Poverty
Gamma Q_mh+ Q_mh- p_mh+ p_mh- 1 7.454 7.454 4.5e-14 4.5e-14 1.5 9.604 5.585 0 1.2e-08 2 11.33 4.394 0 5.6e-06 2.5 12.79 3.532 0 .00020 3 14.09 2.859 0 .00211 3.5 15.25 2.310 0 .01044 4 16.30 1.844 0 .03253 4.5 17.28 1.441 0 .07476 5 18.18 1.084 0 .13908 5.5 19.03 .7642 0 .22234 6 19.83 .4735 0 .31791
Gamma: odds of differential assignment due to unobserved factors
Q_mh+: Mantel-Haenszel statistic (assumption: overestimation of treatment effect) Q_mh-: Mantel-Haenszel statistic (assumption: underestimation of treatment effect)
p_mh+: significance level (assumption: overestimation of treatment effect) p_mh-: significance level (assumption: underestimation of treatment effect)
To do this, we use Rosenbaum’s approach (2002). It is based on a test that determines the bounds of the significance level (p-value critical) of the average effect of treatment (ATT) for different levels of hidden bias. The idea is to increase the values of γ (variable which captures the effect of unobservable variables on the probability of receiving remittances), and to check if the results related to the consideration of hidden bias are robust. The higher the level of γ to which the ATT remains statistically different from zero, the more robust are the estimation results to the potential influence of hidden bias.
13 The results - presented in Table 5- are highly robust to unobserved heterogeneity, the threshold being higher than 2
Unfortunately, sensitivity analysis does not determine if biases really exist; it only shows how the existence of possible bias could undermine the significance of the estimates (Aakvik, 2001).
6. Conclusion
The migrants contribute in various ways to the well-being of their households of origin. This paper assesses the impact of international remittances on poverty and standards of living in Morocco. The analysis was based on propensity-score matching and uses national data from a Morocco household survey. Our results are interesting in a number of respects. Firstly, we show that migrants’ remittances affect negatively the propensity of their recipient to be poor. This effect takes values between 4.5 and 5.5 percentage points depending on the specification. Secondly, we find a significant improvement of expenditure of remittances-recipient households. In particular, remittances are associated with an increase in households’ expenditures by 12,167 MAD per year. In rural area, the expenditures of recipient households increase in average by about 21,799 MAD. Thirdly, when we distinguish households according to their area of living, we also find worthy notice that remittances have a statistically significant decline in the probability of being below the poverty line for rural households; it decreases by 11.3 percentage points. In comparison, this probability decreases by 3 points in urban area.
Our study suggests that matching can help to solve the problems of heterogeneity and self-selection in migration studies. It is especially relevant in the case of the analysis of household welfare, where the receipt of remittances can be dependent on some observable household specific characteristics. However, more research on the impact of remittances on poor households using a more specific database, namely a panel database is needed to confirm that poverty has continued its downward trend in the last few decades and that remittances to Morocco are partly responsible for this trend.
The findings are indicative of specific policy tools that could be made available for the poor households. For example, there are some policies that governments may introduce to reduce the population of the rural poor such as public transfer programs.
On another level, this study provides an analysis of some household factors selected from remittances literature influencing the probability of receiving remittances. More specifically,
14 the results show that the household variables, namely, education, gender and age of household head are correlated with the probability of receiving remittances.
References
Aakvik, A (2001). Bounding a matching estimator: The case of a Norwegian training program,” Oxford Bulletin of Economics and Statistics, Vol (63), 115-143.
Abadie, A and Imbens GW (2006). On the failure of the boostrap for matching estimators. Econometrica, 76 (6), 1537-57.
Acosta, P; Fajnzylber, P and Lopez, H (2007). The impact of remittances on poverty and human capital: Evidence from Latin American Household Surveys. Mimeo, World Bank. Adams, R.J (1991). The effects of international remittances on poverty, inequality and
development in Rural Egypt. Research Report 86, (Washington, DC: International Food Policy Research Institute).
Adams, R and Page, J (2005). Do international migration and remittances reduce poverty in developing countries? World Development, Vol (33), 1645-69.
Anyanwu, J. C and Erhijakpor, A.E.O (2010). Do international remittances affect poverty in Africa? African Development Review, 22, 51–91.
Becker, S.O and Ichino, A (2002). Estimation of average treatment effects based on propensity scores. The Stata Journal (2002), N° 4, 358–377.
Bouoiyour, J and Miftah, A (2013) Education, Genre et Transferts de fonds : Quelles interactions dans le Maroc rural. In « Impact des transferts de fonds sur la pauvreté et les inégalités : les enseignements de deux enquêtes conduites au Maroc et en Algérie ». FEMISE Report FEM 2013.
Bourchachen, J (2000). Apports des transferts des résidents à l'étranger à la réduction de la pauvreté : cas du Maroc SessionI-Pa 5c, Montreux.
Brown, R.P.C and Jimenez, E (2007). Estimating the net effects of migration and remittances on poverty and inequality: Comparison of Fiji and Tonga. WIDER Research Paper.
Combes, J.L; Ebeke, Ch; Maurel, M and Yogo, T (2011). Remittances and the prevalence of working poor. CERDI, Etudes et Documents, E 2011.09.
Coudouel, A ; Jesko, Hentschel, S and Quentin T.W (2002). Mesure et analyse de la pauvreté. World Bank.
15 De Brauw, A (2007).International migration: Can it improve living standards among poor and
vulnerable populations? International Food Policy Research Institute.
De Haas, H (2007). Remittances, migration and social development. A conceptual review of the literature. Social Policy and Development Programme Paper Number 34 October 2007.
Esquivel, G and Huerta-Pineda, A (2006). Remittances and poverty in Mexico: A Propensity Score Matching Approach. Inter-American Development Bank.
Fougère, D (2007). Les méthodes micro-économétriques d’évaluation. Working Papers, Direction générale des études et des relations internationales, Banque de France.
Gubert, F ; Lassourd, T and Mesplé-Somps, S (2010). Transferts de fonds des migrants, pauvreté et inégalités au Mali. Analyse à partir de trois scénarios contrefactuels. Revue économique 2010, Vol (61), 1023-1050.
High Commission for Planning, (2010). Millennium Development Goals. National Report 2009.
Kapur, D (2004). Remittances: the new development mantra? G-24 Discussion Paper Series, Nr. 29, United Nations Conference on Trade and Development.
Rosenbaum, P.R (2002). Attributing effects to treatment in matched observational studies. Journal of the American Statistical Association, Vol (97), N° 457.
Mantel, N and Haenszel, W (1959). Statistical aspects of the analysis of data from retrospective studies of disease. J Natl. Cancer Inst., Vol (22), 719-748.
Rosenbaum, P and Rubin, D (1983). The central role of the propensity score in observational studies for causal effects. Biometrika, Vol (70), 41-55.
Taylor, J. E ; Massey, D.S ; Arango, J ; Hugo, G ; Kouaouci, A and Pellegrino, A (1996). International migration and community development. Population Index, 62(3), 397-418. United Nations (2000). Millenium report: Eight Development Goals. Geneva 2000.
16
Appendix
Table A.1. Estimation of the propensity scores, probit model estimating the probability of receiving remittances
Coef. z-value P>|z|
Household head male (dummy) -.41828 -8.41 0.000***
Age in years of household head -.01710 -1.97 0.049**
Age in years squared of household head .00026 3.45 0.001**
Household head has completed
Primary education .17956 2.93 0.003***
Middle secondary education .07226 0.86 0.390
High secondary education .25233 2.67 0.008***
Higher education .35867 3.04 0.002***
Others .07045 0.94 0.345
Household has a land (dummy) .11565 1.99 0.046**
Household has a production unit .05915 1.24 0.216
Proportion of household members with primary education .16166 1.55 0.122 Proportion of household members with middle secondary
education .48787 3.98 0.000***
Proportion of household members with high secondary
education .37736 2.45 0.014**
Proportion of household members with higher education -.2548 -1.33 0.185
Household lives in rural area -.0920 -1.64 0.101
Regional unemployment rate .01033 2.17 0.030**
Constant -.9846 -4.13 0.000***
Note: * Significant at 10%; ** Significant at 5%; *** Significant at 1%. Source: LSMS 2006/2007.
17 Table A.2. Covariate balance check and absolute bias reduction
Variables
Mean t-test
Treated Control %bias t p>t Household head male (dummy) .7277 .7449 -4.2 -0.87 0.386 Age in years of household head 54.80 54.55 1.7 0.37 0.712 Age in years squared of household head 3222.5 3188.2 2.1 0.46 0.646 Household head has completed
Primary education .2024 .2186 -4.1 -0.88 0.378
Middle secondary education .083 .0961 -4.7 -1.02 0.306 High secondary education .0921 .1012 -3.3 -0.68 0.493
Higher education .0526 .0496 1.4 0.31 0.759
Others .0728 .0779 -1.9 -0.43 0.670
Household has a land (dummy) .2692 .2570 2.7 0.61 0.540 Household has a production unit .2064 .2125 -1.5 -0.33 0.740 Proportion of household members with primary
education .2583 .2699 -4.9 -1.09 0.278
Proportion of household members with middle
secondary education .1641 .1636 0.3 0.06 0.951
Proportion of household members with high
secondary education .0998 .1101 -6.3 -1.24 0.214
Proportion of household members with higher
education .0498 .0469 2.2 0.51 0.613
Household lives in rural area .3259 .2955 6.3 1.46 0.145
Regional unemployment rate 10.53 10.44 2.1 0.47 0.639
LR chi2=9.02, p>chi2=0.913, Pseudo R2 =0.003