1
SUPPLEMENTARY INFORMATION
MATERIALS AND METHODSWestern blot
The appropriate amount of samples was electrophoresed on SDS–polyacrylamide gel electrophoresis and transferred to Optitran reinforced nitrocellulose membranes (BA-S 85 or BA-S 83 for histones analysis, Whatman) 2.5 h at 4°C. Equal protein loading was indicated by Ponceau-S staining of blotted membranes. Membranes were blocked with 2% ECL Prime Blocking Reagent (GE Healthcare) in TBS-T (Tris-buffered saline plus 0.05% Tween-20) and hybridized overnight at 4°C with the primary antibodies: anti-PER2 1:200 (sc-25363, Santa Cruz Biotechnology); anti-BMAL1 1:2000 (ab93806, Abcam) ; anti-XPA 1:2000 (ab2352, Abcam); anti-LAMIN-B 1:4000 (sc-6216, Santa Cruz
Biotechnology); GAPDH 1:10000 (MAB374, Millipore); p53R2 1:2000 (ab8105, Abcam); anti-H3K9ac 1:3000 (pAb-177-050, Diagenode). The membranes were washed 4 times with TBS-T and incubated with anti-mouse or anti-rabbit IgG-horseradish peroxidase secondary antibody (GE Healthcare) for 1 h at room temperature. The membranes were washed 4 times with TBS-T and visualized by LiteAblot turbo extra-sensitive chemiluminescent substrate reagents (Euroclone). The signal were detected on Amersham Hyperfilm (GE Healthcare) and quantified with ImageJ software.
ELISA assay
Genomic DNA was isolated using the Puregene Core Kit B (Qiagen). The quality and quantity of DNA were assessed by using NanoDrop 1000 spectrophotometer (Thermo Scientific) and by agarose gel electrophoresis with ethidium bromide staining. DNA was denatured by boiling at 100°C for 10 min and rapidly chilled in a ice bath for 15 min. 50 μl/well of denatured DNA (4 ng/µl for 6-4PPs and 0.2 ng/µl for CPDs) were distributed to protamine sulfate-coated PVC microplates (Thermo Scientific) in quadruplicate and completely dried overnight at 37°C. Plates were thus washed 5 times with 150 μl/well of PBS-T 0.05% and incubated 30 min at 37°C with 150 μl/well of 2% goat serum in PBS to prevent non-specific antibody binding. Plates were washed 5 times with 150 μl/well of PBS-T and incubated 30 min at 37°C with 100 μl/well of mouse anti-CPDs (TDM-2 1:1000, CosmoBio) or mouse anti-6-4PPs (64M-2 1:1500, CosmoBio) antibodies in PBS. Plates were washed 5 times with 150 μl/well of PBS-T and incubated 30 min at 37°C with 100 μl/well of Biotin-F(ab’)2 fragment of goat anti-mouse IgG (H+L) secondary antibody (1:2000, Life Technology) in PBS. Plates were washed 5 times with 150 μl/well of PBS-T and incubated 30 min at 37°C with 100 μl/well of Peroxidase-Streptavidin (1:10000, Life Technology) in PBS. Plates were washed 5 times with 150 μl/well of PBS-T and once with 150 μl/well of citrate-phosphate buffer pH 5.0. The buffer was thus thrown away and plates were incubated 30 min at 37°C with 100 μl/well of substrate solution (o-Phenylene diamine 8 mg, H2O2 35% 4 μl, citrate-phosphate buffer 20 ml). Enzyme reaction was stopped distributing 50 μl/well of 2 M H2SO4 and absorbance was read at 492 nm with a SynergyTM HT multi-mode 96-well plate reader (BioTek).
Primers used for reverse transcription
mRNA Primer Sequence (5’-3’)
Bmal1 forward CAGGAAAAATAGGCCGAATG
2
Per2 forward TGACGTACCAGCTGCCTTC
Per2 reverse TGACGTACCAGCTGCCTTC
Rev-erb α forward CAACTCCCTGGCGCTTAC
Rev-erb α reverse GAAGCGGAATTCTCCATGC
Xpa forward TCTGTGATTGCCTTCTTACAACA
Xpa reverse GCTGACCTACCACTTCTGCAC
Gapdh forward TCCTCTGACTTCAACAGCCA
Gapdh reverse GGGTCTTACTCCTTGGAGGC
Rpl32 forward CATCTCCTTCTCGGCATCA
Rpl32 reverse AACCCTGTTGTCAATGCCTC
mXpa forward GCCAGCGCTCAGGTTCCTTG
mXpa reverse GCCCGCTTTACCTGTAGCTT
mGapdh forward CATGGCCTTCCGTGTTCCTA
mGapdh reverse CCTGCTTCACCACCTTCTTGA
SUPPLEMENTARY FIGURES
3
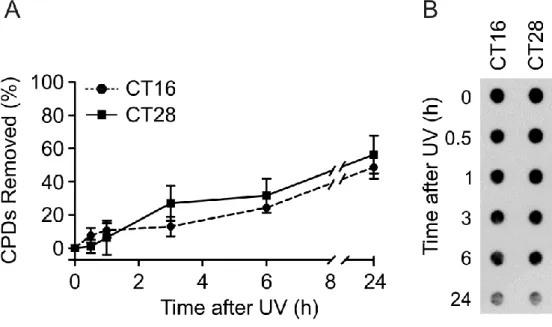
Figure 2S. Removal of CPDs induced by UV light in C63 cells. (A) Percentage of CPD photoproducts removed within 24 h of post-irradiation incubation. (B) Representative Dot-blot of CPDs remaining at different times after irradiation. The values are the mean ± SEM of three independent experiments.
Figure 3S. Relative amount of Bmal1, Per2 and Rev-erb α mRNAs in C63 cells transfected with siCTRL and siBmal1. Relative levels of Bmal1, Per2 and Rev-erb α mRNAs were measured at CT16 and CT28. The results were obtained in three independent experiments and plotted as mean ± SEM.
4
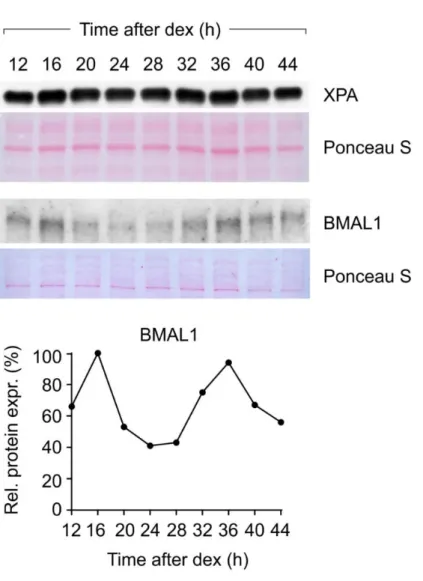
Figure 4S. XPA expression in quiescent skin fibroblasts derived from a healthy newborn donor. Clock-synchronization after dexamethasone pulse has been verified by BMAL1 oscillation. Ponceau staining served as a loading control.
5
Figure 5S. XPA amount in nuclear and cytosolic fraction of siBmal1 and siCTRL transfected cells before and after UV-irradiation. The values are the mean ±SD of two independent experiments.
Figure 6S. Oscillation of Bmal1 and Per2 transcripts in C63 cells treated with NaBu. Relative levels of
Per2 and Bmal1 mRNAs in NaBu-treated and untreated cells. Bmal1 and Per2 transcription oscillation
did not vary between NaBu-treated and untreated cells. The results were obtained in three independent experiments and plotted as mean ± SEM.