HAL Id: hal-00003641
https://hal.archives-ouvertes.fr/hal-00003641
Submitted on 17 Dec 2004HAL is a multi-disciplinary open access archive for the deposit and dissemination of sci-entific research documents, whether they are pub-lished or not. The documents may come from teaching and research institutions in France or abroad, or from public or private research centers.
L’archive ouverte pluridisciplinaire HAL, est destinée au dépôt et à la diffusion de documents scientifiques de niveau recherche, publiés ou non, émanant des établissements d’enseignement et de recherche français ou étrangers, des laboratoires publics ou privés.
Angle Neutron Scattering Study
Julian Oberdisse, Bruno Demé
To cite this version:
Julian Oberdisse, Bruno Demé. Structure of Latex-Silica Nanocomposite Films: A Small Angle Neutron Scattering Study. Macromolecules, American Chemical Society, 2002, 35, pp.4397. �hal-00003641�
Structure of Latex-Silica Nanocomposite Films: A Small Angle Neutron
Scattering Study
Julian Oberdisse *
+and Bruno Demé
+++ Laboratoire Léon Brillouin
CEA/CNRS CEA Saclay
91191 Gif sur Yvette Cedex France
++ Institut Laue-Langevin
6, rue Jules Horowitz BP 156
38042 Grenoble Cedex 9 France
* author for correspondence
No of Tables: 6
ABSTRACT
We report on the synthesis and structure of silica filled latex films. The main stage of the
synthesis consists in physico-chemical manipulations of colloidal solutions of nanosilica and
nanolatex beads, followed by drying and filmification. Hence, no mechanical energy which
might contribute to building or destruction of aggregates of silica beads is supplied to the
samples.
We have analyzed the structure of the resulting filled latex films by means of Small Angle
Neutron Scattering. The scattered intensity varies enormously with the physico-chemical
parameters, indicating considerable structural modifications. To rationalize these results, we
present a unified description of the data which successfully accounts for the main
characteristics of the scattered intensity: the form factor of beads at large q vectors, the
position of the intra- and inter-aggregate structure factor peaks, the small-q upturn observed in
some cases, and the overall intensity in absolute units. This allows us to quantify the degree of
aggregation of the silica in the matrix. It is found that the latter can be varied in a systematic
manner by changing pH, silica volume fraction and quantity of added salt. In one extreme
case, e.g., the aggregation number changes by a factor of about 1000 at constant silica volume
I. INTRODUCTION
Elastomers filled with small and hard particles are of great importance for the rubber industry,
where carbon black and silica are commonly used fillers [1-6]. These improve the mechanical
properties of polymeric material like the elastic modulus or resistance to abrasion. This
reinforcement of polymers has been studied in the past from many different points of view, by
experiment, theory and simulation. The wealth of approaches seems to be due to the
complexity of reinforcement, where effects on different lengthscales interact. Some studies
focus on chain conformation and dynamics, and changes induced by the presence of filler
[7-13], others on the interactions at the filler surface [14-18], and again others on interactions
between fillers and the large-scale structure of the filler in the polymeric matrix ('filler
networking') [19-28]. Moreover, non spherical fillers like fibers or disks, or special filler
surface treatments can further increase the complexity [2, 3, 16, 29-31].
In this article, we present the first part of a study of the relationship between the filler
structure and the rheological properties of a model nanocomposite material. It consists of
(hard) nanosilica spheres embedded in a soft polymeric matrix, which is itself formed from
nanolatex particles. Strictly speaking, the matrix is an entangled melt and not a rubber, i.e.
there are only transient junctions between chains. At the temperature of interest, however, the
flow of the material is sufficiently slow and the observed reinforcement effects are
sufficiently strong that our conclusions are nonetheless relevant for filled rubber as well. Our
system is solvent cast, i.e. it is controlled by physico-chemical manipulations in solution,
which has a variety of advantages: (a) No mechanical mixing or mechanical energy input is
needed for its preparation. (b) The processes governing latex film formation are now well
understood [32-34]. (c) Silica is a lot harder than the matrix polymer. The system represents
are always the same, independent of the structure of the filler. (e) The constituents, latex and
silica particles, can be studied individually. (f) The system has a high contrast for Small Angle
Neutron Scattering (SANS) experiments.
In section II, we present experimental details about the synthesis of the nanocomposite films,
as well as about the SANS experiments and data analysis. In section III, we turn to a
SANS-study of the individual components (latex and silica beads), and the structure of
nanolatex-silica films obtained in various physico-chemical conditions. Results are discussed in the last
section, where we rationalize the data in terms of the aggregation number of silica in the
matrix. In a forthcoming article we will confront the measured filler structure with the
mechanical properties tested in uniaxial elongation.
II. EXPERIMENTAL II.1 Sample preparation
The colloidal silica samples Bindzil B30/220 and Bindzil B40/130 were a gift from Akzo
Nobel, Sweden. The aqueous solution of c=30%wt for B30 (40%wt for B40, respectively)
was initially at pH 9. They were diluted to c=10%wt, de-ionized by means of an ion exchange
resin and filtered with a Millipore Steril Filter (0.8 µm). The resulting conductivity of the stock solutions was of the order of 100 µS/cm, at pH between 3 and 4. By immediate addition of small quantities of NaOH (1.0 M) the pH was adjusted to the desired value and the
colloidal stability was preserved. The average size given by Akzo Nobel is R = 75 Å for B30
and R = 125 Å for B40. The polydispersity is expected to be important.
The nanolatex was kindly provided by Rhodia. It is a core-shell latex of Poly(methyl
methacrylic acid. This hydrophilic shell is known to be less well defined than shells of bigger
latex particles [26]: The surface is simply enriched in methacrylic acid in order to assure the
colloidal stability in water. The key parameter for mechanical measurements is the glass
transition temperature of the core: Tg = 33°C. The initial concentration of nanolatex was
30%wt, at pH 9, and it has been processed in the same way as the colloidal silica. The
approximate size given by Rhodia is R = 200 Å.
Samples were prepared by mixing appropriate amounts of silica and latex stock solutions
(previously brought to the desired pH) in order to obtain a given volume fraction Φof silica in the final composite film. Note that addition of NaOH changes both the pH and the
conductivity Ls. In some experiments, NaCl (between 0.01 and 0.25 M) was added to the
aqueous mixture to further increase the conductivity without changing the pH. Solutions were
de-gassed in primary vacuum for several hours at room temperature, and then cast into
preheated teflon moulds of dimensions 4x4cm2 or 5x5 cm2. Filmification takes about 4 days at
65°C, and bubble-free, transparent, sometimes slightly yellowish and homogeneous films of
1-2 mm thickness were obtained [32-34]. These were further smoothed with sandpaper in
order to achieve constant thickness, which is important for the calibration of the scattered
intensity.
II.2 Small Angle Neutron Scattering
Experiments have been performed at LLB on beamline PACE and at ILL on beamline D11.
Here we report mainly on the D11 experiment. The wavelength was fixed to 10.0 Å and the
sample-to-detector distances were 1.25 m, 3.50 m, 10.00 m, 36.70 m, with corresponding
collimation distances of 5.50 m, 5.50 m, 10.50 m and 40.00 m, respectively. On spectrometer
distance of 4.58 m and a collimation distance of 5.00 m, and a second one with wavelength
5.1 Å, sample-to-detector distance of 1.13m and a collimation distance of 2.50 m. Data
treatment has been done with a home-made program following standard procedures [35, 36],
with H2O as calibration standard. D11-Spectra from different configurations superimpose
almost perfectly due to the common wavelength implying the same (weak) contribution of
inelastic, incoherent and multiple scattering. Small deviations found in the spectra at the
overlap of two configurations are due to different resolution conditions. For absolute
intensities in cm-1 the incoherent scattering cross section of H2O was estimated from a
measurement of the attenuator strength and of the direct beam with the same attenuator. The
incoherent scattering background of the nanocomposite samples was subtracted by enforcing
a high-q Porod (I = A q-4) behavior, which is known to be present from calibration
measurements with individual silica beads. The latter are the main building blocks of the
nanocomposites, and have therefore been analysed by fitting theoretical spectra, which take
polydispersity into account and which are convoluted for each configuration with the
corresponding resolution function, calculated according to Lairez [37]. This includes the
angular resolution due to the finite collimation, the detector cells, and the wavelength spread
of 9% of the mechanical velocity selector.
II.3 Modeling the Scattered Intensity
The scattering from interacting aggregates formed of polydisperse spheres is easily described
for isotropic structures with small polydispersity in the number of aggregation Nagg. The
differential scattering cross-section per unit volume I = dΣ/dΩ can then be written in a good approximation as the product of an inter-aggregate structure factor Sagg(q) and a normalised
(1) q) F q S V ∆ρ Φ I(q) 2 agg agg agg 2 la si ( ) ( = −
where ∆ρsi-la is the contrast, i.e. the difference in scattering length density between silica and
the polymer matrix. Vagg is the average scattering volume of an aggregate due to silica beads
only. In the presence of liquid-like order between aggregates, Sagg(q) has a correlation peak at
qo = 2π α/D, where D is the average distance between aggregates, and α is a parameter
reflecting the degree and type of positional order of the aggregates. The position of the peak
gives an estimation of the mean aggregation number:
si 3 agg D Φ V
N ≈ / (2)
where the silica volume fraction Φ and average volume of a silica sphere Vsi are known. The
model used to derive eq. (2) is to place all aggregates on a cubic lattice of periodicity D, thus
set α to 1, and apply the conservation of silica volume on a unit cell. Without a precise knowledge of α, one can only give a rough estimate of Nagg, due to the liquid-like order of the
samples. A better description of this order would lead to a numerical prefactor α > 1, i.e. we typically underestimate aggregation numbers by some factor α3 between 1.2 and 2. Note that
eq. (2) implicitly assumes that there is no higher order clustering, i.e. that the aggregates are
homogeneously distributed in space.
F2agg(q) in eq. (1) is a decreasing function of q in the small-q range, starting from 1 with a
decay typical for the form and size of the aggregate. The Guinier approximation holds at
3 R q -2 agg 2 g 2 e (q) F = (3)
where Rg is the radius of gyration of the aggregate. The aggregate form factor can be
decomposed into an intra-aggregate structure factor and the form factor of the silica spheres:
(q) F (q) S V (q) F V 2 si intra si 2 agg agg = (4)
F2si(q) is the normalised form factor of a silica sphere. Sintra is the intra-aggregate structure
factor, and it corresponds to the correlations between the centres-of-mass of the silica spheres
making up an aggregate. Its small angle value Sintra(q→0) is Nagg, and it tends towards 1 at
large q values. Sintra(q) can be calculated by numerical simulation, the input being the size
distribution of the silica spheres and an appropriate building rule for the aggregate [40, 41].
In the absence of position correlations between aggregates (high dilution, Sagg(q) = 1), one can
take polydispersity in aggregation number into account by summing the different
contributions. An example of bidispersity will be discussed below.
III. RESULTS
III.1 Scattering from isolated spheres
The scattering length density of macroscopic silica (SiO2) is ρsi = 3.5 1010 cm-2, while typical
values for hydrogenated polymers lie around 1. 1010 cm-2. For the colloidal silica and
nanolatex this was confirmed by external contrast variation in H2O/D2O mixtures (ρNL = 0.9
1010 cm-2). The form factor of the silica particles F2
(0.12%vol) solution in D2O, in order to suppress the contribution of the inter-particle structure
factor. The spectra I(q) are shown in Figure 1. They have the typical shape of scattering from
polydisperse objects, i.e. they present some oscillations reminiscent of form factor
oscillations. They have been analyzed in the following manner: the limiting scattered intensity
at zero angle I(q→0) and the equivalent sphere radius RGuinier were read of from a ln I(q) vs. q2
plot. Together with the Porod constant A from the high-q tail, one can determine the
polydispersity, the average radius and the contrast (cf. Appendix A for details). For B30, the
scattering can thereby be shown to be consistent with a log-normal radius distribution
function (see fits1 in Figure 1) of spheres with parameters Ro = 76.9 Å, with a polydispersity
in radius of σ = 0.186, and a contrast of 2.7 1010 cm-2. The latter value is exactly what one
expects from the solvent (D2O and some H2O from the silica colloidal solution) scattering
length density of 6.2 1010 cm-2. Note also that the Schultz-Flory distribution gives equivalent
results, whereas the Gaussian is less satisfactory, presumably due to the absence of a tail. For
B40, the parameters are Ro = 92.6 Å, with a polydispersity in radius of σ = 0.279, and a
contrast of 2.9 1010 cm-2, which is also reasonably close to the calculated value. Both
distribution functions are shown in the inset of Figure 1. An equivalent treatment of the
nanolatex yields an average radius of Ro = 138.9 Å, a polydispersity of σ = 0.243, and a
scattering length density of 0.9 1010 cm-2. The data shows that our particles are relatively well
defined and not aggregated. This demonstrates also the absence of aggregation in the stock
solutions used to produce the nanocomposite films, the samples for the data shown in Figure 1
having been prepared after the film samples. All data on colloidal particles are summarized in
Table 1.
III.2 Scattering from nanocomposite films
We present here some representative results, which show a systematic variation with the
different physico-chemical parameters. Among these, pH and volume fraction induce the
largest and most interesting changes. The samples in some of the series in volume fraction are
made with the bigger silica beads (B40), in order to test the influence of the size ratio with
respect to the latex spheres. The average radius < R > of the silica (B30 and B40) particles is a
bit more than one half and about two thirds of the radius of the nanolatex, respectively, a
small but significant change which allows us to study the influence of the size on the packing
and aggregation behavior of the silica spheres during film formation.
• Effect of pH
Samples from solutions with six different values of pH have been made, from 3.9 to 9.1, with
silica particles B30 at a fixed volume fraction Φ = 5.0%, and without added salt. In Figure 2 we show the intensity I as a function of scattering vector q in a double logarithmic
presentation. The same data is represented in the inset of Figure 2, with the intensity
multiplied by powers of 10, starting at low pH (i.e., pH 3.9 unchanged). Let us first describe
the curves qualitatively. All of them superimpose at large q, and in the intermediate q-range,
around 3-4 10-2 Å-1, all curves display a shoulder (or even a maximum for pH 3.9). The low-q
intensity increases considerably as the pH decreases, up to very high values (105 cm-1 at q =
10-3 Å- for pH 3.9), which possibly indicate some multiple scattering. Besides the sample
made from the most acid solution, the curves show a maximum with a high intensity at low q,
and the position of this maximum shifts toward higher q as the pH increases. Note that the
two samples made from the most basic solution have also a small-q upturn. We will see later
Let us translate these trends in direct space: the more acid the conditions of synthesis, the
larger the aggregates formed by the silica. This explains both the overall increase of the
intensity, which is roughly proportional to the mass of individual aggregates, and the shift in
the low-q maximum. In this picture, the latter corresponds to a distance between these
aggregates, which is larger when the aggregates are larger, at constant volume fraction. Let us
check this model. From eq. (3) one sees that the typical range of the decay of F2(q) is of the
order of 1/Rg, the exact form of F2 being not of importance here. The argument is the
following: if one changes the scale of the system without changing the compacity of the
aggregates or the type of interaction between them, then a scaling law should relate the
intensity I(qo) of the low-q maximum to its position qo:
o 1/3
o) β q
I(q = / (5)
where β is some constant of proportionality. Physically, blowing up the system at constant silica volume fraction means increasing the distances and sizes by some factor while
increasing the volume of aggregates and thus the overall intensity by the same factor cubed.
The plot of I(qo)1/3 vs. 1/qo is shown in Figure 3. The linear relationship is quite well fulfilled.
One can conclude that our picture in real space of the aggregation is correct. Moreover, the
interaction between aggregates and their compacity do not change much as the pH changes,
i.e. the product Sagg (qo) F2agg (qo) remains approximately constant when increasing the size of
the aggregates. We will further discuss this point in section IV.
The other feature of the scattering curves is the shoulder in the intermediate q-range which is
more and more pronounced as pH increases. Its abscissa is independent of the system and
in good agreement with the observed position of the shoulder. Its enhancement can be
understood because in bigger aggregates there are more and more directly neighbouring beads
[40]. We now turn to a detailed study of the influence of Φ.
• Effect of silica volume fraction and of the silica/latex size ratio
The structure of nanocomposite films of increasing silica (B30) volume fraction Φ, without added salt and at constant pH = 9.0 has been studied. The series of spectra corresponding to Φ = 2.5%, 5.0%, 7.5%, 10.0%, 12.5% and 15.0% has been measured on instrument PACE
(LLB). They are shown in Figure 4 in I(q)/Φ representation. The spectra superimpose well at higher wave vector, and show some characteristic differences at smaller wave vectors. In the
inset of Figure 4, we plot the low-q part of the data. At low volume fractions (Φ < 7.5%) the spectra show only a soft shoulder at q ≈ 0.01 Å-1 instead of the low-q maximum described
above (cf. Figure 2). At these rather low Φ, the inter-aggregate structure factor is thus too weak to be clearly visible in the spectra. The position of the shoulder, however, is
approximately stable with the volume fraction2. At higher Φ (10.0%, 12.5% and 15.0%), the shoulder evolves into a low-q inter-aggregate correlation peak. Its position qo is shifted to
slightly higher q-values, and we will see in the discussion that this can be translated by a
roughly constant number of aggregation. In other words, as the volume fraction increases,
there is creation of new aggregates, all more or less of the same size. Two other general
features of these spectra are that the relative intensity I(q)/Φ in the range of the peak is lower for higher volume fractions, and the presence of a small-q upturn.
2 This is confirmed by the spectrum of a sample of almost identical composition (B30, Φ=5.0%, pH9.1) which
had been mesured on D11 (cf. Figure 2), thus with a higher resolution and larger q-range. A small-q upturn is also present.
The structure of nanocomposite films made up of the same nanolatex but of larger silica
spheres (B40, characterized in section III.1) has been studied in analogous series in volume
fraction, at pH 9.0 : Φ = 3.0% to 15.0%. The spectra, measured on D11, are shown in Figure 5 in I(q)/Φ representation. The good superposition of the spectra in this representation is striking. Apart from the standard high-q behavior, which superimposes again well, the main
features are the small-q upturn, followed (in q) by a plateau around q = 0.005 Å-1 up to a
shoulder around q = 0.01 Å-1.
In Figure 5, the small-q upturn is probably due to a few large aggregates, which do not
contribute to the scattering at higher angles. It is difficult to describe the scattering from these
big aggregates, as both their number and their size are unknown. Moreover, the information
contained in the spectra is incomplete due to the limited q-range. In order to extract at least
estimations of the number of big aggregates from the measured intensity, we propose in
Appendix B a simple model which relies on an assumption of the functional form of the
aggregate form factor. This allows us to estimate the product of the number and of the size of
the big aggregates from the shape and the position of the upturn. Following these calculations,
less than 10% of all silica beads are contained in the large aggregates, which have numbers of
aggregation of the order of several hundreds.
The next interesting feature is that the relative intensities I/Φ at the plateau are again in inverse order, i.e. highest for Φ = 3.0%, just like in the data series with silica B30. This is shown in the inset of Figure 5. We interpret this as another hint in favor of the picture of very
few large aggregates coexisting with individual beads. Indeed, as the size of the big
aggregates grows with increasing volume fraction, they scatter more and more at small angles
intermediate angles. In Table 2 we report the values of I at the plateau, and we compare them
to the theoretical values Itheo at the same wave vector (q ≈ 0.006 Å-1) for individual spheres.
The agreement is quite remarkable, and leads us to the following conclusion: in this system, at
pH 9.0, increasing the concentration does not increase the number of aggregation of the
majority of beads, which coexist with rare but quite large aggregates. The ratio of the
intensities gives an estimation of the average aggregation number Nagg, which is of the order
of 1 (cf. Table 2). In short, beads stay individual beads, in the whole range of volume
fractions under examination (Φ = 3.0 - 15.0 %). To cross-check this result, we have superimposed in Figure 6 a typical spectrum of the series (Φ = 6.0 %) with the form factor of the individual beads. In this case, the scattered intensity is proportional to the number of
aggregation, the volume fraction of scattering objects, and the square of their contrast with the
matrix. To account for the difference in aggregation (Nagg = 1.4, cf. Table 2), volume fraction
(Φ = 0.12% of B40 in the solution, and 6.0% of B40 in the film), and contrast conditions (∆ρsolvent-si = 2.9 1010 cm-2, ∆ρsi-la = 2.4 1010 cm-2, cf. Table 1), the intensity of the colloidal
solution has been multiplied by the appropriate constant 1.4* (6.0/0.12) *(2.4/2.9)2.
The agreement gives further credibility to our interpretation of the data, especially because the
last important feature, the shoulder, is very nicely reproduced. Note that this works equally
well with other samples of the series, whereas the analogous superposition is not possible in
the B30 series, indicating higher numbers of aggregation there. As a last point, we would like
to mention that the structure factor between individual beads should have its maximum in the
zone between q = 0.01 Å-1 and 0.02 Å-1, where it is too weak to be detected in the overall
decrease of the intensity.
We now report on a series in silica (B40) volume fraction at constant pH = 5.0, i.e. under
it was the case with the other spectra discussed before, the high-q part is simply the form
factor of the silica beads, and would superimpose well in I(q)/Φ representation. In the low-q part, a very prominent maximum can be seen. In the inset of Figure 7, we present the data in
linear form, which emphasizes this main peak. With increasing volume fraction, from 3.0% to
15.0%, the intensity increases considerably, and the peak shifts from qo=0.0020 to 0.0030 Å-1.
The intensities are very high, indicating strong aggregation. It is interesting to note that I(q)/Φ has again an inverted order in the intensity at the peak, i.e. the sample with Φ=3.0% has the highest relative peak intensity I(qo)/Φ, almost a factor of 2 higher than the 15.0%-sample.
This result is particularly striking in the presence of a structure factor peak, it can be
explained by the same type of argument as in the previous series. There the decrease of the
relative plateau intensity I/Φ could be traced back to the growth of some big aggregates. Here we have only big aggregates, and in the discussion we will show through a simulation of the
corresponding intra-aggregate structure factor Sintra(q) that the picture is correct.
• Effect of added salt
We have investigated the effect of mono-valent salt (NaCl) on the structure of the
silica-polymer nanocomposites. Salt screens the stabilizing electrostatic repulsion between colloidal
particles, and addition of high amounts leads to flocculation of the solution. Small quantities
of salt, however, may change the range of the electrostatic interaction without destabilizing
the colloid. Changes in the resulting aggregate structure (after filmification) are therefore to
be expected. To study this we have measured the intensity scattered from four films with
different conductivities Ls = 450 (no added salt), 550, 725 and 1050 µS/cm. All four have the
same volume fraction of silica B30 (Φ = 15.0 %) and a pH of 9.0 in order to start from a system with initially little aggregation. The results are shown in Figure 8, with the intensities
be interpreted along the same lines as the pH-series discussed above. The high-q scattering is
identical, and data can be brought to perfect superposition there (not shown). The low-q
structure peak moves very slightly to the left with increasing salinity (this is visible in linear
scale), and disappears completely for the highest salinity. Although we have only a few data
points, one can test the simple scaling law, eq. (5): from Ls = 450 µS/cm to Ls = 725 µS/cm
the peak shift indicates an increase in Vagg by a factor 1.5, which is not followed by the peak
height. The latter increases only a factor of 1.2, and we have two ways of interpreting this:
either the inter-aggregate structure factor weakens due to screening, or the aggregates become
less compact (higher Rg), or both. As the screening due to salt may influence both the inter-
and intra-aggregate correlations, both hypotheses seem reasonable, and a detailed modeling of
the aggregate structure and interaction would be necessary to solve this issue. What is sure is
that the aggregation number increases by 50% when adding salt up to 725 µS/cm, and above 725 µS/cm the aggregation (or even flocculation) increases too much to be followed by SANS.
IV. DISCUSSION IN TERMS OF AGGREGATION NUMBERS
We have seen in section III that the scattering from the model nanocomposite films varies
considerably with the physico-chemical conditions in solution before film formation.
Physically, this is due to the fact that the equilibrium between attractive, short-ranged van der
Waals forces and long-ranged electrostatic repulsion is modified by, e.g., addition of salt. The
effect of pH is more subtle, as it affects both the colloidal charge and the screening length.
Under low pH-conditions or high salt content, the colloidal stability is weakened. Even if the
suspension is still stable at the beginning of the drying process, it will eventually become
unstable as the concentration of ions increases also during drying. This instability favors
matrix and finally freeze the aggregation of silica. Thus, the modification of the interactions
in solution leads to a different organization of the silica in the final film, after evaporation.
The scattering from our nanocomposite films can be understood using the tools given in eqs.
(1) to (4), and a coherent description has been obtained. In particular, as we have seen in
section II, aggregation numbers can be deduced from a simple cubic lattice model, eq. (2).
Keep in mind that they are estimations (α=1), and that higher-level clustering can not be completely ruled out due to the limited q-range. However, they can be compared among each
other because the type of order is not expected to be changed fundamentally from one sample
to the next (no colloidal crystallization). Of course, the aggregation numbers are estimated
with higher precision in the presence of a well defined peak than with a soft shoulder. We
summarize all our results in Tables 3 to 6.
The series in pH, cf. Table 3, presents the most striking changes in structure. At high pH, the
number of aggregation is in the range from 4 to 8, whereas a lower bound of several thousand
is found at low pH. Let us discuss the structure of the most 'acid' sample, where a lower bound
of the aggregation number is deduced from the absence of the peak: if it exists, qo is outside
the accessible q-range: qo < 10-3 Å -1. We obtain the estimation of the aggregation number Nagg
> 5500, which in turn would give a scattered intensity of isolated aggregates for I(q→0) of
more than 5.105 cm-1. Due to the many unknown variables of the system like the aggregate
geometry (eq. (3)) and the inter-aggregate structure factor, it is no longer possible to make any
precise estimation. It is encouraging, however, that the magnitude of the scattered intensity is
of the same order as our estimation. Moreover, the data follows a power law which is very
close to q-4 over a large range at low q, indicating very compact aggregates. Note that this
this q-value, the other samples, at higher pH, have only a shoulder. The fractal dimension of
these aggregates is also reported in Table 3. As one can see, the fractal dimension decreases
from about 2.9 to 2.5 with increasing pH, i.e. the aggregates are less and less compact. This
change in compacity and therefore of the intra-aggregate structure factor is apparently
insufficient to invalidate eq.(5), as can be seen in Figure 3, but we can not exclude that
phenomena on bigger length scales, like higher-order clustering, bias the picture.
Like the pH, the quantity of added salt has a direct influence on the final structure of the film,
via the Debye screening length. The changes in scattered intensity as a function of the
quantity of added salt are much more abrupt, though, cf. Table 4. Initially, the aggregation
number stays roughly constant (i.e. below Ls = 725 µS/cm), and above this value it is already
unmeasurably high, i.e. there is no observable structure factor peak. This suggests that salt
destabilizes completely the colloidal solution at some stage of the drying process. We can
only guess about the details of this collapse, but it is interesting to see that the resulting
structure of the sample with a high quantity of added salt is different from the one at low pH
(cf. preceding paragraph): the scattered intensity is a lot weaker, and the low-q scaling of the
intensity with q is different. Although there is no clear power-law behavior, the intensity
decreases roughly like q-1 at q < 10-2 Å-1, and not at all like q-4,as in the case of the very low
pH sample. It is tempting to interpret this as scattering from one-dimensional aggregates
(chains or long branches), at least at the length-scales relevant to the scattering. This agrees
also with the less prominent peak at q ≈ 3-4 10-2 Å-1. In this case there is no possibility to
estimate the aggregation number. On a more speculative basis, the power law suggests the
Although the results are less spectacular, the series in volume fraction are equally interesting.
At high pH, cf. Table 5, there is evidence for the presence of a second, small population of
very big aggregates. The aggregation of the silica of the majority of beads does not increase
with volume fraction. A comparison of the data from the small and the larger silica beads
shows that the smaller silica beads are more aggregated by about a factor of ten.
At low pH, cf. Table 6, no evidence for a second population is found. Instead, the aggregates
are a lot bigger, they grow with volume fraction, and the degree of organization of the
structure seems very high because of the very pronounced structure factor peak. In the results
section, we have already underlined the fact that the relative peak intensities I/Φ are in inverse order. It is plausible that this is due to the decrease of the intra-aggregate structure factor
Sintra(q) between 0.002 and 0.003 Å-1 (B40, pH 5.0). We have used the estimation of the
average number of aggregation given in Table 6 as input for a simulation of the Sintra(q). In
Figure 9, three examples are shown for Nagg = 188, Nagg = 292 and Nagg = 400. Between qo =
0.0020 to 0.0030 Å-1 the curves fall steeply, which explains nicely why the peak for Φ=15%
is below the one for Φ=3% in I/Φ, instead of the higher aggregation number. Indeed, comparing in Figure 9 the value of the curve at the peak position qo = 0.0020 Å-1 for Nagg =
188 at Φ=3% to the one at 0.0030 Å-1 (the peak position at Φ=15%) for N
agg = 292, we find a
factor of 2.4. Now, with the change in volume fraction from 3% to 15%, the peak heights of
the inter-aggregate structure factor may increase with volume fraction by 20 or 30%. This
gives a total change in peak height of the intensity of a factor of 2, as observed.
We do not have any detailed physical model to explain the observed difference in aggregation
for beads of different size (B30 and B40), nor of the pH-dependence. It is interesting to note
single component at constant concentration [42,43], where the primary particle size is of little
importance. In our case, we have two components, latex and silica, and monotonously
increasing concentrations during drying. The presence of the latex which eventually forms a
continuous matrix by filmification allows to stop the aggregation of silica. We think that the
competition between the silica aggregation and the solidification of the film is the key: at low
pH, for instance, the mutual repulsion between silica beads is reduced, and beads can
aggregate before being immobilized. The size dependence is less clear. Theoretical and
experimental evidence for higher colloidal stability of bigger spheres exist [44], but it is
questionable if the small difference in size between B30 and B40 is sufficient to explain the
results. Another possibility might be the trivially a higher surface charge on the bigger
spheres. Here theoretical studies of the pair correlation functions during drying might allow
for a deeper understanding.
V. CONCLUSION
We have reported on the synthesis of a model soft-hard nanocomposite material formed from
nanolatex and nanosilica spheres. The physico-chemical parameters relevant for the synthesis
have been varied systematically, and for each sample a structural analysis by means of Small
Angle Neutron Scattering has been performed. Due to important structural changes the
observed SANS-spectra are very heterogeneous, and no simple description in terms of some
generic fitting function seems feasible. However, it has been possible to identify the main
features of the scattering function, and this has lead us to a coherent description of the
scattered intensity of all our samples. As an important result, the evolution of the average
number of aggregation could be followed and the close correlation between the parameters of
As far as theory is concerned, it would be very interesting to have a theoretical description of
the non trivial evolution of the structure with the physico-chemical parameters. Another
important issue is the modeling of the scattering curves, in order to obtain a more trustworthy
estimation of the average number of aggregation.
ACKNOWLEDGEMENTS
We are indebted to Jean-Christophe Castaing (Rhodia) for the nanolatex, and to Akzo Nobel
for the silica stock solutions. Interesting discussions with François Boué on reinforcement and
APPENDIX A
We describe the polydispersity in size of the silica beads with a log-normal distribution with
parameters Ro and σ: − o 2 2 R R ln 2σ 1 exp Rσ 2π 1 (A1)
At low concentrations, the structure factor between beads can be neglected and the scattered
intensity written as a sum over the distribution function, eq. (A1), and the form factor of
individual spheres. Several observables, which are of use for the interpretation of the data, are
then found to be directly related to various moments of the distribution. These are the low-q
limit of the intensity Io = I(q→0), the equivalent sphere radius RGuinier and the Porod radius Rp:
2 / 5 o 2 3 p 14 2 o 6 8 2 Guinier 2 / 27 3 o 2 la si 3 6 2 la si o 2 2 2 e R R R R e R R R R e R 3 4π ∆ρ Φ R R 3 4π ∆ρ Φ I σ σ σ = = = = = = − − (A2)
RGuinier is defined as the average sphere radius that yields the same low-q decay as the
polydisperse population:
( )
...(
q R 1 5 R q -1 I q I 2 Guinier 2 2 Guinier 2 o < + =)
(A3)Rp is defined as the average radius that yields the same specific surface S/V as the
p R 3 V S = Φ (A4)
APPENDIX B
We wish to estimate the importance of the population of big aggregates from the limited
information contained in the small-q upturn observed in some data sets. In our model we
assume (a) a simple functional form for the form factor of big aggregates in order to describe
the small-angle upturn, that (b) the plateau is the constant low-q part of the form factor of
individual beads, and that (c) both contributions are additive. The intensity at small and
intermediate q-values then reads:
(
)
(
(
)
)
(
qR/3)
1agg
o Φ f 1 f N 1e 1 5480cm
I = ⋅ + − − 2 2g + ⋅ − (B1)
Here f is the fraction of beads present individually. Their contribution to the scattering, 5480
cm-1, is calculated from the data for B40 given in Table 1 and the first of eqs. (A2). The form
factor of the big aggregates, in the second part of eq. (B1), is constructed by adding the high-q
(constant) and low-q (exponential) behavior. Rg is the radius of gyration of the big aggregates.
It can be deduced by fitting the data, together with the product of the number of aggregation
of the big aggregates Nagg and the fraction of beads they contain (1-f). Better fits of the upturn
are obtained with another form factor, a Lorenzian, which is also more appropriate for
non-compact structures:
(
)
1 2 2 agg o 1 /3 1 5480cm 1 N f 1 f Φ I ⋅ − + + − − + ⋅ = g R q (B2)As the number of aggregation and the size of the aggregate are linked, it is possible to exclude
certain combinations on physical grounds, like small Nagg and very big sizes. In the absence of
REFERENCES
[1] Science and Technology of Rubber; Mark, J.E.;Erman, B.; Eirich, F.R., eds; Academic
Press: San Diego; 1994
[2] Mechanical Properties of Polymers and Composites; Nielsen, L.E.; Landel, R.F.; Marcel
Dekker: New York; 1994
[3] Edwards, D.C. J Mat Sci 1990, 25, 4175
[4] Boonstra, B.B. Polymer 1979, 20, 691
[5] Medalia, A.I. J Coll Int Sci 1970, 32, 115
[6] Voet A. J Polym Sci: Macrom Rev 1980, 15, 327
[7] Westermann, S.; Kreitschmann, M; Pyckhout-Hintzen, W.; Richter, D.; Straube, E.;
Farago, B.; Goerigk, G Macromolecules 1999, 32, 5793
[8] Botti A.; Pyckhout-Hintzen, W.; Richter, D.; Straube, E.; Urban, V.; Kohlbrecher, J.
Physica B (Amsterdam) 2000, 276, 371
[9] Nakatani, A.I.; Cen, W.; Schmidt, R.G.; Gordon, G.V.; Han, C.C. Polymer 2001, 42, 3713
[10] Heinrich, G; Vilgis, T.A. Macromolecules 1993, 26, 1109
[11] Sharaf, M.A.; Kloczkowski, A.; Mark, J.E. Comp Polym Sci 1994, 4, 29
[12] Kloczkowski, A.; Sharaf, M.A.; Mark, J.E. Chem Eng Sci 1994, 49, 2889
[13] Vacatello, M. Macromolecules 2001, 34, 1946
[14] Vidal, A.; Donnet, J.B. Prog Coll Polym Sci 1987, 75, 201
[15] Payne, A.R. in Reinforcement of Elastomers; Kraus, G.; ed.; Interscience Publishers:
New York; 1965
[16] Scott, C.; Ishida, H.; Maurer, F.H.J. J Mat Sci 1991, 26, 5708
[17] Maier, P.; Goeritz, D. Kautsch Gummi Kunstst 1996, 49, 18
[19] Kraus, G. J Appl Polym Sci: Appl Polym Symp 1984, 39, 75
[20] Ehrburger-Dolle, F.; Hindermann-Bischoff, M.; Livet, F.; Bley, F.; Rochas, C.; Geissler,
E. Langmuir 2001,17, 329
[21] Rieker, T.P.; Misono, S.; Ehrburger-Dolle, F. Langmuir 1999, 15, 914
[22] Inoue, T.; Moritani M.; Hashimoto T.; Kawai, H. Macromolecules 1971, 4, 500
[23] Polmanteer, K.E.; Lenz, C.W. Rub Chem Techn 1975, 48, 795
[24] McCarthy, D.W.; Mark, J.E.; Schaefer, D.W. J Polym sci B 1998, 36, 1167
[25] McCarthy, D.W.; Mark, J.E.; Clarson, S.J.;Schaefer, D.W. J Polym sci B 1998, 36, 1191
[26] (a) Rharbi , Y. ; Joanicot, M.; Vacher, A. ; Cabane, B. ; Boué, F. Europhys Lett 1999, 46,
472 (b) Rharbi,Y. ; Boué, F.; Joanicot, M.; Cabane, B. Macromolecules 1996, 29, 4346
[27] Huber, G.; Vilgis, T.A.; Heinrich, G. J Phys: Condens Matter 1996, L409
[28] Witten, T.A. ; Rubinstein, M. ; Colby, R.H. J. Phys II (France) 1993, 3, 367
[29] Ahmed, S.; Jones, F.R. J Mat Sci 1990, 25, 4933
[30] Sharaf, M.A.; Kloczkowski, A.; Mark, J.E. Comp Theo Polym Sci 2001, 11, 251
[31] Wang, S.; Mark, J.E. Macromolecules 1990, 23, 4288
[32] Winnik, M.A. Curr Op Coll Int Sci 1997, 2, 192
[33] Joanicot, M.; Wong, K.; Cabane, B. Macromolecules 1996, 29, 4976
[34] Dingenouts, N.; Ballauf, M. Langmuir 1999, 15, 3283
[35] Calmettes, P. J Phys IV 1999, 9, 83
[36] Neutrons, X-ray and Light Scattering; Lindner, P. ; Zemb, Th.; eds.; North Holland, 1991
[37] Lairez, D. J Phys IV 1999, 9, 67
[38] Small Angle X-Ray Scattering; Glatter, O., Kratky O.; Academic Press London; 1982
[39] Small-Angle Scattering of X-Rays; Guinier, A.; Fournet, G.; John Wiley & Sons; 1955
[41] (a) Hamsy, A.; Vacher, R.; Jullien, R. Phys Rev B 1994, 50, 1305
(b) Hamsy, A.; Anglaret, E.; Foret, M.; Pelous, J.; Jullien, R. Phys Rev B 1994, 50, 6006
[42] Martin, J.E.; Wilcoxon, J.P.; Schaefer, D.;Odinek, J. Phys Rev A 1990, 41, 4379
[43] Zhou, Z.; Chu, B.; J Coll Int Sci 1991, 143, 356
[44] (a) Behrens, S.H..; Borkovec, M.; Schurtenberger, P.; Langmuir 1998, 14, 1951
(b) Behrens, S.H..; Christl, D.I.; Emmerzael, R.; Schurtenberger, P.; Borkovec, M.;
Langmuir 2000, 16, 2566
TABLE CAPTIONS
Table 1: Characterization of colloidal samples. ρ is the scattering length density. Ro and
σ are the parameters of the log-normal distribution used to fit the scattering curves of dilute solutions. V is the average volume of a bead. Rp and RGuinier are
defined in Appendix A.
Table 2: The observed plateau intensity (in cm-1) for the series in volume fraction Φ,
silica B40 and pH 9.0. It is compared to the theoretical intensity for individual
beads at the same volume fraction and under identical contrast conditions. The
average aggregation number is estimated through the ratio of the two
intensities. It reflects the fact that the majority of the beads are individual
beads.
Table 3: Estimation of the average aggregation number through the position of the
structure factor peak for the series in pH, silica B30, at Φ = 5.0%. The slope at intermediate angles (q > qo, the position of the structure factor peak), gives the
fractal dimension of the aggregates. The small-q upturn can be attributed to the
presence of very few, big aggregates. For the most 'acid' sample, a lower bound
of the aggregation number is deduced from the absence of the peak.
Table 4: Estimation of the average aggregation number through the position of the
structure factor peak for the series in added salt, silica B30, at pH 9.0 and
volume fraction Φ = 15.0 %. The small-q upturn can be attributed to the presence of very few, big aggregates.
Table 5: Estimation of the average aggregation number through the position of the
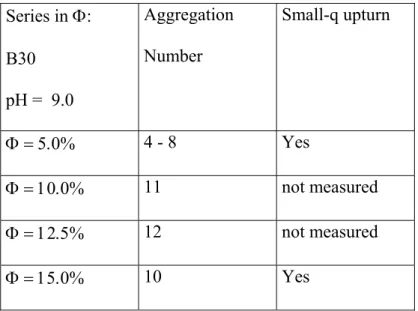
structure factor peak for the series in volume fraction Φ, silica B30, at pH 9.0. The small-q upturn and the peak position could not be measured for Φ = 2.5% and 7.5%.
Table 6: Estimation of the average aggregation number through the position of the
structure factor peak for the series in volume fraction Φ, silica B40, at pH 5.0. No small-q upturn is ever observed.
TABLES Table 1: ρ (1010 cm-2) R Guinier( Å) Rp (Å) Ro (Å) σ V (106 Å3) B30 3.5 98 83.8 76.9 0.186 2.23 B40 3.3 160 113.8 92.6 0.279 4.72 Nanolatex 0.9 210 152.7 138.9 0.243 14.64 Table 2: Series in Φ: B40 pH 9 Iplateau (cm-1) Itheo(q ≈ 0.006Å-1) (cm-1) Nagg Φ = 3.0% 230 146 1.6 Φ = 6.0% 400 293 1.4 Φ = 9.0% 515 439 1.2 Φ = 12.0% 635 586 1.1 Φ = 15.0% 810 732 1.1
Table 3 : Series in pH: B30 Φ = 5.0% Aggregation Number (α = 1) Slope at intermediate q Small-q upturn pH = 3.9 > 5500 I ∝ q-3.8 over a decade No 5.1 429 I ∝ q-2.9 No 6.0 273 I ∝ q-2.8 No 7.0 92 I ∝ q-2.6 No 8.0 10 I ∝ q-2.5 Yes, I ∝ q-3.3 in short q-range 9.1 4 - 8 I ∝ q-2.5 Yes, I ∝ q-1.5 Table 4: Series in salinity: B30 Φ = 15.0% pH = 9 Aggregation Number Small-q upturn 450 µS/cm (no added salt)
10 Yes 550 µS/cm 15 Yes 725 µS/cm 15 Yes 1050 µS/cm Unknown, presumably very high No
Table 5: Series in Φ: B30 pH = 9.0 Aggregation Number Small-q upturn Φ = 5.0% 4 - 8 Yes Φ = 10.0% 11 not measured Φ = 12.5% 12 not measured Φ = 15.0% 10 Yes Table 6: Series in Φ: B40 pH = 5.0 Aggregation Number Φ = 3.0% 188 Φ = 6.0% 168 Φ = 9.0% 196 Φ = 12.0% 238 Φ = 15.0% 292
FIGURE CAPTIONS
Figure 1: Scattered intensity I in cm-1 as a function of scattering wave vector q in Å-1
from dilute solutions of B30 (circles) and B40 silica (squares, I(q) multiplied
by 10 for clarity). The fits include a log-normal size distribution (shown in the
inset) and the resolution function of the spectrometer. The parameters are listed
in Table 1.
Figure 2: Scattered intensity I in cm-1 as a function of scattering wave vector q in Å-1
from nanocomposites films of silica B30 at fixed volume fraction Φ = 5.0%, for different pH values, no added salt: (○) pH 3.9, (□) pH 5.1, (◊) pH 6.0, (x)
pH 7.0, (+) pH 8.0, (∆) pH 9.1. In the inset the same data is shown, with the
intensities multiplied by powers of 10, starting at low pH.
Figure 3: Low-q maximum intensity I(qo)1/3 (in cm-1/3) vs. 1/qo (in Å) for the data shown
in Figure 2. The line is a guide to the eye. See text for details.
Figure 4: Relative scattered intensity I/Φ in cm-1 as a function of scattering wave vector q
in Å-1 from nanocomposites films of silica B30 at fixed pH = 9.0, for
increasing volume fraction Φ, no added salt. In the inset a close-up of the low-q region is shown.
Figure 5: Relative scattered intensity I/Φ in cm-1 as a function of scattering wave vector q
increasing volume fraction Φ, no added salt. In the inset a close-up of the plateau region is shown, in linear scale.
Figure 6: Comparison of scattered intensity I in cm-1 as a function of scattering wave
vector q in Å-1 of a nanocomposites film (silica B40, pH = 9.0, Φ = 6.0 %) and of the dilute solution of B40, rescaled by the appropriate factor, see text for
details.
Figure 7: Scattered intensity I in cm-1 as a function of scattering wave vector q in Å-1
from nanocomposites films of silica B40 at fixed pH = 5.0, for increasing
volume fraction Φ, no added salt. In the inset the low-q intensity is shown in linear scale.
Figure 8: Scattered intensity I in cm-1 as a function of scattering wave vector q in Å-1
from nanocomposites films of silica B30 at fixed volume fraction Φ = 15.0%, fixed pH = 9.0, for different conductivities Ls in µS/cm. The intensities are
multiplied by powers of 10, starting at low Ls.
Figure 9: Simulation result of the intra-aggregate structure factor Sintra(q) as a function of