Ultra-depleted melts in olivine-hosted melt inclusions from the
1Ontong Java Plateau.
2M.G. Jackson1, R.A. Cabral2, E.F. Rose-Koga3, K.T. Koga3, A. Price1, E.H. Hauri4, P. 3
Michael5 4
1
University of Calfornia Santa Barbara, Department of Earth Science, Santa Barbara, 5
CA, 93109-9630, USA (jackson@geol.ucsb.edu) 6
2
Boston University, Department of Earth & Environment, Boston, MA, 02215, USA 7
(racabral@bu.edu) 8
9 3
Université Blaise Pascal - CNRS - IRD, Laboratoire Magmas et Volcans, OPGC, 10
Clermont-Ferrand, France (e.koga@opgc.univ-bpclermont.fr, k.koga@opgc.univ-11
bpclermont.fr ) 12
4
Department of Terrestrial Magnetism, Carnegie Institution of Washington, Washington, 13
DC 20015, USA (ehauri@ciw.edu) 14
5
Department of Geosciences, University of Tulsa, Tulsa, OK, 74104, 15 USA(pjm@utulsa.edu) 16 17 Abstract 18
The Ontong Java Plateau (OJP) represents the largest large igneous province
19
(LIP) preserved in the geologic record. The most voluminous volcanic types of the
20
OJP—the Kroenke and Kwaimbaita groups, which dominate the accessible portions
21
of the plateau—have relatively flat primitive mantle normalized rare earth element
22
(REE) patterns. With the exception of relatively small volumes of late-stage melts—
23
referred to as the Singgalo group—that are characterized by slightly enriched REE
24
patterns relative to a chondritic pattern, the volcanic groups that dominated the
25
eruptive history of the OJP exhibit remarkably homogeneous, flat REE patterns.
26
Here we isolate, for the first time, olivine-hosted melt inclusions from OJP. We show
27
that the melt inclusions have two clear populations defined by distinct trace element
characteristics. The first population has relatively flat trace element patterns that
29
are similar to those observed in whole rock lavas from the most voluminous volcanic
30
groups (Kroenke and Kwaimbaita) recorded in the OJP. In contrast, a second group
31
of melt inclusions, referred to as UDM (ultra-depleted melt) inclusions, exhibit
32
(light-REE) LREE-depleted patterns relative to a chondritic pattern; these trace
33
element patterns are far more depleted than any previously reported lava from
34
OJP. The UDM have unique trace element signatures that preclude an origin by
re-35
melting the depleted mantle source left over after melt extraction during
36
construction of the OJP. We interpret the new UDM compositions to be the result of
37
melting a previously unrecognized (in lavas) ultra-depleted component hosted in the
38
OJP mantle source.
39 40 41
1. Introduction
42
Large igneous provinces (LIPs) represent the largest outpourings of lava in the 43
geologic record (Coffin and Eldholm, 1994). Ontong Java Plateau (OJP) is the largest 44
LIP preserved on Earth and has an estimated volume of 44.4 million km3 (Coffin and 45
Eldholm, 1994; Coffin and Eldholm, 2000), a crustal thickness of approximately 30 km 46
(Richardson et al., 2000; Miura et al., 2004), and a surface area that is roughly equivalent 47
to Western Europe (Fitton and Godard, 2004). The bulk of the plateau was extruded at 48
~120 Ma (Mahoney et al., 1993, 2001; Tejada et al., 1996, 2002, 2004, 2013; Parkinson 49
et al., 2001; Chambers et al., 2004) on top of young (15-30 Ma) oceanic crust (Larson, 50
1997), but the Pacific lithospheric upon which the OJP was erupted may have been as old 51
as 40 Ma at the time of eruption (Ishikawa et al., 2011). A later stage of volumetrically-52
less extensive volcanism may have occurred at 90 Ma (Mahoney et al., 1993; Tejada et 53
al., 1996, 2002), but the occurrence of the 90 Ma episode is still debated (Chambers et al., 54
2002). Taylor (2006) argued that the OJP represents a portion of an even larger LIP that 55
was composed of the OJP, Manihiki (8.8 million km3) and Hikurangi Plateaus (2.7 56
million km3), and following eruption, this ―super LIP‖ rifted apart into these three 57
separate plateaus. The origin of the OJP is the source of significant controversy. The OJP 58
has been suggested to be a product of melting a thermally-buoyant mantle plume 59
(Mahoney and Spencer, 1991; Richards et al., 1991; Tejada et al., 2004; Fitton and 60
Godard, 2004; Ito and Clift, 1998), melting of a largely primitive (but non-chondritic) 61
mantle component (Jackson and Carlson, 2011), entrainment and melting of eclogite-62
bearing mantle near a spreading center (Korenaga et al., 2005), or melting that resulted 63
from a giant bolide impact (Rogers, 1982; Ingle and Coffin, 2004). 64
Lavas from the OJP have been sampled at eight deep sea drilling sites (Mahoney 65
et al., 1993) and along a > 3.5 km thick section in the Solomon Islands which was thrust 66
upwards when the OJP ―docked‖ with the Solomon arc at 27 to 23 Ma (Coleman and 67
Kroenke, 1981; Cooper and Taylor, 1985; Neal et al., 1997; Petterson et al., 1997; Tejada 68
et al., 2002). OJP lavas record three distinct geochemical types (e.g., Tejada et al., 1996; 69
2002; 2004; Neal et al., 1997; Fitton and Godard, 2004). The Kwaimbaita- and Kroenke-70
type lavas dominate the bulk of the OJP. Kwaimbaita-type lavas are voluminous but 71
fractionated, while Kroenke-type lavas are less evolved (9-10.5 wt.% MgO) and may be 72
parental to the Kwaimbaita lavas, which have identical radiogenic isotopic signatures 73
(Tejada et al., 2004; Fitton and Godard, 2004). Kroenke-type lavas have been found in 74
just two drill sites, ODP Sites 1185 and 1187. The Kroenke and Kwaimbaita-type lavas 75
have relatively flat primitive mantle normalized rare earth element (REE) patterns 76
(Tejada et al., 2004; Fitton and Godard, 2004), Sr and Nd isotope ratios that are less 77
geochemically depleted than MORB (mid-ocean ridge basalt; Gale et al., 2013), and Pb-78
isotopic compositions that plot near the geochron (Tejada et al., 2004; Jackson and 79
Carlson, 2011). 80
The trace element and isotopic characteristics indicate that the Kwaimbaita and 81
Kroenke-type lavas are derived from a mantle source that is less geochemically depleted 82
than the depleted MORB mantle (DMM) (Tejada et al., 2004). This mantle source may 83
actually be a primitive (but non-chondritic) mantle domain (Jackson and Carlson, 2011) 84
if the superchondritic 142Nd/144Nd in accessible terrestrial mantle rocks is the result of 85
higher Sm/Nd in the bulk silicate Earth relative to chondrites (Boyet and Carlson, 2005; 86
Caro et al., 2008; Caro and Bourdon, 2010; Jackson et al., 2010; Jackson and Jellinek, 87
2013). 88
Singgalo-type lavas represent a volumetrically smaller volcanic type at OJP, 89
forming a thin late-stage veneer over the Kroeneke and Kwaimbaita-type lavas, and are 90
thought to be the result of melting a slightly more enriched mantle source (lower 91
143
Nd/144Nd, higher 87Sr/86Sr and 206Pb/204Pb, and a slight relative enrichment in 92
incompatible trace elements) than sampled by Kroenke and Kwaimbaita-type lavas 93
(Tejada et al., 2002, 2004; Fitton and Godard, 2004). While Singgalo lavas sample a 94
mantle source that is slightly more enriched than Kroenke and Kwaimbaita-type lavas, to 95
geochemically-depleted component than observed in the Kroenke and Kwaimbaita-type 97
lavas. 98
Here we present a major, trace, and volatile element study of olivine-hosted melt 99
inclusions hosted in a single Kroenke-type OJP basaltic sample from a drill core at ODP 100
site 1187. Melt inclusions can trap heterogeneous melts prior to complete melt mixing, 101
and thus provide an opportunity to characterize more of the chemical diversity that exists 102
in melts that is not detectable in whole rock compositions. However, melt inclusion 103
studies of the OJP have been hampered by a general lack of olivine-bearing basalt 104
throughout the plateau. Olivines are extremely rare in OJP lavas, and when present, they 105
are often small and/or altered (see Supplementary Materials). Here we report fresh 106
olivines that host small (from 13 to 94 microns, long axis dimension) melt inclusions 107
(Supplementary Fig. 1 and Supplementary Table 1). To our knowledge, these represent 108
the first olivine-hosted melt inclusions identified in the OJP. The inclusions are of two 109
types: The ―normal-type‖ inclusions exhibit relatively flat primitive mantle normalized 110
REE patterns that are similar to those observed in whole rock analyses of Kroenke-type 111
lavas, while the second type of inclusions, UDM (ultra-depleted melt) inclusions—which 112
exhibit greater incompatible element depletion than observed in the host whole rock 113
composition—are evidence for a previously unrecognized geochemical component in the 114 OJP lavas. 115 116 2. Methods 117
The inclusions analyzed in this study are all hosted in olivines that were separated 118
from a single whole rock sample (ODP drill core sample 192-1187A-006R-06W [110-119
129 cm]). We hand crushed 100 g of lava (representing most of the available, olivine-rich 120
material) in a mortar and pestle and obtained just 60 mg of olivine grains. Twenty-eight 121
olivine grains hosted visible inclusions, and only 15 olivine grains (hosting 19 inclusions; 122
Supplementary Table 1) had sufficiently large inclusions for homogenization, exposure 123
and analysis. Images of each melt inclusion analyzed in this study are shown in 124
Supplementary Figure 1. 125
Unfortunately, all melt inclusions in the studied hand sample were crystalline. 126
Melt inclusions were individually homogenized on a Vernadsky-style heating stage 127
mounted under a microscope at the Laboratoire Magmas et Volcans at the Université 128
Blaise Pascal in Clermont-Ferrand, France. This allowed us to visually confirm 129
homogenization of the inclusion and discard inclusions that burst or leaked and annealed 130
during the heating process. As described in Le Voyer et al. (2008), the homogenization 131
was carried out at 1 atm, the temperatures were monitored with a thermocouple, and the 132
samples were bathed in purified helium gas during homogenization and kept at an oxygen 133
fugacity between 10-10 and 10-9 atm. The inclusions were raised from room temperature 134
to the liquidus temperature within a span of 20 minutes, and then quenched. Chen et al. 135
(2011) and Gaetani et al. (2012) demonstrated that homogenization, following the 136
Clermont procedure on the heating stage, does not result in measurable hydrogen loss 137
from the inclusion. Following homogenization, the inclusions were mounted on glass 138
slides and individually exposed using silicon carbide paper, followed by polishing using 139
diamond suspension and 0.3 µm alumina paste. Following exposure and polishing, each 140
olivine-hosted inclusion was pressed into an aluminum mount filled with indium. The 141
mount was cleaned using milliQ water and ethanol prior to volatile, trace and major 142
element analyses. 143
Trace element analyses were carried out using the Cameca 6F ion microprobe at 144
Arizona State University (ASU) and the analytical protocols follow those detailed in 145
Wanless et al. (2014) and Cabral et al. (2014). A 16O- primary beam was accelerated to 146
12.5 kV with a current of 10 nA. The sample was held at 9 kV, and an ―energy filtering‖ 147
window of 75 ± 20 eV was used to reduce molecular ions; this approach has been used 148
successfully in other labs (e.g., Shimizu et al., 1978; Zinner and Crozaz, 1986) and at 149
ASU (Wanless et al., 2014; Cabral et al., 2014). Samples were pre-sputtered for 200 150
seconds prior to analysis, and each analysis consisted of 20 individual cycles of analyses 151
of the following isotopes with the following dwell times: 30Si (1 s), 47Ti (2 s), 88Sr (2 s), 152
89
Y (2 s), 90Zr (2 s), 93Nb (2 s), 138Ba (2 s), 139La (3 s), 140Ce (3 s), 141Pr (3 s), 144Nd (3 s), 153
147
Sm (3 s), 174Yb (5 s), and 180Hf (5 s). Four basaltic reference glasses (KL2-G, BCR-2G, 154
BHVO-2G, and ALV519-4-1; Gale et al., 2013; Jochum and Nohl, 2008; Melson et al., 155
2002) were measured to generate working curves, and ALV519-4-1 was also used as a 156
secondary standard to monitor drift. Fifteen analyses of glass sample ALV-519-4-1 (trace 157
element abundances reported in Gale et al. [2013] and Melson et al. [2002]) were carried 158
out during the course of the analytical session, and are reported in Supplementary Table 159
2, together with reproducibility for trace element analysis: Ti (±2.5% of the value 160
reported, 2σ standard deviation), Sr (±5.3%), Y (±2.4%), Zr (±4.0%), Nb (±8.9%), Ba 161
(±8.8%), La (±4.3%), Ce (±4.5%), Pr (±9.6%), Nd (±9.5%), Sm (±18.3%),Yb (±10.7%), 162
and Hf (±16.6%). 163
Volatile (H2O, CO2, F, S, Cl) and P analyses were carried out at the Department 164
of Terrestrial Magnetism, Carnegie Institution of Washington, using the 6F Cameca ion 165
microprobe (Supplementary Table 1). In short, a 14nA Cs+ primary beam was used to 166
sputter samples, and an electron gun was used to compensate for charge buildup. Samples 167
were pre-sputtered for five minutes to eliminate surface contamination prior to analysis, 168
and the masses of interest were measured five times with the following dwell times: 12C 169
(10 s), 17OH (5 s), 19F (5 s), 30Si (5 s), 31P (5 s), 32S (5 s), and 35Cl (5 s). A 12C ion image 170
of each melt inclusion was examined prior to analysis to avoid any visible surface 171
contamination, and analyses that exhibited drift in 12C/30Si over the course of an analysis, 172
indicative of surface contamination, were discarded. ALV519-4-1 was used as a 173
secondary standard to correct for drift. Five analyses of submarine glass sample D52-5 174
(volatiles are reported in Simons et al., 2002) were carried out during the course of the 175
analytical session, and are reported in Supplementary Table 2. Following correction for 176
drift and offset, we report the following reproducibility for each of the following 177
elements in D52-5: H2O (±9.9%, 2σ standard deviation), CO2 (±10.3%), F (±6.8%), S 178
(±3.8%), Cl (±2.8%), and P (±1.7%). 179
Electron microprobe measurements were carried out using the electron 180
microprobe facility at the University of Toronto on a Cameca SX-50, and the major 181
element data are presented in Supplementary Table 1. Olivine analyses were carried out 182
using a focused beam. For glass analyses, a defocused beam was used and employed a 15 183
kV accelerating voltage and a 10 nA beam current. We report the following precision for 184
major element analyses of glass by electron microprobe: SiO2 (±0.65 wt.%, 2σ standard 185
deviation), TiO2 (±0.16 wt.%), Al2O3 (±0.26 wt.%), FeO (±0.32wt.%), MgO (±0.25%), 186
CaO (±0.28 wt.%), Na2O (±0.12 wt.%), MnO (±0.08 wt.%), K2O (±0.04 wt.%), P2O5 187
(±0.06 wt.%). 188
CO2 analyses by ion microprobe preceded electron microprobe analyses in order 189
to avoid surface contamination from the carbon coat that is required for major element 190
analyses by electron probe. Unfortunately, there was insufficient melt inclusion material 191
remaining for electron probe analyses following ion probe analyses for inclusions 2B and 192
9C in this study (which lack major element data; Supplementary Table 1). 193
Whole rock major and trace element analyses of a portion of the same sample 194
from which the olivines (and their inclusions) were separated were performed at the 195
GeoAnalytical Lab at Washington State University (WSU). Major elements were 196
measured by X-ray fluorescence (XRF), and trace elements were measured by 197
inductively-coupled plasma mass spectrometry (ICP-MS). Precision for the analyses of 198
SiO2, Al2O3, TiO2 and P2O5 in basalts is 0.11 – 0.33% (1σ) of the amount present, and 199
0.38 – 0.71% (1σ) of the amount present for FeO, MgO, CaO, Na2O, MnO and K2O 200
(Johnson et al., 1999). Trace element analyses by ICP-MS have a precision of 0.77 – 201
3.2% (1σ) (Knaack et al., 1994). 202
203
3. Results and Observations
204
3.1 Major element abundances in OJP melt inclusions 205
Like all whole rock lava and glass compositions obtained from OJP drill sites, the 206
melt inclusions are tholeiitic (Fig. 1). The melt inclusions are hosted in olivines with 207
forsterite compositions ranging from 86 to 89, except for one Fo83 olivine 208
(Supplementary Table 1). After the major element compositions of the inclusions are 209
corrected to be in equilibrium with the host olivine by equilibrium olivine addition or 210
subtraction (assuming an olivine-melt Kd of 0.3 [Roeder and Emslie, 1970; Ford et al., 211
1983] and 10% of the total Fe is Fe3+), the inclusions have MgO abundances that are 212
similar to those previously identified in Kroenke-type lavas (Fig. 1 and Supplementary 213
Table 1; unless stated otherwise, melt inclusion major, trace and volatile element 214
abundances presented in the text and figures are adjusted for this olivine fractionation 215
correction). With the exception of inclusion #2—which has the lowest MgO in the 216
inclusion suite—SiO2 abundances of the inclusions fall in the range previously identified 217
for Kroenke-type lavas (Supplementary Table 1). Two inclusions (#25 and #27) have 218
anomalously high alkali abundances compared to the whole rock and the other inclusions; 219
we do not have an explanation for the alkali element enrichment, but we note that these 220
two inclusions plot well within the tholeiite field defined by OJP whole rocks and glasses 221
in Fig. 1. A group of inclusions have anomalously low (La/Yb)N (where N represents 222
normalization to the primitive mantle composition of McDonough and Sun, 1995) 223
compared to previously analyzed whole rocks and pillow glasses from the OJP. The 224
inclusions with low (La/Yb)N values are discussed below, and are referred to as UDM 225
inclusions hereafter. In major element variation diagrams (Fig. 1), the UDM inclusions 226
do not exhibit clear major element compositional differences compared to the inclusions 227
that have ―normal‖ (La/Yb)N values, except for the possible exception of TiO2, which 228
tends to be lower in the UDM inclusions. The slightly lower TiO2 in the UDM inclusions 229
relative to the inclusions with normal (La/Yb)N is reflected in higher Na2O/TiO2 in the 230
former group (Fig. 1). In a plot of CaO/Al2O3 versus Na2O/TiO2 (Fig. 1), the UDM 231
inclusions are resolved from the normal-type inclusions and from previously examined 232
whole rocks and pillow glasses from the OJP. 233
Finally, Nb and La concentrations in the melt inclusions are plotted against MgO 234
in Fig. 1. These two highly incompatible trace elements are depleted in the UDM 235
inclusions compared to the normal type inclusions, even thought both types of inclusions 236
span a similar range of MgO. The normal type inclusions have Nb and La concentrations 237
that are similar to concentrations observed in whole rock analyses from the OJP. In 238
contrast, the UDM inclusions have Nb and La concentrations that are lower than 239
previously observed in OJP lavas. 240
3.2. Incompatible trace element patterns in OJP melt inclusions 241
Primitive mantle (McDonough and Sun, 1995) normalized trace element patterns 242
reveal two groups of melt inclusions. The first group of inclusions has trace element 243
patterns that are most similar to those of whole rock analyses of Kroenke-type OJP lavas 244
(Fig. 2). The observation of these ―normal-type‖ (i.e., Kroenke-type) inclusions is 245
expected, as the olivines hosting the melt inclusions were isolated from a Kroenke-type 246
lava. However, seven of the melt inclusions, referred to as UDMs, exhibit (La/Yb)N ratios 247
(0.18-0.32) that are up to four times lower than previously observed in any lava erupted 248
at the OJP. Like the Kroenke-type lavas, Kwaimbaita lavas exhibit trace element patterns 249
that are relatively flat, but shifted vertically relative to the Kroenke-type lavas (Fig. 2); 250
this supports the hypothesis that Kroenke-type lavas are parental to (and therefore have 251
lower incompatible trace element concentrations than) the more evolved Kwaimbaita-252
type lavas (Fitton and Godard, 2004). Singgalo-type lavas have trace element patterns 253
that exhibit slight enrichment in the incompatible trace elements relative to Kroenke and 254
Kwaimbaita-type lavas (Figs. 2 and 3). 255
Two different melt inclusions hosted in the same olivine (inclusions 10A and 10B 256
from olivine 10; Table 1) have the same normal-type trace element patterns. Similarly, 257
two different sets of melt inclusions from two different olivines are UDM inclusions 258
(inclusions 7A and 7B from olivine 7, and inclusions 9B and 9C from olivine 9; 259
Supplementary Table 1). No examples of inclusions where normal-type and UDM 260
inclusions are hosted in the same olivine were found. 261
There are several trace element ratios in the melt inclusion suite that clearly 262
resolve the UDM inclusions from the normal-type inclusions, and demonstrate that the 263
UDM inclusions are more depleted in incompatible trace elements than any melts 264
previously identified in the OJP. In addition to having lower (La/Sm)N, the UDM 265
inclusions have lower Nb/Zr and higher Ti/Zr than the normal-type inclusions (Fig. 3). 266
The trace element ratios of the normal-type inclusions overlap with the ratios identified in 267
the freshest Kroenke and Kwaimbaita-type lavas, while Singgalo-type lavas define a level 268
of incompatible trace element enrichment that is greater than observed in the melt 269
inclusion suite and in the Kroenke and Kwaimbaita-type lavas. In summary, no previous 270
melts from the OJP have been observed to exhibit the level of extreme incompatible 271
element depletion observed in the UDM inclusions. 272
One inclusion, UDM inclusion #25, has a large positive Sr anomaly on a primitive 273
mantle normalized trace element pattern (Fig. 2). This inclusion is also enriched in Ba. 274
Large positive anomalies of Sr and Ba are common in gabbros, which relates to 275
enrichment of Sr and Ba in plagioclase, an abundant phase in gabbros (e.g., Sobolev et 276
al., 2000; Saal et al., 2007; Danyushevsky et al., 2003). Additionally, there is a general 277
shift towards more plagioclase-like (low) CaO/Al2O3 ratios in the OJP inclusions with 278
positive Sr anomalies. The inclusions with the largest positive Sr-anomalies (i.e., the 279
highest Sr/Sr* values, where Sr/Sr* = SrN/(SmN*NdN)0.5), all with values from 1.23 to 280
1.44, also have the lowest CaO/Al2O3 ratios (Fig. 3). The Gabal Gerf plagioclase 281
composition from Sobolev et al. (2000) has low CaO/Al2O3 (0.40) and high Sr/Sr* (3.3), 282
and anchors the low CaO/Al2O3 and high Sr/Sr* portion of the melt inclusion trend (Fig. 283
3). We find no relationship between indicators of trace element depletion, like (La/Yb)N, 284
and trace element proxies for a plagioclase-rich lithology, like Sr/Sr* (Fig. 3). A role for 285
a plagioclase signature in the OJP melt inclusions is discussed below. 286
3.3. Volatile abundances in OJP melt inclusions. 287
3.3.1. Chlorine 288
Cl/K ratios range from 0.19 to 4.3 over the entire melt inclusion suite. Cl/K ratios 289
> 0.07 have been suggested to be the result of assimilation of hydrothermally altered 290
material (Jambon et al., 1995; Kent et al. 1999a, 1999b; Lassiter et al., 2002; Michael and 291
Schilling, 1989; Michael and Cornell, 1998; Stroncik and Haase, 2004; Kendrick et al., 292
2013). A similar range of elevated Cl/K ratios (0.22 to 2.8) was identified in pillow 293
glasses obtained from a drill core of the OJP (Michael, 1999; Roberge, 2004). Both UDM 294
and normal-type inclusions have similarly high Cl/K. 295
3.3.2. H2O 296
The OJP melt inclusions have H2O concentrations (0.11 to 0.70 wt.%, see Fig. 4 297
and Supplementary Table 1) that are similar to the range identified in pillow glasses from 298
the OJP drill sites, where H2O is 0.13 to 0.49 wt.% (Michael, 1999; Roberge et al., 2004, 299
2005). When H2O is normalized to Ce, a non-volatile trace element that is thought to 300
have similar solid-melt partition coefficients to H2O during mantle melting and fractional 301
crystallization (Michael, 1995; Dixon et al., 2002), the H2O/Ce ratios extend to 302
remarkably high values. The H2O/Ce ratios in the normal-type inclusions range from 217 303
to 709, and the UDM inclusions have H2O/Ce ratios that are even higher, ranging from 304
1853 to 2508. The higher H2O/Ce in the UDM inclusions generally reflects lower Ce, not 305
higher H2O. 306
3.3.3. CO2 307
The melt inclusions exhibit CO2 concentrations (18-184 ppm, see Fig. 4) that fall 308
within the range measured in OJP glasses (19-223 ppm; Michael, 1999; Roberge et al., 309
2004). Owing to the low solubility of CO2 in silicate melts, most of the CO2 in a primary 310
melt is degassed prior to extrusion of melt on the seafloor or prior to entrapment of melts 311
in olivines. When CO2 is normalized to Nb, an incompatible trace element assumed to 312
have mineral-melt partition coefficients similar to CO2 during mantle melting and 313
fractional crystallization (e.g., Saal et al., 2002), the CO2/Nb ratios vary from 9 to 69 in 314
the normal-type inclusions, and from 92 to 351 in the UDM inclusions. The CO2/Nb 315
ratios in the normal-type inclusions are all lower than the value of ~300 suggested for the 316
depleted upper mantle (Koleszar et al., 2009). The higher CO2/Nb ratios observed in the 317
UDM inclusions extend above values proposed for the depleted upper mantle, but are still 318
settings (Cartigny et al., 2008). Koleszar et al (2009) found an extremely high CO2/Nb 320
ratio (1879) in a UDM melt inclusion from the Galapagos Islands, and they suggested 321
that such a high ratio is not driven by unusually high CO2, but by the low abundances of 322
incompatible trace elements. 323
3.3.4. Fluorine 324
The F abundances reported in the melt inclusion suite are the first reported in 325
lavas from the OJP. Concentrations of F are lower in the UDM inclusions (56-60 ppm) 326
than in the normal-type inclusions (74-131 ppm) (Fig. 4 and Supplementary Table 1). 327
The average F/Nd ratio for the melt inclusion suite is 21.33.4 (1σ, standard deviation), 328
and this is similar to the average F/Nd ratio of ~21 suggested for global oceanic lavas 329
(Workman et al., 2006). 330
3.3.5. Sulfur 331
Previous work showed that S concentrations in OJP pillow glasses are in the 332
range of 692 to 1156 ppm (Roberge et al., 2004). Roberge et al. (2004) observed that 333
ratios of S to other incompatible elements (S/K and S/Ti) slightly decrease with 334
decreased MgO. The concentrations of S in the OJP inclusions range from 327 to 948 335
ppm, and show a clear, positive relationship with MgO (Fig. 4). We note that sulfides 336
have not been observed in the OJP inclusions. 337
338
4. Discussion
OJP lavas are noted for their trace element and isotopic homogeneity. Excluding 340
the small volume Singgalo melts, which are slightly enriched geochemically (relative to 341
the Kroenke and Kwaimbaita-type lavas) and thought to comprise a late-stage of 342
volcanism on the plateau (Tejada et al., 2004; Fitton and Godard, 2004), the bulk of the 343
accessible plateau is composed of Kroenke-type and Kwaimbaita-type lavas that have 344
indistinguishable Sr-Nd-Pb-Hf isotopic compositions and relatively flat primitive mantle 345
normalized REE patterns (Mahoney, 1987; Mahoney and Spencer, 1991; Mahoney et al., 346
1993; Tejada et al., 1996, 2002, 2004, 2013; Neal, 1997; White et al., 2004; Shafer et al., 347
2004). These melts are thought to be the result of 20-30% melting of a homogeneous 348
mantle source that is less depleted than the depleted MORB mantle (Mahoney et al., 349
1993; Neal et al., 1997; Tejada et al., 2002, 2004, 2013; Fitton and Godard, 2004; 350
Herzberg, 2004). There has never been a report of lavas from the OJP with strongly 351
depleted light REE signatures. Thus, the discovery of the UDM inclusions hosted in a 352
Kroenke-type OJP lava are all the more perplexing, and demonstrate that OJP magma 353
compositions are more diverse than previously thought. 354
Based on the whole rock geochemical analyses of basalts, it has been known for 355
decades that the mantle sources of hotspots and flood basalts host geochemically-356
depleted components (e.g., Zindler and Hart, 1986; Gee et al., 1998; Chauvel and 357
Hemond, 2000; Kerr et al., 1995; Fitton et al., 1997; Salters et al., 2011; Shorttle et al., 358
2013). For example, the presence of a depleted component distinct from the normal 359
MORB source has been identified in Hawaii (Frey et al., 2005). Similarly, the presence of 360
a depleted component in the Iceland plume that is distinct from the upper mantle source 361
of normal MORB was advanced by Thirlwall (1995) and Kerr et al. (1995) on the basis 362
of Pb isotopes, by Fitton et al. (1997, 2003) using Nb-Zr-Y systematics, and by Kempton 363
et al. (2000) and Fitton et al. (2003) using evidence from 143Nd/144Nd and 176Hf/177Hf. In 364
fact, basalts erupted at most major hotspots exhibit evidence for sampling a mantle source 365
that is geochemically depleted (Hart et al., 1992), and basalts erupted at LIPs globally 366
exhibit evidence for sampling a geochemically depleted mantle (Zindler and Hart, 1986; 367
Jackson and Carlson, 2011). 368
While geochemically-depleted lavas are not unusual at hotspot and flood basalt 369
localities in the world‘s ocean basins, UDM inclusions are unusual in that they exhibit 370
greater degrees of incompatible trace element depletion than the whole rock from which 371
they were separated. UDM melt inclusions have been reported in magmatic suites at 372
ocean island hotspots (e.g., Sobolev et al., 2000; Koleszar et al., 2009; Gurenko and 373
Chaussidon, 1995; Slater et al., 2001), mid-ocean ridge localities (e.g., Laubier et al., 374
2012; Sobolev et al., 2011; Sobolev and Shimizu, 1993; Danyushevsky et al., 2003; 375
Kamenetsky et al., 1998) and komatiites (Shimizu et al., 2009; Kamenetsky et al., 2010). 376
With the exception of Iceland, the UDM inclusions from the OJP represent, to our 377
knowledge, the first report of UDM inclusions at a LIP locality. Like the OJP melt 378
inclusions here, Fig. 3 shows that Icelandic melt inclusions reveal a range of melt 379
inclusion compositions that exhibit highly depleted trace element compositions. Indeed, 380
the Icelandic melt inclusions trend to much more geochemically-depleted (La/Sm)N 381
values (~0.05) than identified in OJP inclusions (~0.18). Curiously, the Icelandic lavas 382
also host melt inclusions with compositions that are have significantly more enriched 383
(La/Sm)N values (~6.5) than the OJP (~1.18) inclusions. Similarly, the Icelandic 384
inclusions sample more extreme plagioclase signatures (i.e., higher Sr/Sr*) than 385
identified in the OJP inclusions. While we do not have an explanation for the greater 386
degree of geochemical variability observed in the Icelandic melt inclusions, we do note 387
that, compared to the number of melt inclusions analyzed from the OJP, many more 388
Iceland melt inclusions have been analyzed, from a larger suite of lavas. It is possible that 389
the relatively small number of OJP melt inclusions may not have captured the full range 390
of melt inclusion compositions present OJP lavas. 391
The origin of the incompatible element depletion observed in UDM inclusions in 392
oceanic lavas globally is not well understood, but has been the subject of some 393
discussion. Below, we discuss the origin of the UDM inclusions from OJP in the context 394
of existing models for UDM formation. We argue that a distinct, depleted component 395
inherent to the OJP mantle plume generated melts that were trapped as UDM inclusions. 396
397
4.1. Origin of the depleted OJP mantle component sampled by UDM inclusions. 398
399
4.1.1. UDM inclusions generation by repeated melt extraction from the same portion of 400
upwelling mantle? 401
Following melt extraction and depletion of the OJP mantle source, subsequent 402
melts extracted from the same portion of (now highly depleted) mantle would be depleted 403
in incompatible elements (e.g., Sobolev and Shimizu, 1993; Thirwall et al., 2004), and we 404
examine whether this might explain the origin of the UDM inclusions at the OJP. 405
Sobolev and Shimizu (1993) showed that such a mechanism might explain the origin of 406
olivine-hosted UDM inclusions discovered in a MORB lava. They argued that the UDM 407
inclusion represented the last fraction of melt produced by the upwelling mantle column 408
beneath the ridge, and the same portion of the melting column had experienced 409
continuous melt extraction, from greater depths beneath the ridge, to shallower depths 410
where UDM is generated. As a result of melting a mantle source that has already 411
experienced melt extraction and incompatible element depletion, the melt (i.e., the UDM) 412
is depleted in incompatible elements. Sobolev and Shimizu (1993) suggested that MORB 413
lavas are composed of mixtures of polybaric melts with different trace element 414
characteristics, including inclusions with UDM characteristics. The UDM inclusions are 415
generally mixed into bulk MORB magmas and their unique, incompatible element 416
depleted signatures are lost during melt aggregation and homogenization with more 417
geochemically-enriched melts. However, sometimes UDMs are trapped in growing 418
olivines before melt homogenization, thereby preserving depleted instantaneous melts 419
that are products of the final stages of polybaric melting of a highly depleted source. 420
One possible explanation for the formation of OJP UDM inclusions is that they 421
were produced by a mechanism similar to that proposed by Sobolev and Shimizu (1993), 422
whereby the UDM inclusions were formed by the final (shallower) stages of melting of a 423
homogeneous upwelling OJP plume source that had become depleted in highly 424
incompatible elements during earlier (deeper) stages of melting. In such a model, 425
instantaneous melts of the final stages of melting would have been trapped in growing 426
olivines in magma conduits beneath the OJP before mixing with earlier, deeper melts. 427
The lower abundance of UDM inclusions (only just over one-third of the OJP inclusions 428
are UDM inclusions; Supplementary Table 1) might be explained by such a model, as the 429
mantle source of the OJP would be expected to be more refractory during the final stages 430
of polybaric melting, thereby producing a lower proportion of depleted melts compared 431
to the less depleted melts extracted at greater depth. However, one potential problem with 432
this model is that it does not explain why the OJP inclusions tend to cluster in two 433
relatively separate groups: In trace element space (Fig. 3, panels A through D), the two 434
inclusion types—normal-type and UDM inclusions—populate two relatively distinct 435
groups, with perhaps one inclusion plotting between the two groups. However, if UDMs 436
sample instantaneous polybaric melts from a homogenous upwelling OJP mantle plume, 437
a continuous spectrum of melt inclusion compositions ranging from normal-type 438
inclusions to UDM inclusions might be expected as the plume undergoes progressive 439
depletion during upwelling. This is not observed. 440
441
4.1.2 A melt model to generated normal type inclusions at the OJP. 442
Before modeling the source of the UDM inclusions, it is first important to 443
constrain the genesis of normal-type inclusions. Such a melt model can be used to place 444
broad constraints on whether a single OJP mantle source can generate melts like the 445
normal-type inclusions and, following depletion by melt extraction, generate melts 446
similar to the UDM inclusions. The relatively flat REE patterns of the Kwaimbaita and 447
Kroenke-type lavas, combined with the observation that the 143Nd/144Nd, 87Sr/86Sr and 448
176
Hf/177Hf isotopic composition of the mantle source for these lavas is less depleted than 449
the source for MORB, suggest that the trace element source of OJP Kroenke-type lavas is 450
also less depleted than the MORB source (Tejada et al., 2004; Fitton et al., 2004). 451
Jackson et al. (2010) and Jackson and Carlson (2011) argued that the mantle sources of 452
many LIPs globally, including the Kroenke lavas from the OJP, are sourced by an early-453
formed, depleted reservoir (EDR) generated by global differentiation event of the silicate 454
Earth (Boyet and Carlson, 2005) 455
Adopting the model of Jackson and Carlson (2011), which argues that OJP lavas 456
are melts of the EDR, we employ an aggregated near-fractional melt model of an EDR 457
mantle source to match the trace element composition of Kroenke-type OJP lavas. We 458
employ the alphaMELTS software (Smith and Asimow, 2005) and adopt a mantle source 459
major element composition from Sun and McDonough (1989) and the EDR mantle 460
source from Jackson and Jellinek (2013). The default trace element routine of 461
alphaMELTS was used to calculate trace element fractionation, in which mineral-melt 462
partition coefficients for clinopyroxene, garnet, and feldspar vary as a function of 463
pressure, temperature and composition (Wood and Blundy, 1997; van Westrenen et al, 464
1999; Blundy and Wood 1994), while mineral-melt partition coefficients for spinel and 465
orthopyroxene are constant values compiled by MacKenzie and O'Nions (1991; 1995). 466
The melting calculation starts at 1600°C and 40 kilobars and proceeds until the degree of 467
melting reaches 25-30%. The trace element composition of Kroenke-type lavas (and 468
therefore, the normal-type inclusions, which have trace element patterns that are similar 469
to Kroenke-type lavas) are best matched when the degree of melting of the EDR mantle 470
is 25-30% (see Fig. 5 for melt model details). This degree of melting is in agreement with 471
previous suggestions that Kwaimbaita and Kroenke-type OJP lavas are the result of 20-472
30% melting (Mahoney et al., 1993; Neal et al., 1997; Tejada et al., 2002, 2004, 2013; 473
Fitton and Godard, 2004; Herzberg, 2004); for comparative purposes, the EDR mantle 474
source used here (0.65 ppm Nb and 7.7 ppm Zr; Jackson and Jellinek, 2013) is similar to 475
a previously suggested source for Kroenke-type OJP lavas (~0.6 ppm Nb and 9.5 ppm Zr; 476
Fitton and Goddard, 2004). Notably, the EDR mantle source that generates the Kroenke-477
type lavas and normal-type inclusions has concentrations of the most incompatible 478
elements (e.g., La) that are similar to or slightly higher than the UDM inclusions (Fig. 2), 479
and therefore cannot source the UDM inclusions. The UDM inclusions require a more 480
incompatible element depleted mantle source. 481
482
4.1.3. A distinct mantle source for the UDM melt inclusions? 483
While melting the EDR mantle source does a reasonable job of generating the 484
trace element patterns observed in the Kroenke-type lavas and the normal-type 485
inclusions, a key trace element signature of the UDM inclusions suggests that they 486
require a distinct mantle source unrelated to the EDR source: Unlike the normal-type OJP 487
inclusions, which are thought to represent entrapped portions of Kroenke-type lavas, the 488
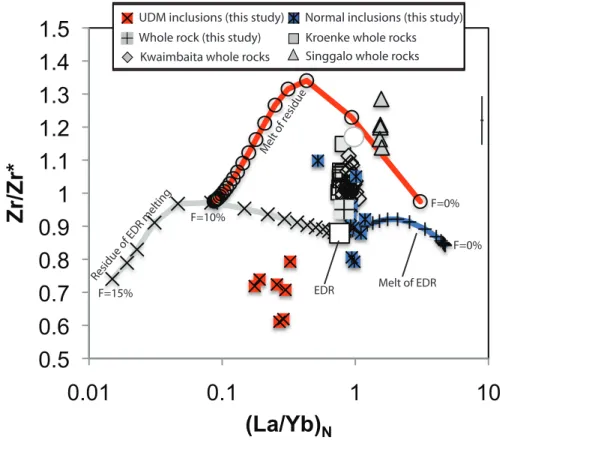
UDM inclusions from the OJP have Zr/Zr* (where Zr/Zr* = ZrN/(SmN*NdN)0.5) values 489
that are generally displaced to lower values than found in the normal-type OJP inclusions 490
(Fig. 6). The low Zr/Zr* in the UDM inclusions is difficult to generate from the same 491
mantle source that produces the normal-type inclusions, which have generally higher 492
Zr/Zr*. 493
While low Zr/Zr* values in UDM inclusions from other hotspot and mid-ocean 494
ridge localities have been attributed to a gabbro signature (e.g., Sobolev et al., 2000; Saal 495
et al., 2007; Danyushevsky et al., 2003), the low Zr/Zr* values in the OJP UDM 496
inclusions cannot be the result of interaction with gabbro: there is no relationship 497
between Zr/Zr* and Sr anomalies (where the latter is an indicator of a gabbro signature). 498
Thus, the lack of any relationship between Sr/Sr* and Zr/Zr* argues against the negative 499
Zr anomalies in the UDM inclusions from the OJP resulting from interaction with gabbro 500
melts. The low Zr/Zr* signatures in the OJP UDM inclusions are interpreted to be a 501
primary signature of the melts. 502
We explore whether the lower Zr/Zr* values in OJP UDM inclusions is a 503
geochemical signature can be generated by melting a mantle source residue left over 504
following melt extraction of Kroenke-type lavas (and normal-type inclusions) from the 505
EDR mantle. Fig. 6 shows the same aggregated fractional melt model of the EDR source 506
that was explored in Fig. 5, and shows that the (La/Yb)N and Zr/Zr* compositions of the 507
normal-type inclusions and Kroenke-type basalts are best matched with 25-30% 508
aggregated fractional melting of the EDR source (blue line in Fig. 6), which is consistent 509
with the melt model result shown in Fig. 5. Melts of the EDR source do not generate the 510
low Zr/Zr* values observed in the UDM inclusions. However, the composition of the 511
mantle residue (grey line in Fig. 6) following melt extraction from the EDR source has 512
diminished (La/Yb)N, which is a feature observed in UDM inclusions. Unfortunately, 513
Zr/Zr* in the melt model does not match the UDM inclusions: melts extracted from this 514
depleted residue have higher Zr/Zr* than the residue (red line in Fig. 6), while the UDM 515
inclusions have lower Zr/Zr* values than the residue. To demonstrate this effect, we 516
employ the alphaMELTS software using similar assumptions employed above. However, 517
instead of extracting melt from the EDR source, melt is re-extracted from the depleted 518
residue following 10% fractional melting of the EDR source (red line in Fig. 6), and the 519
melt re-extraction starts at 29 kilobars and 1555°C and proceeds to lower pressures and 520
temperatures. The melts have the low (La/Yb)N values observed in the UDM inclusions, 521
but the Zr/Zr* of the model melts are higher than the UDM inclusions (Fig. 6). In 522
general, a family of melt models show that re-melting the depleted mantle source left 523
over after melt extraction during construction of the OJP does not generate the 524
combination of low Zr/Zr* and low (La/Yb)N values observed in the UDM inclusions. 525
Multiple melt extraction events from the same portion of upwelling mantle may 526
successfully explain the generation of an ultra-depleted source that gave rise to the UDM 527
inclusion identified in a mid-ocean ridge basalt (Sobolev and Shimizu, 1993). However, 528
given the generally lower Zr/Zr* observed in the UDMs compared to normal-type 529
inclusions and Kroenke-type basalts, the UDMs from OJP are not explained as melts 530
extracted from the EDR or melt sextracted from the depleted mantle residue left over 531
following extraction of Kroenke-type melts (and the associated normal-type inclusions). 532
Instead, the UDM melts must have been extracted from a mantle source that is unrelated 533
to (and has lower Zr/Zr* and La/Yb than) the mantle source of the Kroenke-type lavas 534
and normal-type inclusions. Without isotopic information on the UDM inclusions, we 535
cannot speculate on the timing of the melt extraction event that generated the depleted 536
mantle source of the UDMs. However, based on the arguments above, this depletion 537
event is unlikely to have occurred during melt extraction to form the lavas that constitute 538
the OJP. 539
540
4.1.4. Distinct mantle sources for UDM and normal-type melt inclusions 541
Instead of representing melts of a single plume source that has undergone 542
progressive depletion by polybaric melt extraction during plume upwelling, the two 543
groups of melt inclusions may represent melts of two distinct mantle sources within the 544
upwelling plume. Recent work on mantle xenoliths from the island of Malaita has 545
identified several lithologies—depleted harzburgites, fertile lherzolites and pyroxenites— 546
that were suggested to have sourced OJP melts at 120 Ma (Ishikawa et al., 2007, 2011). 547
Ishikawa et al. (2011) argued that the lithological diversity of Malaita xenoliths indicate 548
that the mantle upwelling beneath the OJP was heterogeneous. Ishikawa et al. (2011) 549
suggest that the homogeneity in OJP lavas could result from mixing and homogenization 550
of melts from these diverse lithologies. If their hypothesis is correct, and the OJP magmas 551
sampled a heterogeneous mantle that is represented by the diverse xenoliths from 552
Malaita, then the UDM inclusions may offer a first glimpse at some of the heterogeneity 553
that exists in primary melts prior to melt aggregation. In this model, the UDM inclusions 554
represent melts of a more depleted portion of a geochemically-heterogeneous OJP mantle 555
source than the normal-type inclusions. A model in which there are two distinct mantle 556
sources for the inclusions—normal-type and UDM—might explain why the melt 557
inclusions tend to form two rather distinct groups in Figs 3 and 6. 558
Isotopic measurements of the OJP melt inclusions could constrain whether UDM 559
inclusions are melts of a mantle source formed by the final stages of polybaric melting of 560
a homogeneous OJP plume, or melts of a more depleted portion of a heterogeneous OJP 561
plume. If UDM inclusions were formed by the final stages of melting of a homogeneous 562
upwelling OJP plume source that had already been depleted in highly incompatible 563
elements during the early stages of melting (Sobolev and Shimizu, 1993), the isotopic 564
composition of the UDM would be expected to be similar to the normal-type inclusions. 565
However, if the UDM inclusions are melts of a more depleted portion of a geochemically 566
heterogeneous OJP mantle source, then the two inclusion groups would be expected to 567
have distinct isotopic compositions. Unfortunately, the OJP inclusions in this study were 568
too small to permit a systematic isotopic study (e.g., Pb-isotopic analysis by ion probe; 569
Saal et al., 1998; Cabral et al., 2014). 570
571
4.2. Incompatible trace element depletion in UDMs is the result from assimilation of 572
plagioclase-rich (gabbroic) assemblages or altered oceanic crust? 573
Significant discussion surrounds the origin of the gabbro signature that is apparent 574
in a subset of melt inclusions isolated from MORB and hotspot lavas. Sobolev et al. 575
(2000) argued that the gabbro signature in rare Hawaiian inclusions results from melting 576
recycled gabbro incorporated into the Hawaiian mantle. However, Danyushevsky et al., 577
(2003) argued that UDM inclusions at some localities may result from assimilation of 578
plagioclase-rich assemblages, including gabbros, during melt ascent. While we cannot 579
distinguish between these two models for the origin of the gabbro signature in the OJP 580
melt inclusions, we argue that the mechanism responsible for generating the gabbro 581
signature did not generate the UDM signatures. 582
Gabbro cumulate xenoliths have been found at the OJP (Kinman and Neal, 2006), 583
and gabbro cumulates are predicted to lie in the deep portions of the OJP (Neal et al., 584
1997). However, trace element evidence suggests that interaction of OJP melts with 585
gabbros did not generate the UDMs. Only one UDM inclusion from the OJP has a large 586
positive Sr anomaly, which suggests interaction with a plagioclase-assemblage, but the 587
other UDM inclusions do not exhibit clear Sr anomalies within measurement error (Fig. 588
3). This observation indicates that the processes associated with the generation of the 589
positive Sr anomaly (for example, gabbro assimilation in the Danyushevsky et al. [2003] 590
model) are decoupled from the process that generates the incompatible element depletion 591
noted in the UDM inclusions from the OJP. Danyushevsky et al. (2003) noted that, while 592
some UDM inclusions at other localities might result from plagioclase-bearing gabbro 593
assimilation, not all UDMs acquire their incompatible trace element depleted signature in 594
this way. For example, they indicated that the lack of a positive Sr anomaly in the UDM 595
measured by Sobolev and Shimizu (1993) argued against the UDM signature originating 596
by gabbro assimilation. Laubier et al. (2012) made a similar argument for a suite of 597
MORB melt inclusions, and argued that, while assimilation can generate positive Sr 598
anomalies, it is unlikely to generate the incompatible trace element depletion observed in 599
the same melt inclusions. 600
Similarly, Cl/K exhibits no relationship with indicators of incompatible element 601
depletion (e.g., La/Yb) (Fig. 4). If elevated Cl/K ratios indicate interaction with 602
hydrothermally-altered oceanic crust, then the lack of relationship between Cl/K and 603
La/Yb argues against shallow-level assimilation of lithospheric material as the 604
mechanism responsible for the trace element patterns in the UDM inclusions. 605
606
4.3. Interpreting the water abundances in OJP inclusions 607
The H2O contents of the OJP inclusions are not correlated with any incompatible 608
element ratios or concentrations. The H2O concentrations of the UDM and normal-type 609
inclusions fall in a fairly narrow range (Fig. 4) that is similar to that measured in OJP 610
glasses (Roberge et al., 2004), while the Ce concentrations in the UDM inclusions are 611
lower than the normal type inclusions. This leads to large variations in H2O/Ce. The best 612
explanation for these observations relates to the high diffusivity of H2O in olivine. 613
Diffusion of H2O (but not Ce) from the host liquid through the host olivine and into H2O-614
poor UDM inclusions may elevate the H2O/Ce ratio of the inclusion (Kolezar et al., 2009; 615
Gaetani et al., 2012). If so, the inclusions may have started out with similar H2O/Ce ratios 616
when they were trapped, but addition of H2O via diffusion into the olivine raised their 617
H2O/Ce ratios. If the host olivines experienced relatively long residence times in large 618
magma chambers, it would have been difficult for inclusions to avoid such diffusive 619
equilibration. 620
The high Cl/K ratios provide evidence for extensive assimilation of 621
hydrothermally altered material in much of the OJP inclusion suite, consistent with 622
previous suggestions of widespread assimilation in the OJP (Neal and Davidson, 1989; 623
Michael, 1999; Roberge, 2004; Kinman and Neal, 2006); both UDM and normal-type 624
inclusions have elevated Cl/K, indicating that assimilation occurred in both suites prior to 625
melt aggregation (Fig. 4). Assimilation of altered, and therefore hydrous, crust can 626
increase the H2O abundances of affected melts (e.g., Kent et al., 1999a, 1999b). 627
Therefore, we do not argue that the H2O abundances and the elevated H2O/Ce ratios in 628
the OJP melt inclusions reflect mantle source ratios, a conclusion made in Roberge et 629
al.‘s (2004) study of OJP pillow glasses. However, while the Cl/K is high in the OJP 630
inclusion suite, there is not a clear correlation between Cl/K and H2O/Ce. Thus, it is 631
difficult to argue for assimilation as the sole cause for the elevated H2O/Ce in the 632
inclusions. Therefore, we argue that diffusive incorporation of H2O may operate alone or 633
in tandem with assimilation to increase the H2O/Ce of the OJP inclusions, and that the 634
H2O abundances in the inclusions do not reflect primary magmatic concentrations. 635
636
4.4. A widespread, but diluted depleted component in OJP lavas: evidence from UDM 637
inclusions 638
An important question is whether melts like those sampled in UDM inclusions are 639
relatively common in the OJP but were simply mixed together with Kroenke-type melts 640
and became obscured by magma mixing and dilution. The trace element patterns of the 641
least altered Kroenke-type lavas are generally smooth (Figs. 1, 2 and 3). However, the 642
extremely limited variability may permit a small proportion of melts like the UDM 643
inclusions to comprise (i.e., be ―hidden‖ within) the bulk whole rock chemistry of 644
Kroenke-type basalts without causing their trace element patterns to deviate outside the 645
range of measured (La/Yb)N ratios in whole rock basalts. If so, then mixing and 646
homogenization in magma chambers could have mixed the depleted component 647
thoroughly into the bulk lava such that the depleted component is only visible in the 648
UDM inclusions that were trapped before complete magma mixing. A mixture of 649
approximately 7% of a UDM melt component (using the average of the UDM inclusions) 650
and 93% of an average Kroenke-type melt component generates a primitive mantle 651
normalized trace element pattern that is similar to the pattern of the most depleted 652
Kroenke-type lava. This suggests that a small quantity of UDM melts may be ―hidden‖ in 653
the average bulk rock Kroenke-type lavas without forcing the trace element variability to 654
depart from levels observed in whole rock Kroenke lavas. 655
The crustal portion of the OJP is estimated to be 30 km thick (Miura et al., 2004; 656
Richardson et al., 2000), but only 3.5 km of the plateau‘s stratigraphy is exposed in the 657
Solomon islands and has been sampled (e.g., Petterson et al., 1997), while even less has 658
been sampled by drilling. With nearly 90% of the stratigraphy of the OJP left unsampled, 659
the possibility exists that melts like the UDM inclusions comprise a larger fraction than 660
7% of the bulk rock in samples from deeper in the plateau. However, only the upper 661
stratrigraphy of the OJP has been characterized. The bulk of the plateau is still beyond the 662
reach of direct sampling efforts, and the Kroenke lava type (which we find to host UDM 663
inclusions) was only recently discovered (Tejada and Mahoney, 2004; Fitton and Godard, 664
2004) as a result of a major ocean drilling effort. The deeper portions of the OJP have 665
been suggested to be heterogeneous (Kerr and Mahoney, 2007; Kerr, 2014). If the UDM 666
component reflects a more refractory mantle source (suggested by its trace element 667
depletion), and if the earlier stages of OJP volcanism sampled a hotter portion of the 668
upwelling plume, then earlier stages of volcanism at the OJP might sample this 669
component in purer form. We suggest that, if sampled in purer form in as-yet-670
undiscovered OJP bulk lavas, this lava type be called Mahoney-type, to complement the 671
Kroenke, Kwaimbaita and Singgalo-type lavas already discovered in the OJP. 672
673
5. Conclusions
We conducted the first geochemical study of melt inclusions from the OJP. All of 675
the olivine-hosted melt inclusions were isolated from a single hand sample from ODP 676
Site 1187. Measurements of major, trace, and volatile elements on the inclusions reveal 677
that over one third of the inclusions are highly depleted in incompatible elements (with 678
low (La/Yb)N ratios, referred to as UDM inclusions), while the remaining inclusions have 679
primitive mantle normalized trace element patterns that are similar to whole rock 680
Kroenke-type lavas from the OJP. The inclusions all have elevated Cl/K (indicative of 681
assimilation of altered oceanic crust or brines), and many of the inclusions have elevated 682
Sr/Sr* (indicative of a gabbro component), but neither Cl/K nor Sr/Sr* correlates with 683
indicators of incompatible element depletion, like (La/Yb)N. Thus, we argue that the 684
geochemically depleted signatures of the UDM inclusions are not the result of 685
assimilation. 686
The trace element characteristics of the UDM inclusions suggest that their mantle 687
source is not related to the mantle source of the normal-type inclusions or Kroenke-type 688
lavas. First, the UDM inclusions have unique trace element signatures (e.g., low Zr/Zr* 689
values) that preclude an origin by re-melting the depleted mantle source left over after 690
melt extraction during construction of the OJP. Second, sampling of melts from a 691
progressively depleted OJP mantle component during upwelling and polybaric melt 692
extraction from a mantle plume might be expected to produce a continuous spectrum of 693
inclusion compositions between normal-type and UDM inclusions. However, there is a 694
distinct lack of inclusions that have compositions intermediate between the UDM and 695
normal-type inclusions, which suggests the presence of two distinct mantle sources that 696
give rise to the two groups of melt inclusions observed in this study. We argue that the 697
UDM inclusions are melts of a previously unrecognized depleted component in the OJP 698
mantle source. 699
We argue that the two distinct groups of OJP inclusions sample two (perhaps 700
lithologically) distinct mantle sources in the OJP plume. If the lithologically 701
heterogeneous xenoliths previously reported from the Island of Malaita represent 702
geochemical diversity in the OJP mantle source, the heterogeneous trace element 703
compositions in the OJP inclusions represent the first hints of heterogeneity that exists in 704
primary Kroenke and Kwaimbaita-type melts prior to melt aggregation. 705
706
Acknowledgements
707
MGJ acknowledges invaluable ion probe support from Rick Hervig at Arizona 708
State University, and NSF EAR-0948878 that supports the ion probe facility. MGJ also 709
thanks the staff at the IODP Gulf Coast Repository for assistance during a two-day stay at 710
the facility. John Maclennan provided important insights and access to a wealth of 711
Icelandic melt inclusion data. We acknowledge editorial handing efforts of Catherine 712
Chauvel and reviews from Godfrey Fitton, Andrew Kerr, Allison Gale, Tim Elliott, 713
Matthew Thirwall, Clive Neal and an anonymous reviewer. MGJ acknowledges support 714
from NSF proposals EAR-1145202, EAR-1348082, OCE-1153894, and EAR-1347377. 715
PJM acknowledges support from NSF grant OCE-1132038. EFR-K and KTK 716
acknowledge French ANR grant no. 2011 Blanc SIMI 5-6 003 (project DEGAZMAG) 717
that partly supported this work. This is Laboratory of Excellence ClerVolc contribution 718
number ______. 719
720
Figure captions:
721
Fig. 1. Major and trace element compositions of the OJP melt inclusions compared
722
to representative whole rock basaltic compositions (Fitton and Godard, 2004) and
723
pillow glass compositions from OJP drill sites (Michael, 1999; Roberge et al., 2004).
724
In order to avoid the effects of alteration, we follow the alteration filter of Fitton and 725
Godard (2004) and have excluded whole rock basalts with LOI > 0.5 wt.% and K2O/P2O5 726
> 2. The composition of the Kroenke-type lava hosting the melt inclusions (192-1187A-727
006R-06W [110-129 cm]) is also shown. The major and trace element concentrations in 728
the melt inclusions have been corrected for olivine fractionation to be in equilibrium with 729
the host olivine. Whole rock and melt inclusion major element data are normalized to 100 730
wt.% on a volatile-free basis. 731
732
Fig. 2. Primitive mantle (McDonough and Sun, 1995) normalized trace element
733
patterns for ultra-depleted and normal-type OJP melt inclusions. UDM inclusions
734
are shown as red lines and normal-type inclusions are shown as blue lines. The two 735
inclusions with the largest Sr/Sr* values, one UDM inclusion (#25) and one normal-type 736
inclusion (#23), are highlighted with diamond symbols. The melt inclusions are 737
compared to whole rock trace element patterns measured on Kroenke-type lavas (top 738
panel, solid grey lines), and Kawaimbaita-type (bottom panel, grey large-dashed lines) 739
and Singgalo-type (bottom panel, solid black lines) lavas. The whole rock analysis for 740
this lava from which inclusions were extracted is shown (top panel, bold black large-741
dashed line). In the bottom panel, several reference compositions are shown: MORB 742
(light grey thick solid line; Gale et al., 2013), depleted MORB mantle (DMM, dark bold 743
grey large-dashed line; Workman and Hart, 2005), average Gabal Gerf gabbro 744
composition (Zimmer et al., 1995; small-dashed black line). The EDR composition used 745
in the melt model is shown (grey small-dashed lines). Whole rock lava data come from 746
Fitton and Godard (2004), and we plot only the freshest lavas following the filter outlined 747
in the caption of Fig. 1. The trace element concentrations of the inclusions have been 748
adjusted to reflect major element correction for olivine fractionation/addition to be in 749
equilibrium with the host olivine (see Fig. 1 caption). 750
751
Fig. 3. Major and trace element ratios are used to distinguish the UDM inclusions
752
and the normal-type inclusions from the OJP and to evaluate interaction with
753
plagioclase-rich (i.e., plagioclase-rich gabbro) lithologies. The expanded views show
754
olivine-hosted melt inclusions from Iceland, for comparison. Panels A through D use 755
incompatible trace element ratios to show that the UDM and normal-type inclusions form 756
separate groups. In panels E and F, the Gabal Gerf plagioclase composition from Sobolev 757
et al. (2000) plots off the figure, and has low CaO/Al2O3 (0.40) and high Sr/Sr* (3.3). 758
Panels G and H show that there is no relationship between a plagioclase-rich gabbro 759
signature (where high values of Sr/Sr* suggest the strongest gabbro signature) and 760
(La/Yb)N signatures of the OJP inclusions. All whole rock data are from Fitton and 761
Godard (2004). The whole-rock data (Kroenke, Kwaimbaita and Singgalo-type lavas) are 762
filtered for alteration as discussed in the caption of Fig. 1. MORB is from Gale et al. 763
(2013). The whole rock composition of the Kroenke-type lava hosting the melt inclusions 764
is also shown. Error bars are 1σ, standard deviation. Symbols are the same as in previous 765
figures except for the addition of the Iceland melt inclusions (grey circles); Iceland data 766
are from Gurenko and Chaussidon (1995, 1997), Slater et al. (2001) and Maclennan et al. 767
(2003a, 2003b, 2008a, 2008b), Moune et al. (2012), Hartley et al. (2013, 2014) and 768
Neave et al. (2014). 769
Fig. 4. Plots showing the behavior of CO2, H2O, Cl, F and S in OJP melt inclusions. 770
Symbols as in previous figures. OJP pillow glass compositions are from Michael (1999) 771
and Roberge et al. (2004). For all melt inclusion data, the trace element data are corrected 772
for olivine fractionation/addition so that the major elements are in equilibrium with the 773
host olivine (see Fig. 1 caption); thus, two samples without major element data (2B and 774
9C) are excluded from the three panels where elemental concentrations are plotted. Error 775
bars are 1σ, standard deviation. 776
777
Fig. 5. A melt model showing that the EDR mantle source (solid grey line, no
778
symbols) from Jackson and Jellinek (2013) generates melts similar to the
Kroenke-779
type OJP lavas (black lines) and normal-type inclusions (blue lines). The UDM
780
inclusions are also plotted (red lines). Two melt models are shown (described in Fig. 6 781
and Section 4.1.2 of the text): One represents 25% aggregated fractional melting of the 782
EDR mantle source (grey line with circles), and the other represents 30% aggregated 783
fractional melting of the same source (grey line with triangles). The details of the melt 784
model are provided in the text. Kroenke-type lavas from Fitton and Goddard (2004) and 785
the lava hosting the inclusions in this study are shown (black lines); whole rocks are 786
filtered after Fig. 1, and are olivine fractionation corrected to be in equilibrium with Fo92 787
olivine. Melt inclusions are also corrected for olivine fractionation to be in equilibrium 788
with Fo92 olivine to simulate primary mantle melts. 789
Fig. 6. A melt model shows that the UDM inclusions cannot be extracted from the
790
same mantle source as the normal-type inclusions or from the depleted residual
791
mantle left over following extraction of normal-type melts. The details of the melt
792
model are provided in the text. The melt model mantle source (EDR) is shown. 793
Aggregated near-fractional melt extraction (0.05 to 2% residual porosity in mantle) from 794
this mantle source (blue line with tic marks at 1% aggregated fractional melting intervals, 795
starting at 0% on the far right) best matches the composition of the normal-type 796
inclusions with 25-30% aggregated fractional melting. The composition of the mantle 797
residue following melt extraction is shown as a grey line with tic marks marking 1% 798
fractional melt extraction (with 15% fractional melt extraction on the far left, and 0% 799
fractional melt extraction on the right) from the EDR mantle. Melts extracted from this 800
residue have higher Zr/Zr* than the residue, and therefore have higher Zr/Zr* that the 801
UDM inclusions from the OJP. Following extraction of 10% fractional melt from the 802
EDR to make a depleted residue (grey line, starting at tic labeled F=10%), we extract 803
aggregated fractional melt from this residue (red line with aggregated fractional melting 804
intervals at 1%, starting at 0% on the far right): while the low (La/Yb)N values of the 805
UDM inclusions are matched by melt extraction from a depleted source (red line), the 806
Zr/Zr* of the model melt is too high. Error bar represents 1σ, standard deviation. 807
808 809 810
References Cited
811
Blundy, J., Wood, B., 1994. Prediction of crystal-melt partition-coefficients from elastic-812
moduli. Nature 372, 452-454. 813
814
Boyet, M., Carlson, R.W., 2005. 142Nd evidence for early (>4.53 Ga) global 815
differentiation of the silicate Earth. Science 309, 576–581. 816
817
Cabral, R.A., Jackson, M.G., Koga, K.T., Rose-Koga, E.F., Hauri, E.H., Whitehouse, 818
M.J., Price, A.A., Day, J.M.D., Shimizu, N., Kelley, K.A., 2014. Volatile cycling of H2O, 819
CO2, F, and Cl in the HIMU mantle: A new window provided by melt inclusions from 820
oceanic hotspot lavas at Mangaia, Cook Islands. Geochemistry, Geophysics, Geosystems, 821
DOI: 10.1002/2014GC005473 822
823
Caro, G., Bourdon, B., Halliday, A.N., Quitte, G., 2008. Super-chondritic Sm/Nd ratios in
824
Mars, the Earth andthe Moon. Nature 452, 336-339. doi:10.1038/nature06760.
825 826
Caro, G., Bourdon, B., 2010. Non-chondritic Sm/Nd ratio in the terrestrial planets: 827
consequences for the geochemical evolution of the mantle–crust system. Geochim. 828
Cosmochim. Acta 74, 3333–3349. 829
830
Cartigny, P., Pineau, F., Aubaud, C., Javoy, M., 2008. Towards a consistent mantle 831
carbon flux estimate: Insights from volatile systematics (H2O/Ce, δD, CO2/Nb) in the 832
North Atlantic mantle (14° N and 34° N). Earth Planet. Sci. Lett. 265, 672-685. doi: 833