Publisher’s version / Version de l'éditeur:
Proceedings of Combustion Institute - Canadian Section Spring Technical
Meeting 2009, 2009-05
READ THESE TERMS AND CONDITIONS CAREFULLY BEFORE USING THIS WEBSITE. https://nrc-publications.canada.ca/eng/copyright
Vous avez des questions? Nous pouvons vous aider. Pour communiquer directement avec un auteur, consultez la
première page de la revue dans laquelle son article a été publié afin de trouver ses coordonnées. Si vous n’arrivez pas à les repérer, communiquez avec nous à PublicationsArchive-ArchivesPublications@nrc-cnrc.gc.ca.
Questions? Contact the NRC Publications Archive team at
PublicationsArchive-ArchivesPublications@nrc-cnrc.gc.ca. If you wish to email the authors directly, please see the first page of the publication for their contact information.
NRC Publications Archive
Archives des publications du CNRC
This publication could be one of several versions: author’s original, accepted manuscript or the publisher’s version. / La version de cette publication peut être l’une des suivantes : la version prépublication de l’auteur, la version acceptée du manuscrit ou la version de l’éditeur.
Access and use of this website and the material on it are subject to the Terms and Conditions set forth at
Instantaneous, quasi-two-dimensional measurement of soot volume
fraction in an ethylene diffusion flame via two-colour laser-induced
incandescence
Crosland, Brian M.; Thomson, Kevin A.; Johnson, Matthew R.
https://publications-cnrc.canada.ca/fra/droits
L’accès à ce site Web et l’utilisation de son contenu sont assujettis aux conditions présentées dans le site LISEZ CES CONDITIONS ATTENTIVEMENT AVANT D’UTILISER CE SITE WEB.
NRC Publications Record / Notice d'Archives des publications de CNRC:
https://nrc-publications.canada.ca/eng/view/object/?id=8468c0df-d044-449c-87ba-ad670e205b36 https://publications-cnrc.canada.ca/fra/voir/objet/?id=8468c0df-d044-449c-87ba-ad670e205b36_____________________________________________ Proceedings of Combustion Institute – Canadian Section Spring Technical Meeting Université de Montréal, Québec May 11-13, 2009
Instantaneous, quasi-two-dimensional measurement of soot volume
fraction in an ethylene diffusion flame via two-colour
laser-induced incandescence
Brian M. Crosland
a, Kevin A. Thomson
b, Matthew R. Johnson
aa
Department of Mechanical and Aerospace Engineering, Carleton University, 1125 Colonel By Drive, Ottawa, Ontario K1S 5B6
b
Institute for Chemical Process and Environmental Technology, National Research Council Canada, 1200 Montreal Road, Ottawa, Ontario, K1A 0R6
1. Introduction
Laser-induced incandescence (LII) is a technique for measuring the soot volume fraction (SVF) within a measurement volume. Using a pulsed laser beam it is possible to rapidly heat the soot to near sublimation or sublimation temperature. The soot incandescence emission is proportional to the mass of soot in the measurement volume. In the simplest implementation of LII, the soot is heated to sublimation temperature and a so-called “plateau” regime where the soot temperature and thus the incandescence signal is relatively insensitive to laser fluence [1]. The constancy of the plateau regime is highly dependent on the spatial profile of the laser while also being dependent on the environmental condition of the aerosol. For example it can be challenging to maintain the plateau regime in a highly attenuating medium. The proportionality of the incandescent emission to soot concentration is calibrated by applying the diagnostic to a source of known concentration or using LII in combination with an attenuation type diagnostic. Using two intensity-calibrated detectors filtered at two wavelength bands it is possible to measure soot temperature, primary particle size and concentration in a version of the technique commonly referred to as time-resolved auto-compensating LII (AC-LII). A major advantage of AC-LII is that the technique is self-calibrated once the absolute light intensity response of the detectors have been determined and thus a calibration of the LII signal against a known source or another measurement technique is unnecessary. Since the temperature is determined in real-time, heating the soot to the plateau regime is unnecessary, and thus lower laser fluences are typically used. This eliminates the need for the assumptions made in plateau regime measurements and allows a less perturbing measurement of the soot. As the soot particles cool, their incandescence can also be used to determine the cooling rate. Through modelling of the nano-scale heat and mass transfer, it is possible to measure the active surface area of the soot aggregates which correlates strongly with the size of the primary particles that make up the soot aggregates. For an in-depth description of the fundamentals of laser-induced incandescence, see [1].
Until recently AC-LII has only been employed as a point-measurement technique using a pair of calibrated photomultiplier tubes as detectors. However, some researchers have begun to investigate using intensified charge-coupled device (ICCD) cameras to capture spatially-resolved LII signals [2-4, 6-8]. The majority of these efforts have used plateau regime LII for soot concentration while the soot size cannot be measured since the signal is not resolved in time. Fuentes et al. [2] used a single ICCD, calibrated using light extinction measurements, to quantitatively measure the soot volume fraction in a non-buoyant laminar ethylene diffusion flame. LII calculations were based on an average of 50 instantaneous signal acquisitions to decrease the uncertainty associated with “gravity variations” in the microgravity environment. Pastor et al. [3] used a single ICCD calibrated using light extinction in an ethylene diffusion flame produced with a replica of the “Santoro burner” described in [4]. The main focus of this work was to compare two calibration methods: spatially-resolved light extinction measurements and an iterative self-calibration method [5] where a single light extinction measurement was required for each height above the burner
studied. Pastor et al. [3] concluded that the spatially-resolved light extinction method better accounted for signal-trapping and non-uniformities in the laser sheet. Boiarciuc et al. [6] used a single ICCD in conjunction with a pair of photomultiplier tubes (PMTs), combining spatially-resolved one-colour LII with single-point two-colour time-resolved LII. The PMTs were calibrated using a tungsten strip filament lamp, allowing the ICCD to be calibrated via the PMT soot volume fraction measurement. The average of 64 LII images was used to determine the mean 2D soot distribution, which showed good agreement with a series of point measurements taken at 15 and 20 mm heights above the burner (HAB) using the PMTs. Delhay et al. [7] were only interested in the qualitative nature of backward-scattered LII, and so used only one ICCD without quantitative calibration.
De Iuliis et al. [8] provide the only example to date of two-dimensional, two-colour LII. By using a steady flame they were able to obtain measurements at two different wavelengths with a single detector without the need for a reference flame or extinction measurements. This setup is preferable to that employed by Boiarciuc et al. [6], since the soot temperature (necessary for calculation of soot volume fraction) can be determined for individual measurements throughout the ICCD field of view. Absolute intensity calibration of the ICCDs was still necessary, and this was performed using a tungsten strip filament lamp. The weak signal-to-noise ratio obtained during measurements made it necessary to average multiple images, making measurements of unsteady flames impossible.
The objective of the present work is to advance two-dimensional (time-gated) auto-compensating LII (2D-AC-LII) such that instantaneous (single-shot) measurements are possible. The experimental setup and calibration are detailed below, followed by results obtained by application of the diagnostic to a non-premixed co-annular ethylene air flame. Results are compared with diffuse 2D line-of-sight attenuation (LOSA) measurements.
2. Methodology/Theory
Two challenges associated with the development of 2D-AC-LII are the creation of a homogeneous intensity laser sheet and the design of the detection system. To decouple these problems and focus only on the detection system, a small flame (< 4 mm diameter) was heated in its entirety by a larger (> 6 mm 1/e2 diameter) laser beam. The local LII emission was then determined through deconvolution.
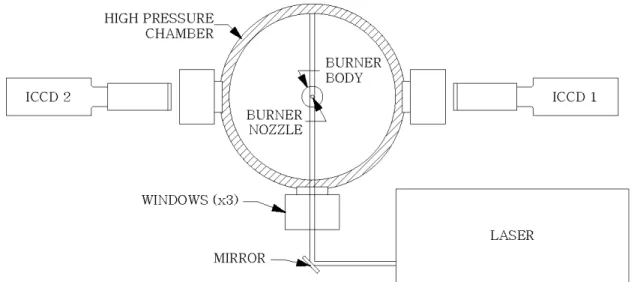
A pair of PIMAX2 ICCD cameras (Princeton Instruments, Trenton, NJ, USA) were placed on opposite sides of a high-pressure chamber containing a burner that produces a steady, laminar, non-premixed ethylene flame. The burner nozzle has an inner diameter of 3.06 mm, which was supplied with 50 SCCM (standard cubic centimetres per minute) of ethylene. The burner body has an inner diameter of 25.4 mm and was supplied with a stabilizing coflow of 10 SLPM (standard litres per minute) of air. A detailed description of the apparatus is provided in [9]. Both of the ICCDs were fitted with 180 mm macro lenses (Sigma Corporation of America, Ronkonkoma, NY) and bandpass filters (Semrock, Rochester, NY). The filters had bandwidths of 46 nm and 24 nm, centred at 442 nm and 688 nm, respectively. Both filters were selected so as to remain within the visible spectrum, for which the camera lenses were designed. The lower bandwidth was also selected to be as wide as possible while avoiding C-2 swan bands at 470 nm. The soot was heated to near sublimation temperatures (~4000 K) using a Surelite-I 10 hz laser producing a beam with a 1/e2 diameter of 6.5 mm at a wavelength of 1064 nm and a fluence of approximately 1 mJ/mm2. A schematic of the basic experimental setup is shown in Figure 1.
The ICCDs were gated on for 20 ns approximately 10 ns after the peak of the laser pulse. The two cameras were synchronized in time by measuring the rapid changes in the soot incandescence signal before, during, and immediately after the laser pulse.
To determine the soot temperature and subsequently the volume fraction of soot present in the measurement volume, it was necessary to calibrate the ICCD signals. The ICCDs were spatially and intensity callbrated in advance of the measurements. The spatial calibration was achieved by placing a transparent sheet of cellulose acetate with a regularly-spaced grid of crosshairs in the image plane. This allowed determination of the length scale of the images and facilitated alignment of the two ICCDs relative to each other. After manually examining the images of the spatial calibration grid and determining the pixel location of the centre of each crosshair, an average of the distance between the four crosshair pairs nearest the measurement area was divided by the known crosshair spacing of 10 mm, yielding a spatial resolution of 33 pixels per mm, or 30 μm per pixel.
A 4” diameter integrating sphere (SphereOptics LLC, Concord, NH, USA) illuminated by a quartz tungsten halogen lamp was used to create a uniform light source necessary for the absolute intensity calibration. An SMS-500 spectrometer (SphereOptics LLC, Concord, NH, USA) was used to measure the spectral radiance of the light emitted by the integrating sphere.
Figure 1 – Schematic of experimental setup
The goal of absolute intensity calibration was to calculate a conversion factor between experimental data (measured in terms of “counts” of intensity registered by the ICCD) and absolute radiance emanating from the volume of space that illuminated a given pixel. This process was complicated by the fact that the integrating sphere signal is constant while the experimental signal is transient (~100 ns). Even while the ICCD intensifier was gated “off,” some small portion of the photons incident on its surface will cause electrons to be emitted, amplified, and measured by the CCD sensor. Because the intensifier was gated “on” for such a short time (20 ns) compared with the CCD readout time (~1.7 s) the signal accumulated while the intensifier is gated “off” was non-negligible. Thus a suitable background image representing this accumulated, non-intensified signal was required. Unfortunately it was impossible to simply “turn off” the intensifier while leaving all other acquisition settings unchanged. Instead, a suitable background image was created using a series of images with different gate widths ranging from 7 to 20 ns. A linear extrapolation was then performed to determine what the signal would be with a gate width of 0 ns. An example of the extrapolation at a single pixel location is shown in Figure 2.
Once the appropriate background image has been subtracted, it is possible to define an absolute intensity calibration matrix, η, for each camera:
( ) ( )
( )
∫
( ) ( )
( )
∫
∞ ∞ ⋅ ⋅ = ⋅ ⋅ − = 0 , , 0 , , , , , , ' λ λ λ τ λ λ λ λ τ λ η d QE R I d QE R I I k k S k j i cal k k S k j i BG k j i cal k j i (1)where λ is the wavelength of light, I’cal and Ical are the calibration images before and after subtraction of the
background image IBG, RS(λ) is the spectral radiance of the integrating sphere as measured using the
spectrometer, τ(λ) is the transmissivity of the filter and lens used and QE(λ) is the quantum efficiency of the CCD sensor. The subscripts i, and j refer to a specific pixel. The subscript k refers to the instrument package under consideration.
The local incandescence signal can then be obtained using an appropriate inversion algorithm. Two algorithms were compared: a three-point Abel inversion [10] was used after first smoothing the data using LOESS, and a Tikhonov-regularized onion peel inversion [11] was used without any previous smoothing.
Adapting the equations from Snelling et al. [12] to include full integration over the filter transmission bandwidth, the soot temperature can be found by solving the following expression:
( )
( )
( )
( )
2 1 0 2 2 1 6 0 1 1 1 6 1 exp ) ( 1 exp ) ( − − ∞ − ∞ − = ⎟⎟ ⎠ ⎞ ⎜⎜ ⎝ ⎛ − ⎟ ⎠ ⎞ ⎜ ⎝ ⎛ ⎟⎟ ⎠ ⎞ ⎜⎜ ⎝ ⎛ − ⎟ ⎠ ⎞ ⎜ ⎝ ⎛∫
∫
INV INV m m S S d QE T k hc E d QE T k hc E λ λ λ τ λ λ λ λ λ λ τ λ λ λ (2)where Em is a refractive index absorption function of soot, h is Planck’s constant, c is the speed of light, k is
Boltzmann’s constant, T is the soot temperature and SINV is the inverted signal obtained via deconvolution
of the calibrated image from ICCD 1 or 2. A constant (wavelength independent) value of 0.4 was used for Em [13].
Similarly, the soot volume fraction is:
( ) ( )
∫
∞ − = 0 1 1 1 ) , (λ τ λ λ λ ϕ T QE d S f P INV V (3)where f is the volume fraction of soot present in the measurement volume and φV P(λ,T) is the theoretical
total radiated power at a given wavelength and temperature per unit volume of soot:
( )
λ λ( )
λ π λ ϕ Em T k hc h c T P 1 6 2 2 1 exp 48 , − ⎥ ⎦ ⎤ ⎢ ⎣ ⎡ − ⎟ ⎠ ⎞ ⎜ ⎝ ⎛ = (4)Results from the 2D-LII measurements are compared to diffuse 2D-LOSA measurements. The theory and general experimental setup for the method are included in [13]. For the present configuration, a DC 50 W halogen bulb illuminating a 4” diameter integrating sphere was used as a light source. The 1” diameter output of the sphere was imaged to the plane of the flame using a pair of lenses (300 mm and 390 mm focal length) each operated at infinite optical conjugate. The flame was imaged onto a PIXIS 1024 Front Lit CCD detector using a Sigma 105 mm focal length macro lens. The signal was filtered across a 25 nm bandwidth centred at 650 nm. An Em value of 0.4 was used in the calculations [13] and the contribution of
light scatter to the extinction measurements was neglected.
3. Results and Discussion
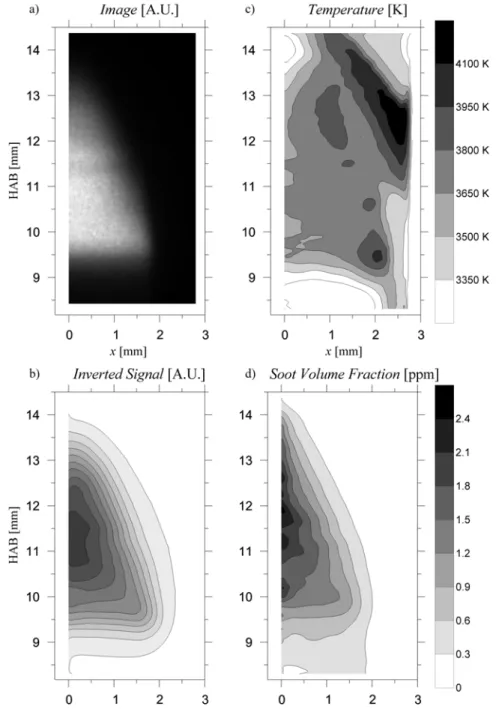
A series of 100 image pairs was acquired and used to calculate the soot volume fraction in a range from 8.5 to 14.5 mm height above the burner (HAB). The ensemble-averaged image of one half of the flame is shown in Figure 3a, along with b) the inverted signal, c) the temperature and d) the soot volume fraction.
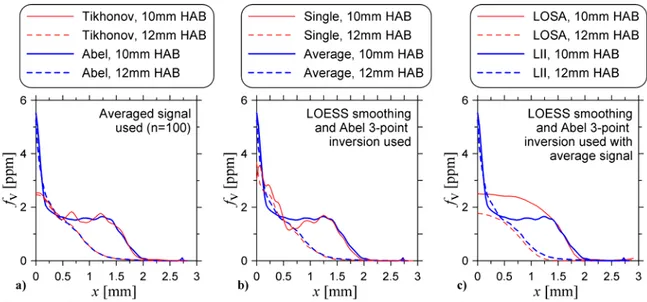
Soot volume fraction profiles from the averaged signal at two heights above the burner are shown in Figure 4a as calculated using the 3-point Abel inversion algorithm and the Tikhonov-regularized inversion algorithm (αP = 10 000). The instantaneous soot volume fraction (calculated from a single
Transmissivity measurements of the flame under similar conditions were used to calculate soot volume fractions via two-dimensional diffuse line-of-sight attenuation [14]. These results are compared with the 2D-LII results in Figure 4c. There is good agreement far from the burner axis, with a greater disparity nearer the burner axis. This is most likely due to increased uncertainty in this area due to the signal inversion process.
Figure 3 - a) The average incandescence signal measured by the ICCD, b) the average incandescence signal after LOESS smoothing and Abel inversion, c) the average temperature profile and d) the average soot
volume fraction.
4. Conclusions
Preliminary results have demonstrated the possibility of instantaneously measuring soot volume fraction in two dimensions using third-generation ICCDs and appropriate filters. The measured 2D-LII data show reasonable agreement with two-dimensional diffuse LOSA measurements, especially far from the flame axis where inversion errors are expected to be less significant. Further characterisation of the method is required to determine optimal experimental parameters and minimize uncertainty.
Figure 4 - The soot volume fraction at 10 mm and 12 mm above the burner a) using the average signal and comparing inversion algorithms, b) comparing a single measurement to an average measurement (n = 100)
and c) comparing 2D-LII results with 2D diffuse LOSA results.
Acknowledgements
The authors would like to acknowledge support of this project from an NRC/Helmholtz collaboration fund and the technical assistance of Mr. Fazil Baksh and Dr. Francesca Migliorini in setting up the burner and taking the diffuse 2D-LOSA measurements.
References
[1] G.J. Smallwood, W.D. Bachalo and S.V. Sankar in: C. Mercer (Ed.), Optical Metrology for Fluids, Combustion, and Solids, Kluwer Academic, Norwell, 2003, pp.221-258.
[2] A. Fuentes, G. Legros, H. El-Rabii, J.P. Vantelon, P. Joulain and J.L. Torero, “Laser-induced incandescence calibration in a three-dimensional laminar diffusion flame”, Exp. Fluids 43(6) (2007) 939-948.
[3] J.V. Pastor, J.M. Garcia, J.M. Pastor, J.E. Buitrago, “Analysis of calibration techniques for laser-induced incandescence measurements in flames”, Meas. Sci. Technol. 17(12) (2006) 3279-3288.
[4] R.J. Santoro, H. G. Semerjian, R.A. Dobbins, “Soot particle measurements in diffusion flames”, Combust. Flame 51(2) (1983) 203-218.
[5] M.Y. Choi, K. A. Jensen, “Calibration and correction of laser-induced incandescence for soot volume fraction measurements”, Combust. Flame 112 (1998) 485-491.
[6] A. Boiarciuc, F. Foucher, C. Mounaïm-Rousselle, “Soot volume fractions and primary particle size estimate by means of the simultaneous two-color-time-resolved and 2D laser-induced incandescence”, Appl. Phys. B, 83(3) (2006) 413-421. [7] J. Delhay, Y. Bouvier, E. Therssen, J.D. Black, P. Desgroux, “2D imaging of laser wing effects and of soot sublimation in laser-induced incandescence measurements”, Appl. Phys. B, 81(2-3) (2005) 181-186.
[8] S. De Iuliis, F. Migliorini, F. Cignoli, G. Zizak, “2D soot volume fraction imaging in an ethylene diffusion flame by two-color laser-induced incandescence (2C-LII) technique and comparison with results from other optical diagnostics”, Proc. Combust. Inst. 31 (2007) 869-876.
[9] K.A. Thomson, “Soot formation in annular non-premixed laminar flames of methane-air at pressures from 0.1 to 4.0 MPa”, PhD. Thesis, University of Waterloo, Canada, 2004.
[10] C.J. Dasch, “One-dimensional tomography: a comparison of Abel, onion-peeling, and filtered backprojection methods”, Appl. Opt., 31(8) (1992) 1146-1152.
[11] K.J. Daun, K.A. Thomson, F. Liu, G.J. Smallwood, “Deconvolution of axisymmetric flame properties using Tikhonov regularization”, Appl. Opt., 45(19) (2006) 4638-4646.
[12] D.R. Snelling, G.J. Smallwood, F. Liu, Ö.L. Gulder, W.D. Bachalo, “A calibration-independent laser-induced incandescence technique for soot measurement by detecting absolute light intensity”, Appl. Opt., 44(31) (2005) 6773-6785. [13] D.R. Snelling, F. Liu, G.J. Smallwood, Ö.L. Gulder, “Determination of the soot absorption function and thermal accomodation coefficient using low-fluence lii in a laminar co-flow diffusion flame”, Combust. Flame 136 (2004) 180–190 [14] K.A. Thomson, M.R. Johnson, D.R. Snelling, G.J. Smallwood, “Diffuse-light two-dimensional line-of-sight attenuation for soot concentration measurements”, Appl. Opt., 47(5), 2008