Publisher’s version / Version de l'éditeur:
ECS Transactions, 19, 17, pp. 17-27, 2009
READ THESE TERMS AND CONDITIONS CAREFULLY BEFORE USING THIS WEBSITE.
https://nrc-publications.canada.ca/eng/copyright
Vous avez des questions? Nous pouvons vous aider. Pour communiquer directement avec un auteur, consultez la première page de la revue dans laquelle son article a été publié afin de trouver ses coordonnées. Si vous n’arrivez pas à les repérer, communiquez avec nous à PublicationsArchive-ArchivesPublications@nrc-cnrc.gc.ca.
Questions? Contact the NRC Publications Archive team at
PublicationsArchive-ArchivesPublications@nrc-cnrc.gc.ca. If you wish to email the authors directly, please see the first page of the publication for their contact information.
Archives des publications du CNRC
This publication could be one of several versions: author’s original, accepted manuscript or the publisher’s version. / La version de cette publication peut être l’une des suivantes : la version prépublication de l’auteur, la version acceptée du manuscrit ou la version de l’éditeur.
For the publisher’s version, please access the DOI link below./ Pour consulter la version de l’éditeur, utilisez le lien DOI ci-dessous.
https://doi.org/10.1149/1.3242365
Access and use of this website and the material on it are subject to the Terms and Conditions set forth at Preparation and characterization of DMFC electrodes and MEAS
Xue, X.; Bock, C.; MacDougall, B.; Kingston, D.
https://publications-cnrc.canada.ca/fra/droits
L’accès à ce site Web et l’utilisation de son contenu sont assujettis aux conditions présentées dans le site LISEZ CES CONDITIONS ATTENTIVEMENT AVANT D’UTILISER CE SITE WEB.
NRC Publications Record / Notice d'Archives des publications de CNRC: https://nrc-publications.canada.ca/eng/view/object/?id=13e72ec4-9997-46ec-ac23-14f768e26c80 https://publications-cnrc.canada.ca/fra/voir/objet/?id=13e72ec4-9997-46ec-ac23-14f768e26c80
PREPARATION AND CHARACTERIZATION OF DMFC ELECTRODES AND MEAS
X. Xue, C. Bock, B. MacDougall and D. Kingston
Institute for Chemical Process and Environmental Technology, National Research Council, Ottawa, Ontario, K1A 0R6, Canada
ABSTRACT
A stencil method, that utilizes a dried powder made of the catalyst and the Nafion ionomer phase, is used to make catalyst layers and membrane electrode assemblies (MEAs). The influence of different hot-pressing conditions on the DMFC performance and various properties of the MEAs, in particularly on the properties of the anode, are investigated and compared to MEAs made by the conventional spray method. The highest DMFC performance is achieved using MEAs made by stenciling. It is also found that the membrane resistance (Rm), the resistance to proton transport within the catalyst layer (Rp) and the charge transfer resistance (Rct) towards the CH3OH oxidation reaction are lower for stenciled vs. sprayed anodes.
INTRODUCTION
A variety of methods exist to prepare membrane electrode assemblies (MEAs) for fuel cell (FC) applications. The majority of methods involve the preparation of an ink that consists of the catalyst powder and the Nafion ionomer. The ink is applied by e.g., spraying or ink jet printing onto either the gas diffusion layer (GDL) or the Nafion membrane. The former is referred to as catalyst coating substrate (ccs) method, while the latter is referred to as catalyst coating membrane (ccm) method. Application of the catalyst layer directly onto the membrane, i.e., the ccm method often utilizes the Na+ form of the Nafion membrane (1). This is done to suppress membrane wrinkling and swelling known to be substantial for the H+ form of Nafion membranes. In this case, the Nafion membrane needs to be converted into the H+ form by boiling the hot-pressed MEA in H2SO4 prior to its use in a FC. This ccm process is laborious. Furthermore, substantially higher hot-pressing temperatures are needed to form the MEA using the Na+ rather than H+ form of Nafion membranes, as the glass transition temperature of the former is higher. This can lead to the modification of the catalyst such as e.g., catalyst particle agglomeration, which in turn lowers the FC activity. MEAs have also been made by applying the catalyst layer directly onto dry Nafion membranes in the H+ form. However, this requires a slow catalyst application process that typically utilizes heat lamps to enable fast solvent evaporation to avoid swelling the membrane (2). Working with inks also poses issues such as waste of expensive catalyst materials and solvents. Furthermore, inks have a limited shelf life and the reproducibility of the MEA fabrication process can be poor.
In recent work, an MEA fabrication method that involves the application of a dry powder, consisting of the catalyst and the Nafion ionomer, and prepared by freeze drying, has been reported (3). Catalyst layer electrodes are made by distributing a weighed amount of powder across the surface of the GDL. The exposed GDL area is limited by using a frame. The powder is then compressed at room temperature and subsequently hot-pressed to form the anode and cathode electrodes. The final MEAs are then formed by hot-pressing a Nafion membrane that is sandwiched between the anode and cathode electrodes. This process is referred to as the stencil method in this work. The goal of the previous study was to develop an MEA fabrication method that is simple, reproducible and involves little waste material for FC tests on the laboratory scale, i.e., MEAs of 5 cm2 geometrical areas were produced. The MEAs were compared to assemblies made by the more conventional ccs spraying method. It was found that very reproducible MEAs were manufactured using the stencil method. The direct methanol fuel cell (DMFC) performance was found to be the same for MEAs made by stenciling and spraying. However, “mild” hot-pressing conditions were used to make the MEAs in the first study, hence, optimal MEA properties may not have been achieved.
In this work, the influence of the hot-pressing conditions on MEAs made by stenciling and the more conventional ccs spraying technique are explored. The DMFC performance and the electrochemically active surface areas of the anode and cathode layers are measured. Furthermore, the MEAs are characterized in terms of proton resistance of the anode catalyst layer, the membrane resistance, the charge transfer resistance towards the methanol oxidation reaction and their morphology in order to understand the differences in the MEA properties.
EXPERIMENTAL
Catalyst powders
20 wt. % Pt + 10 wt. % Ru on carbon black (Pt-Ru/C) from Johnson Matthey (HiSPECTM 5000) and 60 wt. % Pt/C (Johnson Matthey, HiSPECTM 9000) were used as the anode and cathode catalysts, respectively. Relatively thick anode catalyst layers were formed, which allows for the better characterization of the layers. 140 and 50 mg of the anode and cathode catalyst powders, respectively were mixed with 2.5 ml distilled H2O and 15 ml isopropyl alcohol. 1200 and 282 mg of Nafion solution (Sigma-Aldrich, 5 wt.% Nafion in lower alcohols) were also added for the anode and cathode powders, respectively. These ratios are equivalent to Nafion contents in the dry anode and cathode catalyst layer of 30 and 22 wt. %, respectively. The inks were mixed in a Fisher Scientific FS 20 (60 W) sonicator. For the preparation of the dry powders used for the stenciling method, a 500 mL Fast-Freeze Flask (LABCONCO) was used to prepare the inks. Immediately after sonication, the ink mixtures were frozen using liquid nitrogen and freeze-dried overnight using a LABCONCO, FreeZone 1 Liter Benchtop Freeze Dry Systems, as described elsewhere (3). This resulted in a dry powder consisting of the catalyst and the Nafion ionomer phase. In case of spraying, the inks were immediately applied onto the gas diffusion layer (GDL) after sonication, while the dried powders can be stored for at least several weeks.
The anode and cathode electrodes were prepared either by stenciling the freeze dried catalyst-Nafion powder or by spraying the catalyst-Nafion ink onto the GDLs (Carbon paper, TGPH-060, Electrochem. Inc.). Each MEA was made to achieve a 2 mg Pt+Ru loading for the anode and 1 mg Pt loading for the cathode per cm2 MEA area. The exact catalyst loadings were determined by weighing the electrodes and the GDLs. The attempted loadings were achieved within 5 and 15 % using the stencil and spray method, respectively. The stenciling method is described in detailed in previous work (3). Flat stainless steel plates (wrapped with Aluminum foil) of 0.99 and 0.5 mm thickness for the anode and cathode catalyst layers, respectively and exposing a square area of 6.45 cm2 were used as frames. The frames were placed onto the GDL and a weight amount of the freeze dried powder was spread uniformly across the GDL. The powder was first compressed with, an Aluminum foil wrapped, rectangular stainless steel stamp. This assembly was then covered with aluminum foil, and hot-pressed resulting in the catalyst layer. In case of spraying, the sonicated ink was directly sprayed onto the GDL using an airbrush. Separate airbrushes were used to spray the anode and cathode electrodes in order to avoid cross-contamination. The anode and cathode electrodes were subsequently transformed into MEAs by hot-pressing using a Nafion 117 membrane (Electrochem., Inc.) as a separator. Prior to the use of the MEAs, the Nafion membranes were cleaned and converted into the acid form by boiling in 3 wt. % H2O2, in deionized H2O, in 0.5 M H2SO4, and finally, for a second time in deionized H2O. The membranes were boiled for 1 h in each solution, and stored in deionized water prior to their use.
In case of stenciling, identical hot-pressing conditions were used to make the anode, the cathode and the entire MEA. All electrodes were formed directly onto the GDLs unless otherwise indicated. However, experiments were also carried out using MEAs consisting of a diffusion layer between the GDL and the catalyst layer. The diffusion layer was applied to the GDL by spraying a 90 to 10 wt. % mixture of Vulcan XC-72R to PTFE to achieve a 0.25 mg per cm2 Vulcan XC-72R loading. A Mitutoyo micrometer was used to measure the thicknesses of MEAs and electrode layers. The thicknesses of the anode catalyst layers were calculated by subtracting a blank, i.e., an MEA prepared in the same manner, but without the anode catalyst layer, from the thickness of the MEA of interest.
FC assembly and electrochemical measurements
The MEAs were sandwiched between two graphite current collector plates (Electrochem. Inc.) with a serpentine design for the fuel distribution for the various electrochemical measurements. 5 cm2 of geometrical MEA areas were exposed in this manner. A Silicon gasket (EC GS SIH NC12, 10 mil, Electrochem. Inc.) was used. DMFC performance curves and other data that are normalized for the geometrical area unless otherwise stated.
DMFC performance curves were measured at 40, 60 and 80 oC. The results shown in this work are for 40 oC only, as the trends were independent of the temperature range studied. An aqueous 1 M CH3OH solution was supplied to the anode at 2 ml min-1, and pure O2 was fed to the cathode at 100 sccm and atmospheric pressure for the DMFC tests. The O2 was humidified at 40 oC by passing through a humidifier (Fuel Cell technologies). The performance curves were measured galvanostatically using an electronic load (Keithley 2440, Alliance Test Equipment, Inc.). The reported cell potential values are recorded after 2 min. at a particular current density (j). Prior to the measurements, the MEAs were conditioned at room temperature by passing water at 2 ml min-1 and
exposing the cathode side to air overnight. After this conditioning process, the MEAs were subjected to a one time activation process, as follows: The MEAs were operated in the DMFC mode at 100, 150 and 200 mA cm-2 and 40, 60 and 80 oC for 2 h at each temperature feeding CH3OH and O2 to the anode and cathode, respectively. Subsequently, the DMFC performance curves were recorded on a daily basis at different temperatures. Between the daily measurements, the cell was conditioned with H2O on the anode and air on the cathode. “Steady-state” DMFC performances were obtained after the first day of measurements. “Steady-state” refers to the fact that the same performance curves were obtained over at least seven days of measurements for a particular MEA.
COads stripping measurements were carried out using a PC controlled Solartron 1287 potentiostat/galvanostat run by Corrware (Scribner Associates). The oxidation of COads was used to determine the electrochemical active surface areas (Ecat) of the Pt based catalyst in the anode and cathode layers. The measurements were carried at room temperature and in general after 3-days of DMFC performance measurements. Either the anode or cathode was supplied with humidified H2 (60 sccm) and used as reference electrode, while the other electrode served as the working electrode. Using the electrodes as reference electrodes in such a manner makes them dynamic hydrogen reference electrodes (DHEs). All potentials are referenced vs. the DHE in this work. Humidified CO (99.99 % pure gas) at 60 sccm was fed to the working electrode for 20 min. to allow for complete adsorption of CO onto the Pt catalyst sites, while the potential was maintained at 0.1 V. Excess CO was then purged from the cathode layer passing N2 at 100 sccm for 70 min. maintaining the potential at 0.1 V. Two complete oxidation/reduction cycles were recorded at 1 mV s-1 between 0 and 0.8 V. The first cycle served to electro-oxidize the COads, while the second cycle was used as background and to confirm that excess CO was indeed removed from the catalyst layer during the N2 purging process. The Ecat values were estimated from the COads stripping charge (QCOads) assuming that a monolayer of COads was formed and that CO adsorbs onto Pt and Ru sites. Therefore, a charge to Ecat conversion factor of 420 µC cm–2 was used. It is known that the actual charge to Ecat value conversion factor may be lower than 420 µC cm–2. Therefore, the Ecat values are not be treated as absolute numbers, but, rather as comparison between different catalysts. QCOads and Ecat values of the as-received anode and cathode catalyst powders were also obtained in 0.5 M H2SO4 using a well known thin layer electrode arrangement (4).
A Solartron potentiostat 1287 and frequency response analyzer 1260 driven by ZPLOT (Scribner Associates, Inc., version 2.8c) were employed for the EIS measurements. The frequency range between 10 kHz to 0.02 Hz was studied, acquiring 10 data points per frequency decade. A root mean square amplitude (rms) of 10 mV was employed. The ZView software (Scribner Associates, Inc., version 2.8) was used to fit the experimental data to the equivalent circuit. For all impedance measurements the cathode was used as DHE, as described above. Impedance spectra were obtained after 3-days of DMFC performance measurements. The proton resistance (Rp) of the anode catalyst layer was recorded in the absence of CH3OH and at room temperature using the H2/N2 method (3). Impedance spectra for the anode were also obtained in the presence of CH3OH by feeding an aqueous 1 M CH3OH solution to the anode at 2 ml min-1.
A scanning electron microscope (SEM, JEOL JSM-840A) was utilized to study the morphology of the top and cross sections of electrode layers. As prepared catalyst layers were used. Cross sections were prepared by breaking catalyst layers that were frozen in liquid N2.
Solutions and chemicals
High resistance water (18 MΩ) and A.C.S. grade chemicals were used in this work.
RESULTS AND DISCUSSION
Influence of the hot-pressing conditions on sprayed and stenciled MEAs
It is well known that the FC performance of MEAs is influenced by the hot-pressing conditions. Typically an increase in the performance is observed with an increase in the temperature (T) and pressure (P) used for hot-pressing. This is followed by a decrease in performance, once the “optimal” hot-pressing conditions are surpassed. This was also found to be the case in this work for both the stencil and spray method. However, the “optimal” hot-pressing conditions (in particular the T values) were found to be different for the stencil vs. the spray technique. It was found that an optimal T of 140 oC, a P of 9.8 MPa and a hot-pressing time of 5 min. resulted in the highest DMFC performance using the stencil technique, while the same conditions, but a 5 oC lower T of 135 oC, resulted in the highest performance for the spray technique. More importantly, the DMFC performance of the stenciled MEAs was found to be higher than for MEAs made by spraying provided optimized hot-pressing conditions were used. This is shown in Fig.1 for the example of a DMFC performance recorded at 40 oC.
0 0.1 0.2 0.3 0.4 0.5 0.6 0.7 0 100 200 300 0 10 20 30 40 50 60 70 J / mA cm-2 P / m W c m -2 E ce ll / V
Figure 1 DMFC performance curves measured at 40 oC for MEAs made by stenciling () and spraying ( ) using the optimized hot-pressing conditions discussed in the text.
Differences in MEA properties: Stenciling vs. spray technique
Ecat values of the anode and cathode catalysts were measured in a thin layer electrode arrangement, thus allowing for full catalyst utilization. The results suggest surface areas of 105 +/- 11 m2 g-1, and 55 +/- 6 m2 g-1 for the anode and cathode catalysts, respectively. Fig. 2 shows the Ecat values measured in the FC arrangement for both the anode and cathode catalyst layer made by stenciling and spraying. The MEAs were prepared by hot-pressing for 5 min. Fig. 2a shows the Ecat values as a function of T and constant P of 9.8 MPa, while Fig. 2b shows the same as a function of P and a constant T of 140 oC and 135 oC for stenciled and sprayed MEAs, respectively.
In case of the stenciled MEAs, the Ecat values for the anode catalyst layer are seen to be the same, and close to the maximal catalyst surface area measured in the thin layer arrangement, up to high T and P values used for hot-pressing. A similar behaviour is observed for the Ecat values of the cathode of the stenciled MEAs. However, the actual Ecat values for the cathode catalyst layers are lower, in the 40 m2 g-1 range, than the 55 m2 g-1 measured in the thin layer arrangement. The Ecat values for the cathodes of the sprayed MEAs appear to be similar to the stenciled MEAs. However, in case of the anode layers of these MEAs, the influence of the hot-pressing conditions on the Ecat values is very pronounced. A decrease in the values is already observed at T > 135 oC and P > 7.5 MPa. As a result, the Ecat values of the anode layers of MEAs made by spraying are lower than for MEAs made by stenciling. This is likely to be at least partially responsible for the lower DMFC performance observed for sprayed vs. stenciled MEAs prepared under the same conditions, provided that T > 130 oC and P > 8 MPa are used. It should be noted that the same trends were observed for MEAs made consisting of a diffusion layer between the GDL and catalyst layer, i.e., the Ecat values were higher for stenciled vs. sprayed anode catalyst layers using the diffusion layer. This suggests that the loss of catalyst surface area is not avoided using the diffusion layer.
Fig. 3 shows a series of Nyquist plots obtained for anode catalyst layers in the presence of methanol at a potential of 0.375 V vs. DHE. The cathode was used as DHE, hence, the high frequency intercept Z’ value includes the resistance of the membrane (Rm). All the EIS spectra were found to fit the same equivalent circuit (EQC) shown in Fig. 4. This EQC is similar as discussed by N-Y. Hsu et al. (5). The high frequency intercept corresponds to Rm, while the semi-circle and inductive loop features observed at the lower frequencies are related to the CH3OH oxidation reaction. Rct is the charge transfer resistance to the CH3OH oxidation reaction, while the inductance result from the the –CO type intermediate species adsorbed on the catalyst sites, as discussed by L. Bai and Mueller et al. (6,7). At intermediate frequencies, a straight line is observed, which is represented by R1 and CPE1 in the EQC shown in Fig. 4. The n value of CPE1 is close to 0.5 for all EIS spectra obtained, i.e., CPE1 behaves like a Warburg element.
R1 and CPE1 are assigned to proton transport within the catalyst layer (3,8). In fact, the proton resistance value (Rp) can be calculated from the modulus of this Warburg type feature (3,8). However, it is preferable to measure Rp in the absence of CH3OH or at low potentials where the CH3OH oxidation reaction is very slow to avoid possible errors due to the interference of the CH3OH oxidation reaction (3). Therefore, the experimental characteristics of the proton conductivity of the anode catalyst layers are discussed in the following section. Table 1 shows a summary of the values extracted using the EQC shown in Fig. 4 for five different MEAs.
0 20 40 60 80 100 120 140 120 140 160 180 200 220 T / oC 0 20 40 60 80 100 120 140 E c at -anode / m 2 g -1 E c a t-c a thode / m 2 g -1 Cathode Anode
Figures 2a and b Influence of the hot-pressing conditions on Ecat values of the anode and cathode layers for stenciled (black symbols) and sprayed (yellow symbols) MEAs. Fig. 2a shows the influence of hot-pressing temperature on Ecat using a pressure of 9.8 MPa. Fig. 2b shows the influence of the hot-pressing pressure using a temperature of 140oC for the stencilled MEAs and 135oC for the sprayed MEAs. In all cases, hot-pressing was done for 5 min.
0 20 40 60 80 100 120 140 6 8 10 12 14 P / MPa 0 20 40 60 80 100 120 140 E c at -a nod e / m 2 g -1 E ca t-ca th o d e / m 2 g -1 Cathode Anode a) b)
-2 0 2 4 6 8 0 2 4 6 8 10 Z' / ohm cm 2 -Z '' / ohm c m 2 sprayed MEAs stenciled MEA
Figure 3 Typical examples of Nyquist plots obtained in the presence of CH3OH for stenciled and sprayed MEAs at 0.375 V vs. DHE. The MEAs were hot-pressed for 5 min. using the following other conditions: -x-: 140 oC, 9.3 MPa; -∗-: 135 oC, 7.8 MPa; --: 135 oC, 9.3 MPa; -♦-: 135 oC, 11.3 MPa.
Figure 4 Equivalent circuit used to fit the EIS data for the anode catalyst layers measured in the presence of CH3OH and using the cathode as DHE (see Fig. 3 for examples).
Table I
EIS fitting data for anodes measured in the DMFC mode at 0.375 V vs. DHE Anode P# / MPa T#/ o C Rm / Ω cm2 R1 / Ω cm2 CPE1 ## / F cm-2 Rct / Ω cm2 Ecat * / m2 g-1 Cdl / F cm-2 Rme / Ω cm2 L1 / H cm-2 Stencil 9.3 140 0.3 2 0.29 3 105 0.45 0.7 12.5 Spray 7.8 135 0.45 5 0.13 4.5 88 0.57 0.4 22 Spray 9.3 135 0.6 4 0.11 5.5 77 0.39 0.7 28 Spray 11.3 135 0.75 3 0.14 6 73 0.38 1.4 32 Spray 11.3 140 0.7 3 0.11 6 70 0.42 1.5 32 #
: Hot-pressing conditions used to prepare the MEAs. In all cases the MEAs were hot-pressed for 5 min.;
##
: n value close to 0.5 (i.e., Warburg type element);
*: Ecat values for the anode catalyst layer measured using COads stripping voltammetry.
It is seen that both Rct and L1 are inversely proportional to the Ecat values. This suggests that the CH3OH oxidation reaction is more facile, and a lower degree of COads type intermediates are observed, for the anode catalyst layers that have a higher electrochemically active catalyst surface area such as e.g., the stenciled MEA. Furthermore, the high frequency resistance value, Rm, is also observed to be the lowest for the MEA made by stenciling. The Rm value of the stenciled MEA is 0.3 ohm cm2, thus being close to values reported for Nafion 117 membranes measured in a 100 % humidified N2 atmosphere (9). The value of R1 is also lower for the stenciled anode layer, possibly indicating a lower resistance to proton transport within the stenciled vs. the sprayed catalyst layer. Proton conductivity (σp) measurements of the anode catalyst layer carried out in the absence of CH3OH, as described in (3), also indicated a better conductivity, i.e., a lower Rp value, for the stenciled vs. the sprayed anode catalyst layers. σp is related to the thickness of the anode catalyst layer (da) and Rp as shown in eq. 1.
p R a d p = σ [1]
The results are summarized in Table II. Table II also shows the da values, which are seen to be essentially the same for all the MEAs. This in turn results in higher, i.e., better, σ p values for stenciled vs. sprayed MEAs.
Table II
Rp, σ p and Rm values extracted from Nyquist plots for selected anodes in the absence of CH3OH at 0.375 V vs. DHE
Anode P# / MPa T# / oC da##/ µm Rp / ohm cm2 σ p / mS cm-1
Stencil 9.3 140 88 (± 5%) 0.65 (± 5%) 13.5 Spray 7.8 135 85 (± 15%) 1.3 (± 15%) 6.5 Spray 9.3 135 86 (± 15%) 1.1 (± 15%) 7.8 spray 11.3 135 85 (± 15%) 1.2 (± 15%) 7.1 spray 11.3 140 85 (± 15%) 1.1 (± 15%) 7.7 #
: Hot-pressing conditions used to prepare the MEAs; ##
: Thickness (da) of the as prepared anode catalyst layer
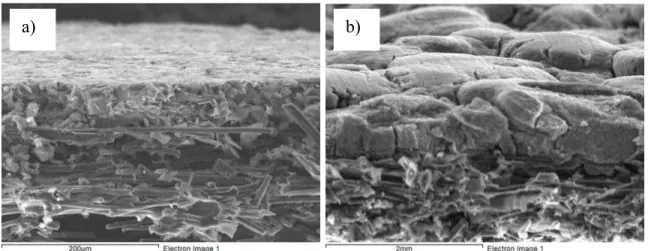
In addition to the improved Ecat, Rct, Rm and σp values observed for the MEAs made by stenciling vs. spraying, a more uniform catalyst layer thickness was also achieved using the stencil method. This is indicated in Figs. 5a and b, where cross sections of as prepared stenciled and sprayed anode catalyst layers, respectively, are shown. Fig. 5 also reveals that the surface of the stenciled anode catalyst layer is very smooth, while the sprayed catalyst layer shows a typical mud-crack structure. The latter is not desired as it is believed to form a poor interface between the catalyst layer and the membrane.
Figure 5 Tilted SEM cross-section images of as-prepared stenciled (Fig. 5a) and sprayed (Fig. 5b) anode catalyst layers. Both catalyst layers were made using the corresponding optimized hot-pressing conditions, i.e., 9.8 MPa, 5 min., and a T of 140 oC (Fig. 5a) and 135 oC (Fig. 5b).
SUMMARY AND CONCLUSIONS
MEAs were prepared using a conventional spray technique and a stencil method. The latter involves the use of a dry powder consisting of the catalyst and the Nafion ionomer and allows for the preparation of highly reproducible MEAs. Catalyst layers free of mud-cracks and of uniform thickness are formed using the stencil technique. It is found that a higher DMFC performance can be achieved using the stencil vs. the conventional spray technique, provided that optimal hot-pressing conditions are used. The Ecat values for stenciled anodes are higher than for sprayed anodes for the MEAs prepared in this work. This in turn results in a lower charge transfer resistance (Rct) of the CH3OH oxidation reaction and lower degree of –CO type intermediate formation, as indicated by impedance spectroscopy. Impedance spectroscopy, carried out in the absence of CH3OH, further suggests lower membrane resistance (Rm) and higher proton conductivity (σp) of the catalyst layer for the stenciled vs. sprayed MEAs.
ACKNOWLEDGMENTS
The authors like to acknowledge funding from the Trilateral NRC-ITRI-NSC program.
REFERENCES
1. X. Ren, M.S. Wilson, S. Gottesfeld, J. Electrochem. Soc., L12 (1996) 143 2. X. Leimin, L. Shijun, Y. Liyun, L. Zhenxing, Fuel Cells, 2 (2009) 101
3. L. Birry, C. Bock, X. Xue, R. McMillan, B. MacDougall, J. Appl. Electrochem., 39 (2008) 347
4. T.J. Schmidt, H.A. Gasteiger and R.J. Behm, J. Electrochem. Soc., 146 (1999) 1296
5. N-Y. Hsu, S-C. Yen, K-T. Jeng, C-C. Chien, J. Power Sources, 161 (2006) 232 6. L. Bai, D.A. Harrington and B. E. Conway, Electrochim. Acta, 32 (1987) 1703 7. J.T. Mueller, P.M. Urban, W.F. Holderich, J. Power Sources, 84 (1999) 157 8. Havránek A, Wippermann K, J. Electroanal. Chem., 567 (2004) 305