HAL Id: hal-01196818
https://hal.archives-ouvertes.fr/hal-01196818
Submitted on 10 Sep 2015HAL is a multi-disciplinary open access archive for the deposit and dissemination of sci-entific research documents, whether they are pub-lished or not. The documents may come from teaching and research institutions in France or abroad, or from public or private research centers.
L’archive ouverte pluridisciplinaire HAL, est destinée au dépôt et à la diffusion de documents scientifiques de niveau recherche, publiés ou non, émanant des établissements d’enseignement et de recherche français ou étrangers, des laboratoires publics ou privés.
Testing the Relevance of Daily MODIS Data to Monitor
Mediterranean Shrubland Canopy Water Content with
Temporal Cross-Correlation Analyses
Carole Delenne, Jean-Stéphane Bailly, Michel Deshayes
To cite this version:
Carole Delenne, Jean-Stéphane Bailly, Michel Deshayes. Testing the Relevance of Daily MODIS Data to Monitor Mediterranean Shrubland Canopy Water Content with Temporal Cross-Correlation Analyses. International Journal of Agricultural and Environmental Information Systems, IGI Global, 2013, 4 (1), pp.1-19. �10.4018/jaeis.2013010101�. �hal-01196818�
Testing the relevance of daily MODIS data to monitor
Mediterranean shrubland canopy water content with
temporal cross-correlation analyses
Carole Delenne1 , Jean-Stéphane Bailly2, Michel Deshayes3
1Université de Montpellier 2, UMR HSM, F- 34095 Montpellier
delenne@msem.univ-montp2.fr
2 AgroParisTech, UMR TETIS et UMR LISAH, F-34093 Montpellier
bailly@agroparistech.fr
3 Irstea, UMR TETIS, F-34093 Montpellier
michel.deshayes@teledetection.fr
Abstract. Drought alert systems for forest fire prevention often rely on
vegetation water content (VWC) monitoring which is a key parameter in forest fire hazard. In southern France, VWC is up to now monitored through regular field surveys. Thanks to the theoretical sensitivity of shortwave infrared reflectance to VWC, MODIS satellite data are potentially able to monitor VWC depending on plant species VWC magnitude. In this paper, a specific statistical approach based on temporal cross-correlations is developed in order to test the correlation between two MODIS water indices and VWC measurements coming from field surveys. This test aims in assessing the ability of daily MODIS data to monitor Mediterranean shrubland canopy water content and detect any delay effect between MODIS and field survey temporal series. Statistical tests are carried out for 29 sites containing 18 dominant shrubland Mediterranean species. 67 % and 54 % of significant correlation were found using respectively the NDII and NDWI indices from MODIS data. Correlation were found low (0.5 maximum) with a dominant negative delay effect, i.e. with a MODIS signal that reacts a few days after the field VWC. Test results show that, even if deeper pre-processing of MODIS data may be required, site soil, site vegetation cover and heterogeneity at MODIS pixel scale, as well as species VWC sensitivity make correlation between field VWC and MODIS water indices non univoque and highly variable. It stems from this study that many obstacles are still to overcome, for an accurate monitoring of Mediterranean shrubland canopy water content using MODIS daily data.
Keywords: MODIS ; drought ; water content ; infrared ; temporal
1 Introduction
Most of drought alert systems for forest fires prevention rely on vegetation water content (VWC) monitoring since this parameter plays a key role in the ignition and burning rate of woody or shrublands areas (Yi & Huili, 2010). In the Mediterranean area of southern France, the mean burnt area is about 20 000 ha per year (DGPM, 2012). Up to now, VWC monitoring is performed through a costly field survey network, requiring a periodic field work of a large number of agents followed immediately by a 24-hour laboratory data processing (Dauriac, 2004).
VWC is known to be sensitive to remote sensing infrared signal, especially shortwave infrared (SWIR) (Hunt & Rock, 1989; Ceccato et al., 2001; Chen et al., 2005; Ustin et al., 2008; Wang et al., 2008; Yilmaz et al., 2008). Yilmaz et al. (2008) recently succeed in the use of the Normalized Difference Infrared Index (NDII) from Landsat, ASTER and AWiFS images to remotely sense Equivalent Water Thickness (EWT) of corn leaves, which was found to be highly correlated to corn VWC.
With its high temporal resolution, the use of Terra-MODerate Resolution Imaging Spectroradiometer (Terra-MODIS) data has also been already explored for crop water content monitoring (Chen et al., 2005; Trombetti et al., 2008), for semi-arid ecosystems monitoring (Fensholt & Sandholt, 2003; Bajgiran et al., 2009) or for forest water content monitoring (Dasgupta, 2007; Liu et al., 2009; Qu & Ambrose, 2009). Walker et al. (2012) recently demonstrated the feasibility of a combined use of Terra-MODIS images (with high temporal resolution) and Landsat images (high spatial resolution) in order to monitor dryland forest phenology. In this study, forest dryland phenology was only measured through NDVI (Normalized Difference Vegetation Index) data and VWC was not considered. In addition, (Duveiller et al., 2011) pointed out the fact that modelling the instrument point spread as well as filtering MODIS data according to target and pixel overlaps, increase the accuracy in parameter estimations of crop phenomenology. However, the approach they proposed requires a precise spatial delineation of the objects to monitor, within MODIS pixels. This is hardly feasible in the case of Mediterranean shrubland VWC, that corresponds to a continuous mixing of species. Most of these studies were developing using existing or newly defined near and mid-infrared bands ratio indices, among which can be cited: the Normalized Difference Water Index (NDWI) (Zarco-Tejada et al., 2003), the Simple Ratio Water Index (SRWI) (Zarco-Tejada et al., 2003), the Shortwave Infrared Water Stress Index (NDII) (Fensholt & Sandholt, 2003), the Vegetation Temperature Condition Index (VTCI) (Wan et al., 2004) and the Normalized Difference Infrared Index (NDII) (Hardisky et al., 1983).
But, even if it has been demonstrated that satellite data with SWIR or NIR band can help vegetation water content monitoring, results largely depend on plant species range of variation in water content (Zarco-Tejada et al., 2003; Wang et al., 2008). This is particularly true for Mediterranean or semi-arid plant species that are known to be drought resistant. Moreover,
several other effects can disturb and delay correlation between satellite signal and VWC, such as soil type, vegetation cover and according root systems.
This paper presents a statistical test that aims in assessing the potentiality of water indices derived from usual pre-processed Terra-MODIS data in monitoring VWC over Mediterranean shrublands, a statistical test is presented in this paper. This test is derived from the general Mantel test, based on temporal cross-covariances or cross-correlations (Chatfield, 2004; Legendre & Legendre, 1998), to reveal the correlation significance (and associated delay effect) between usual Terra-MODIS water indices and VWC measurements from field surveys.
This paper is structured as follows. Section 2 describes the material, i.e. the 29 surveyed sites and dominant shrubland species, field measurements and remote-sensing data. Section 3 is devoted to the test description. Results are given in section 4. Study limitations are discussed along last section with concluding remarks.
2 Material
2.1 Study area and sites
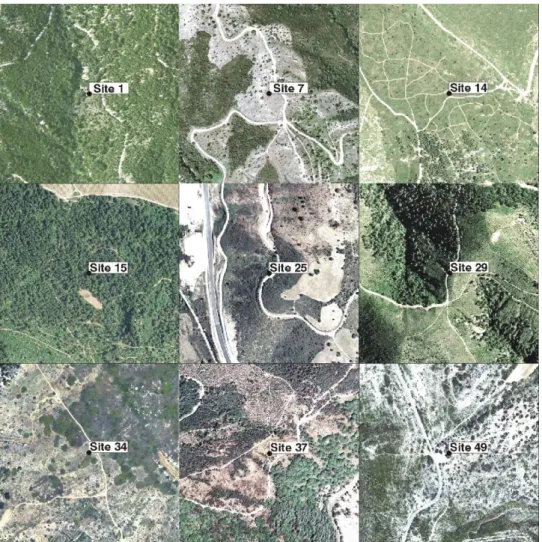
Networks of observations have been developed in Europe for twenty years to produce periodic inventories and carry out continuous monitoring of forest ecosystems. In the Mediterranean areas, a particular attention has been paid to prevent forest fires which represent one of the most serious environmental issue in such dry areas. To prevent forest fires, surveys have been conducted by French National Forest Office (ONF) staff every year since 1996 over up to 49 sites of the French Mediterranean area. 29 of these sites have been retained in this study. Their location is shown in Figure 1. Figure 2 shows 0.5 meter resolution aerial images of 9 examples of surveyed sites. Table 1 gives the name and coordinate of each site as well as the two dominant species
Figure 1. Study area (Mediterranean area - Southern France) and the 29 surveyed sites
(black points). Adapted from (CFM, 2012).
For each of the 29 sites, several samples of these two dominant species were collected twice a week during the "dry period", i.e. from the beginning of june to the end of september, in order to determine among other indicators the water content and combustibility of plants (see section 2.2 for detailed on the field survey). Dominant plants belongs to the Mediterranean shrubland species (Cistus monspelliensis, Erica arborea, Rosmarinus officinalis, etc.) or some less common species like Acacia dealbata (Dauriac, 2004). Table 2 lists the different species encountered in the study area and the sites where they are collected.
Site ID Site & territorial division names Latitude Longitude Dominant species (Table 2)
S1 Les Adrechs (Alpes de Hte Provence) 44.032 5.922 E19, E12 S2 Les Pailles (Alpes de Hte Provence) 43.982 6.501 E3, E12 S3 Bas Col (Hautes Alpes) 44.484 6.161 E12, E8 S6 Lou Lambert (Alpes Maritimes) 43.834 7.343 E19, E15 S7 Barbossi (Alpes Maritimes) 43.539 6.902 E7, E1 S8 Les Canebiers (Alpes Maritimes) 43.619 6.944 E6, E5 S9 Le Bois Commun (Ardèche) 44.342 4.102 E11, E2 S11 Col de Nouvelle (Aude) 42.911 2.798 E16, E19 S12 Le Chemin des Bornes (Aude) 43.127 2.922 E11, E7 S13 La Charlotte (Bouches du Rhône) 43.695 5.069 E16, E19
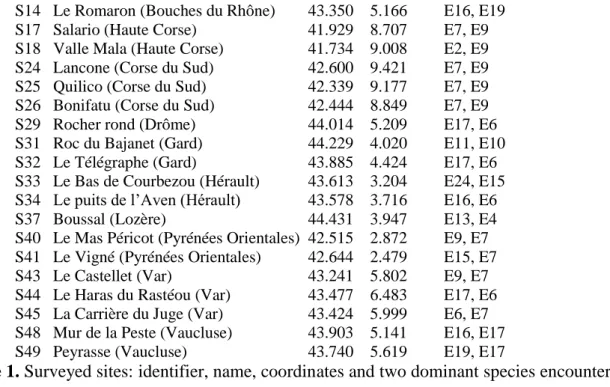
S14 Le Romaron (Bouches du Rhône) 43.350 5.166 E16, E19 S17 Salario (Haute Corse) 41.929 8.707 E7, E9 S18 Valle Mala (Haute Corse) 41.734 9.008 E2, E9 S24 Lancone (Corse du Sud) 42.600 9.421 E7, E9 S25 Quilico (Corse du Sud) 42.339 9.177 E7, E9 S26 Bonifatu (Corse du Sud) 42.444 8.849 E7, E9 S29 Rocher rond (Drôme) 44.014 5.209 E17, E6 S31 Roc du Bajanet (Gard) 44.229 4.020 E11, E10 S32 Le Télégraphe (Gard) 43.885 4.424 E17, E6 S33 Le Bas de Courbezou (Hérault) 43.613 3.204 E24, E15 S34 Le puits de l’Aven (Hérault) 43.578 3.716 E16, E6 S37 Boussal (Lozère) 44.431 3.947 E13, E4 S40 Le Mas Péricot (Pyrénées Orientales) 42.515 2.872 E9, E7 S41 Le Vigné (Pyrénées Orientales) 42.644 2.479 E15, E7 S43 Le Castellet (Var) 43.241 5.802 E9, E7 S44 Le Haras du Rastéou (Var) 43.477 6.483 E17, E6 S45 La Carrière du Juge (Var) 43.424 5.999 E6, E7 S48 Mur de la Peste (Vaucluse) 43.903 5.141 E16, E17 S49 Peyrasse (Vaucluse) 43.740 5.619 E19, E17
Table 1. Surveyed sites: identifier, name, coordinates and two dominant species encountered (see Table 2 for the correspondence between species ID and names).
Species ID Latin name Collected in sites:
E1 Acacia dealbata S7 E2 Arbutus unedo S9, S18 E3 Buxus sempervirens S2 E4 Calluna vulgaris S37 E5 Calycotoma spinosa S8 E6 Cistus albidus S8, S32, S34, S44, S45 E7 Cistus monspelliensis S7, S12, S17, S24-26, S40, S41, S43, S45 E8 Cytisus sessiliflora S3 E9 Erica arborea S17, S18, S24-26, S40, S43
E10 Erica cinerea S31
E11 Erica scoparia S9, S12, S31
E12 Genista cinerea S1-3
E13 Genista purgens S37
E15 Juniperus oxycedrus S6, S33, S41
E16 Quercus coccifera S11, S13, S14, S34, S48 E17 Quercus ilex S32, S44, S48, S49
E19 Rosmarinus officinalis S1, S6, S11, S13, S14, S49 E24 Cytisus scoparius S33
Table 2. Dominant species collected in the study area (see Table 1 for the correspondence between site ID and names).
Figure 2. Exemples of surveyed sites on the BD-Ortho (natural color image at 50 cm spatial resolution). Each image is a 500m sample square centered on the site.
Figure 3. Examples of site dominant species: Quercus ilex (up) and Quercus coccifera (down) (Dauriac, 2004)
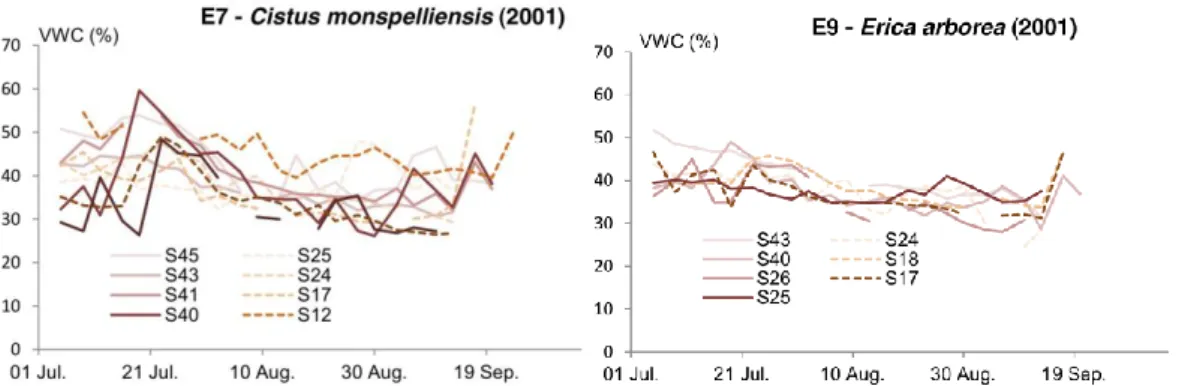
Figure 4. Vegetation water content in 2001 of the two mostly encountered species: Cistus monspelliensis (left) and Erica arborea (right) (CFM, 2012)
For each one of the 29 surveyed sites (Figure 1), well-lit shoots are collected twice a week at 12.00 am, from several plants from the two dominant species of the site (Tables 1 and 2). Leaves are taken from the plant canopy (Figure 3) since they have a higher relative water content in the
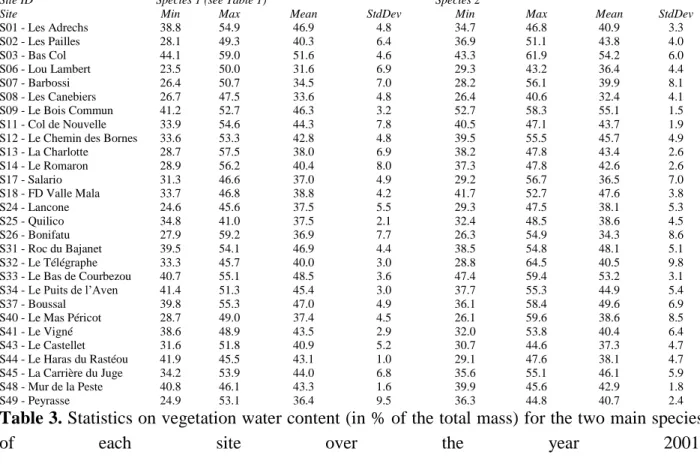
upper part of the crown (Sternberg & Shoshany, 2001). After mixing samples, five batches of 10 to 15 grams of green material of each species are placed in sealed and duly identified containers. These samples are also completed with a report describing site conditions (wind assessment, cloud cover and soil conditions) (CFM, 2012). This report also includes the amount of rainfall on the site between two consecutive surveys using a rain gauge. In the laboratory, each batch (plant material and container) are weighed before and after a 24 hour stay in a desiccator maintained at 60 Celsius degrees. This allows to estimate VWC relative to dry mass and the average water content per species and per site. Table 3 gives the statistics on the obtained VWC estimations per site. The low values obtained for standard deviations are indicative of the adaptability of Mediterranean shrubland species to dry conditions.
Figure 4 shows, as an example, the measured water content of the two mostly encountered species in 2001, i.e. E7 Cistus monspelliensis and E9 Erica arborea. On this figure, E7 shows higher VWC variability (28 to 60 %) than E9, ranging from 30 to 51 %.
All these data are made available in the afternoon of the day following field collection. Indeed, the results of these analyses are used in a process designed to provide relevant and real-time risk indicators (information disseminated in the late afternoon) to different actors involved in the fight against fire (Moro, 2006), allowing to issue a drought alert when required.
Site ID Species 1 (see Table 1) Species 2
Site Min Max Mean StdDev Min Max Mean StdDev
S01 - Les Adrechs 38.8 54.9 46.9 4.8 34.7 46.8 40.9 3.3 S02 - Les Pailles 28.1 49.3 40.3 6.4 36.9 51.1 43.8 4.0 S03 - Bas Col 44.1 59.0 51.6 4.6 43.3 61.9 54.2 6.0 S06 - Lou Lambert 23.5 50.0 31.6 6.9 29.3 43.2 36.4 4.4 S07 - Barbossi 26.4 50.7 34.5 7.0 28.2 56.1 39.9 8.1 S08 - Les Canebiers 26.7 47.5 33.6 4.8 26.4 40.6 32.4 4.1 S09 - Le Bois Commun 41.2 52.7 46.3 3.2 52.7 58.3 55.1 1.5 S11 - Col de Nouvelle 33.9 54.6 44.3 7.8 40.5 47.1 43.7 1.9 S12 - Le Chemin des Bornes 33.6 53.3 42.8 4.8 39.5 55.5 45.7 4.9 S13 - La Charlotte 28.7 57.5 38.0 6.9 38.2 47.8 43.4 2.6 S14 - Le Romaron 28.9 56.2 40.4 8.0 37.3 47.8 42.6 2.6 S17 - Salario 31.3 46.6 37.0 4.9 29.2 56.7 36.5 7.0 S18 - FD Valle Mala 33.7 46.8 38.8 4.2 41.7 52.7 47.6 3.8 S24 - Lancone 24.6 45.6 37.5 5.5 29.3 47.5 38.1 5.3 S25 - Quilico 34.8 41.0 37.5 2.1 32.4 48.5 38.6 4.5 S26 - Bonifatu 27.9 59.2 36.9 7.7 26.3 54.9 34.3 8.6 S31 - Roc du Bajanet 39.5 54.1 46.9 4.4 38.5 54.8 48.1 5.1 S32 - Le Télégraphe 33.3 45.7 40.0 3.0 28.8 64.5 40.5 9.8 S33 - Le Bas de Courbezou 40.7 55.1 48.5 3.6 47.4 59.4 53.2 3.1 S34 - Le Puits de l’Aven 41.4 51.3 45.4 3.0 37.7 55.3 44.9 5.4 S37 - Boussal 39.8 55.3 47.0 4.9 36.1 58.4 49.6 6.9 S40 - Le Mas Péricot 28.7 49.0 37.4 4.5 26.1 59.6 38.6 8.5 S41 - Le Vigné 38.6 48.9 43.5 2.9 32.0 53.8 40.4 6.4 S43 - Le Castellet 31.6 51.8 40.9 5.2 30.7 44.6 37.3 4.7 S44 - Le Haras du Rastéou 41.9 45.5 43.1 1.0 29.1 47.6 38.1 4.7 S45 - La Carrière du Juge 34.2 53.9 44.0 6.8 35.6 55.1 46.1 5.9 S48 - Mur de la Peste 40.8 46.1 43.3 1.6 39.9 45.6 42.9 1.8 S49 - Peyrasse 24.9 53.1 36.4 9.5 36.3 44.8 40.7 2.4 Table 3. Statistics on vegetation water content (in % of the total mass) for the two main species
of each site over the year 2001.
2.3. MODIS data
The Terra-MODIS sensor was launched by NASA onboard the Terra satellite in 1999. The Terra satellite is located on a sun-synchronous polar orbit at an elevation of 705 km. Terra’s mission is focused on the study of vegetation change and expanding deserts. It disposes of a variety of sensors with specific characteristics, that allow the observation of various Earth systems (atmosphere, land surface, oceans…). The MODIS sensor began acquiring images in February 2000. With a swath width of 2330 km, it can see every point on Earth every one to two days in 36 spectral bands from 0.4 to 14.4 μm .
Various MODIS products can be freely downloaded from NASA website, with spatial resolutions ranging from 250 m to 1 km at nadir, providing information on land surface temperature, ocean primary productivity, land cover, clouds, aerosols, water vapor, and fires. Among the MODIS products, "MODIS-Terra Surface Reflectance Daily L2G Global 500 m SIN Grid" has been used in this study for its high temporal resolution, consistent with short period of analysis (4 months).
These data represent ground spectral reflectances corrected from the influences of atmospheric absorption and scattering, due to atmospheric gases (water vapor and ozone) and aerosols
(Vermote & Vermeulen, 1999). These corrections use as input variables the atmospheric products derived from certain bands of MODIS, ancillary databases and global meteorological data (Dauriac, 2004). Spectral bands used in this study are given in Table 4. An additional channel contains a quality assessment for each pixel that has been used to eliminate cloudy pixels.
As long as vegetation monitoring with MODIS data is concerned, many methods proposed in the literature use data filtering regarding target overlap, etc. However, we chose to not filter MODIS data except using the quality assessment band thanks to the statistical method we used (Mantel test) that prevent to false correlation detection.
Code Resolution Spectral bands
MOD09GHK 1 day / 500 m 620-670 nm (B1) 841-876 nm (B2) 459-479 nm (B3) 545-565 nm (B4) 1230-1250 nm (B5) 1628-1652 nm (B6) 2105-2155 nm (B7)
Table 4. MODIS product used in this study. The spectral bands used are in bold. Many indices have been proposed in the literature from MODIS spectral bands, most of them using spectral bands in the infrared, sensitive to plant chlorophyll activity and water content, compared to the near infrared band B2. The two following have been tested in this study:
Normalized Difference Infrared Index (Hardisky et al., 1983)
(1)
Normalized Difference Water Index (Gao, 1996)
(2)
3. Method
3.1. Temporal cross-correlation analysis
Field measurements of VWC and MODIS water indices are considered as two different time series A ( t ) and B ( t ) with different time samples. In order to analyse the correlation between
the two temporal series which are not acquired at the same times, we compute the empirical temporal cross-correlation ̂ρ(h) with different time lag h (Legendre & Legendre, 1998):
NDII=B2− B6 B2+B6
NDWI=B2− B5 B2+B5
(3) In this equation, At1 A⋯ A tn A and Bt1 B⋯B tm B
denote the two temporal series samples, Ā and ̄B their respective means and σA , σB their respective standard deviations. i and j are sample
indices such as ∣ti A− t
j B∣=h
and k the number of (i,j ) pairs such as ∣ti A− t
j B∣=h
.
The temporal cross-correlation ̂ρ(h) is computed for various time lags to detect a possible delay effect of several days between an increase-decrease in water content in a plant and its effect on the satellite image in the optical and infrared domains (that corresponds to the time difference between time series where correlation is maximum). In addition to correlation magnitude estimation, the main advantage of this method is also to detect this delay effect.
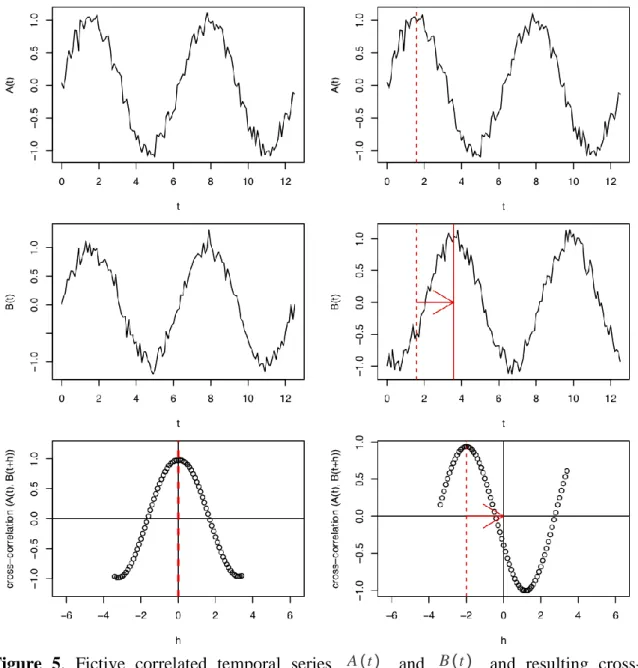
To illustrate the temporal cross-correlation and delay effect computation and interpretation between two time series A ( t ) and B ( t ) , figure 5 shows computed cross-correlations between
two fictive synchronous or asynchronous temporal series having sinusoidal shapes.
̂ρ(h )= ̂ρ( At,Bt+h)= 1 k
∑
( Ati A− Ā )(B tj B− ̄B ) σAσBFigure 5. Fictive correlated temporal series A ( t ) and B ( t ) and resulting
cross-correlation ̂ρ( At,Bt+h) : i) for synchronous series (left) having a maximum positive
correlation (dashed vertical red lines) at lag time h= 0 and ii) asynchronous series (right) having a positive maximum correlation observed with a delay effect h=− 2 , i.e. when
At is correlated to B( t− 2) . Red arrows in sub-figures delineate the delay effect between
A ( t ) and B ( t ) .
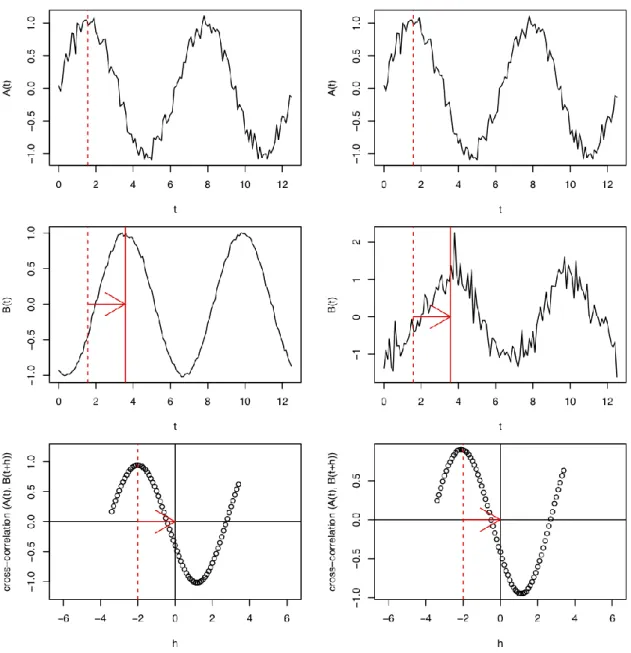
Moreover, as shown on figure 6, an other advantage of this method is that noise in temporal series does not perturb delay effect identification: it only and obviously reduces correlation magnitude.
Figure 6. Fictive correlated temporal series A ( t ) and B ( t ) and resulting cross-correlation ̂ρ( At,Bt+h) for asynchronous series having a maximum positive
cross-correlation observed with a delay effect h=− 2 and with low noise level for B ( t ) (left)
and ii) with high noise level for B ( t ) (right). Red arrows in sub-figures delineate the
delay effect between A ( t ) and B ( t ) , the identification of which is not perturbed by the
3.2. Cross-correlation significance test
For a given time lag h , even a low cross-correlation (negative or positive) can be significant, depending on data pairs number and correlation magnitude. The significance of the correlation for a given time lag h is assessed with the standard empirical Mantel test (Legendre & Fortin, 1989), which simulates data corresponding to absence of correlation with varying time lags (H0
hypothesis) through data permutations. For each data permutation, corresponding cross-correlations are computed. For numerous replications of the permutations, we obtain a quantile distribution of cross-correlations representing H0 for each time lag h . The H0 acceptance
area is thus represented in the cross-correlogram graph through a 95 % bi-lateral confidence band of H0 . For a given time lag h , we chose to reject H0 (i.e. accept that there is a correlation
between VWC and spectral data) when the cross-correlation for time lag h is over the 97.5 % quantile of H0 (the upper line of the band) or below the 2.5 % quantile of H0 (the lower line of
the band).
4. Results
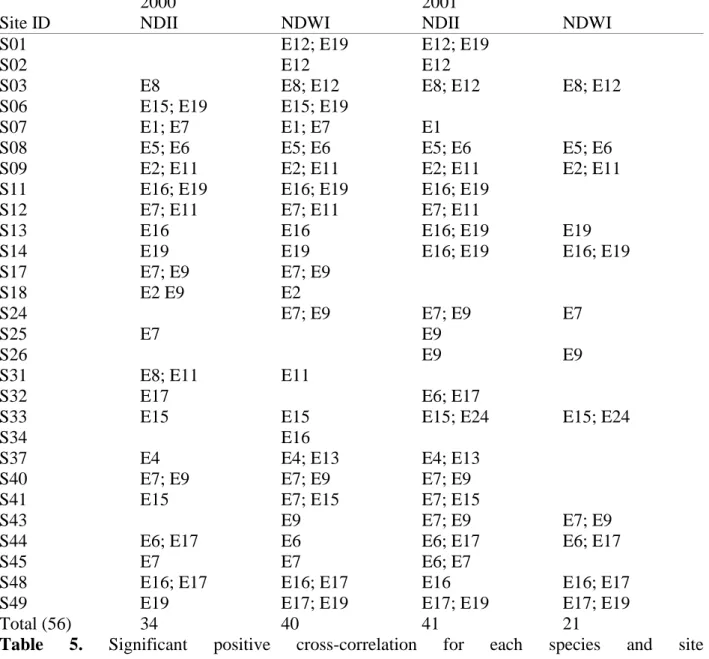
The cross-correlations between the field data and the NDWI and NDII indices from the daily MODIS data were calculated for all sites, all species and for the years 2000 and 2001. Table 5 lists the sites-species pairs for which a significant cross-correlation is encountered between measured VWC and NDII (Eq. 1) or NDWI (Eq. 2) indices. It can be seen that a higher number of significant cross-correlations are encountered using NDII index. This could be expected as NDII uses the B6 spectral band instead of B5 for NDWI, i.e. further in the infrared. 67 % and 54% of significant correlation were found using respectively the NDII and NDWI indices from MODIS data. All correlations are low (0.5 maximum) with a dominant negative delay effect, i.e. with a MODIS signal that reacts a few days after the field VWC.
2000 2001
Site ID NDII NDWI NDII NDWI
S01 E12; E19 E12; E19
S02 E12 E12
S03 E8 E8; E12 E8; E12 E8; E12
S06 E15; E19 E15; E19
S07 E1; E7 E1; E7 E1
S08 E5; E6 E5; E6 E5; E6 E5; E6
S09 E2; E11 E2; E11 E2; E11 E2; E11
S11 E16; E19 E16; E19 E16; E19
S12 E7; E11 E7; E11 E7; E11
S13 E16 E16 E16; E19 E19
S14 E19 E19 E16; E19 E16; E19
S17 E7; E9 E7; E9
S18 E2 E9 E2
S24 E7; E9 E7; E9 E7
S25 E7 E9
S26 E9 E9
S31 E8; E11 E11
S32 E17 E6; E17
S33 E15 E15 E15; E24 E15; E24
S34 E16
S37 E4 E4; E13 E4; E13
S40 E7; E9 E7; E9 E7; E9
S41 E15 E7; E15 E7; E15
S43 E9 E7; E9 E7; E9
S44 E6; E17 E6 E6; E17 E6; E17
S45 E7 E7 E6; E7
S48 E16; E17 E16; E17 E16 E16; E17
S49 E19 E17; E19 E17; E19 E17; E19
Total (56) 34 40 41 21
When scrutinizing each species and each site, various cross-correlations and delays effect occur. Single examples of these various situations are given below:
Figure 7 shows the cross-correlations between field VWC of species E9 (Erica arborea) and NDII index: low delay effects are encountered with maximum but low correlation (about 0.4) near lag time h= 0 . For the sake of conciseness, site 18 is not shown since it presents no significant cross-correlation.
Figure 8 shows the cross-correlations between field VWC of species E19 (Rosmarinus officinalis) and NDII index. Except for site S6, the highest correlation is encountered within a delay effect of -3 days, which means that MODIS signal reacts after E19 VWC signal. Consequently E19 seems to be a reactive species to rain event. For site S6, the correlation is higher (0.5) but with a delay effect of about 12 days.
Figure 9 shows an example of significant positive cross-correlation with a positive delay effect, which means that MODIS signal anticipates the shrubland species VWC signal. This configuration is encountered for example in site Barbossi (site 7), in the Alpes-Maritimes department, where the dominant species are Acacia dealbata and Cistus monspeliensis. Figure 10 shows the direct comparison of water content in these plants and NDII index defined above: despite a chaotic MODIS data profile, a general trend can be observed, consistent to the one of the field VWC measurements. From these two figures, it is observed that field VWC increases within three days to one week after the observation of a peak on the NDII index for species E7. This can be explained by the nature of the site that contains very sparse vegetation, by the nature of soil and dominant species with deep roots (E1). The effect observed by satellite can then be due to an important activity of the herbaceous layer, which reacts much faster to an increase in water availability (rain) than Acacia dealbata or Cistus monspeliensis. In addition, the two main peaks of the index NDII are observed simultaneously in the estimation by Météo-France of a large increase in soil water reserves.
Figure 11 shows the comparison of field VWC and NDWI index for the site S25 (Quilico in Corsica departments). It can be stressed from this figure that the variation of water content in plants is far too low to observe a trend in remote sensing. In addition, the peak values in the index NDWI appears one day prior to estimation by Météo France of a very large increase in soil water reserves. One can also see on the aerial photograph of the site (Figure 1) that it consists largely of bare soil, corroborates the hypothesis of an herbaceous layer that mainly responds to the presence of water.
Figure 7. Cross-correlations between NDII index coming from daily MODIS data and field VWC of species 9 for each site where it was collected. Red lines represent the lower and upper limits of the confidence band of absence of correlation.
Figure 8. Cross-correlations between NDII index coming from daily MODIS data and field VWC of species 19 for each site where it was collected. Red lines represent the lower and upper limits of the confidence band of absence of correlation
Figure 9. Cross-correlations using daily MODIS NDII index for the site S7 (Bar- bossi) in 2001 and left) E1 Acacia dealbata right) E7 Cistus monspeliensis. A cross correlation is observed, with a lag time lower than 3 days for E1 and of about one week for E7. Red lines represent the lower and upper limits of the confidence band of absence of correlation.
Figure 10. Field VWC and the NDII index series on S7 site in 2001 (both quantities are dimensionless, respectively in [0,1] and [-1,1]). All curve comes from ponctual data that have been linearly interpolated.
Figure 11. Field VWC and the NDWI series on Quilico site (Corsica) in 2001 (both quantities are dimensionless, respectively in [0,1] and [-1,1]). All curve comes from punctual data that have been linearly interpolated.
5. Discussion
Only 67 % and 54 % of significant correlation between daily MODIS indices and field VWC time series were found using respectively the NDII and NDWI indices. This is not surprising regarding the low variability in VWC during the summer period for somme Mediterranean shrubland species. For instance variation coefficient in water content for the Quercus coccifera is usually less than 1 % through the summer season. If this low variation in VWC can be determinant for fire hazard, one cannot expect to detect such a low VWC variation using remote sensing data, given the measurement uncertainties either on field or from the satellite. MODIS daily data have an appropriate temporal resolution but they are not corrected from viewing geometry effects (sun height, satellite viewing angle). Other pre-processing paths on MODIS data can be foreseen to reduce MODIS data level and improve test power. The first one consists in building a correcting model to avoid the spectral variations in daily data stemming from atmosphere effects or from the fact that the satellite orientation may be different each day (Duveiller et al., 2011). For instance, the correcting model can be built by selecting near each study site, several pixels belonging to invariant soil occupations. Another way to enhance results would be to select more homogeneous study sites, at least on one MODIS pixel. The sites should also contain species that are sensitive to dryness.
However, the low correlations (between 0.2 and 0.5) computed between daily MODIS indices and VWC field surveys may be partly explained by the inadequacy of the images in terms of their
spatial resolution. It is likely that the 500 m spatial resolution is inappropriate for the study of Mediterranean vegetation, which is generally not uniform over large areas. Indeed, it is clear on the
BD-ortho images (Figure 1), that most of the sites are located in heterogeneous areas to fit to a field sampling strategy aiming at sampling only two dominant species. The effect of a dominant species water content on the radiometry of a pixel is therefore limited in most cases. A way to improve the assessment of daily MODIS data use to monitor Mediterranean shrubland VWC certainly relies on a better field survey sampling, performed on more species located in the pixel (including herbaceous species) and with a canopy surface estimate for each species.
Surprisingly, the delay effect found from temporal cross-correlations between MODIS indices and species VWC for each site was varying from -7 to + 12 days. These various positive or negative delay effects show that there is no systematic synchronism between VWC sampled on leaves of shrubland species and optical signal in pixels. This probably means that delay occur depending on soil properties (soil water content) and species properties (root systems, etc) and according water content inertia phenomenon. This makes homogeneous monitoring of Mediterranean shrubland VWC with optical data even more difficult.
However, regarding scaling issues, the use of optical satellite data with smaller spatial resolution but keeping a high temporal resolution of a few days would probably improve the correlation to field VWC. This would be the case i) using SPOT 4 data thanks to its depointing capacity, and ii) using the future Sentinel-2 satellite, that will offer frequent acquisition data and appropriate spectral bands.
6. Conclusion
The aim of this study was to test the relevance of MODIS daily data to monitor and map Mediterranean shrubland VWC in the framework of forest fire prevention. For the sake of efficiency, the free daily images provided by Terra-MODIS satellite have been used. The main innovation of this study was to develop a statistical test based on temporal cross-covariances in order to i) assess correlations between usual MODIS indices and VWC measurements from field surveys and ii) detect a possible delay effect between the two temporal series.
Results show that 67 % and 54 % of significant but low correlation were found using respectively the NDII and NDWI indices. In case of correlated series, a delay effect of several days has been observed. Results are partly explained by scaling issues: the spatial resolution of MODIS images (500 m) does not fit the spatial support of VWC field measurement and the spatial variability of VWC within pixels is unknown.
Finally, the main explanation for the low correlation we found may come from Mediterranean plants physiology (Lansac et al., 1994) which are well adapted to drought and regulate their water content in such a way that it only slightly decreases in summer, making it difficult to discriminate a real decrease from measurement noises. Consequently, it stems from this study that many
obstacles are still to overcome for an accurate monitoring of Mediterranean shrubland canopy water content using MODIS daily data.
Acknowledgements
This study has been partly funded by the European Forest Focus community action (2003-2008), that aimed to monitor in a harmonized manner long-term status of European forest ecosystems with a focus on fire prevention. The authors would also like to thank the French National Forest Office (ONF), the "Réseau Hydrique" group and Fabien Dauriac, a Ph.D student who participated to field surveys and laboratory measurements.
References
Duveiller, G., Baret, F. & Defourny, P. (2011). Crop specific green area index retrieval from modis data at regional scale by controlling pixel-target adequacy. Remote Sensing of Environment 115 (10), 2686 – 2701.
Fensholt, R. & Sandholt, I. (2003). Derivation of a shortwave infrared water stress index from modis near and shortwave infrared data in a semiarid environment. Remote Sensing of Environment 87, 111–121.
Gao, B.-C. (1996). NDWI: A normalized difference water index for remote sensing of vegetation liquid water from space. Remote Sensing of Environment 58, 257–266.
Hardisky, M., Klemas, V. & Smart, R. (1983). The influences of soil salinity, growth form, and leaf moisture on the spectral reflectance of spartina alterniflora canopies. Photogrammetric Engineering & Remote Sensing 49, 77–83.
Hunt, E. R. & Rock, B. (1989). Detection of changes in leaf water content using near- and middle-infrared reflectances. Remote Sensing of Environment 30, 43–54.
Lansac, A. R., Zaballos, J. P. & Martin, A. (1994). Seasonal water potential changes and proline accumulation in mediterranean shrubland species. Plant Ecology 113, 141–154.
Legendre, P. & Fortin, M.-J. (1989). Spatial pattern and ecological analysis. Vegetatio 80 (2), 107–138.
Legendre, P. & Legendre, L. (1998). Numerical ecology: 2nd English edition. Amsterdam: Elsevier Science BV.
Liu, M., Huang, F., Zhang, H. & Wang, P. (2009). Vegetation canopy water content estimation using gvmi and ewt model from modis data. In: 2nd International Congress on Image and Signal Processing, 2009. CISP ’09. pp. 1–4.
Moro, C. (2006). Inflammabilité et siccité de la bruyère arborescente et de l’arbousier ; risque spatial de la bruyère, campagne été 2006. Tech. Rep. PIF 2006-10 INRA, INRA. Qu, J. J. & Ambrose, S. D. (2009). Recent advances in remote sensing of wildland fires in the
Sternberg, M. & Shoshany, M. (2001). Aboveground biomass allocation and water content
relationships in mediterranean trees and shrubs in two climatological regions in israel. Plant Ecology 157, 171–179.
Trombetti, M., Riaño, D., Rubio, M., Cheng, Y. & Ustin, S. (2008). Multi-temporal vegetation canopy water content retrieval and interpretation using artificial neural networks for continental usa. Remote Sensing of Environment 112, 203–215.
Ustin, S. L., Riano, D. & Trombetti, M. (2008). The modis vegetation canopy water content product. In: American Geophysical Union, Fall Meeting 2008.
Vermote, E. & Vermeulen, A. (1999). Atmospheric correction algorithm: spectral reflectances (mod09) algorithm technical background document,. Tech. rep.
Walker, J., de Beurs, K., Wynne, R. & Gao, F. (2012). Evaluation of landsat and modis data fusion products for analysis of dryland forest phenology. Remote Sensing of Environment 117 (0), 381 – 393.
Wan, Z., Wang, P. & Li, X. (2004). Using MODIS Land Surface Temperature and Normalized Difference Vegetation Index products for monitoring drought in the southern Great Plains, USA. International Journal of Remote Sensing 25 (1), 61–72.
Wang, L., Qu, J., Hao, X. & Zhu, Q. (2008). Sensitivity studies of the moisture effects on modis swir reflectance and vegetation water indices. International Journal of Remote Sensing 29 (24), 7065–7075.
Yi, D. & Huili, G. (2010). Research on vegetation moisture content monitoring from modis data. In: 2010 2nd International Conference on Information Science and Engineering (ICISE). pp. 6870 – 6873.
Yilmaz, M., Hunt, E. & Jackson, T. (2008). Remote sensing of vegetation water content from equivalent water thickness using satellite imagery. Remote Sensing of Environment 112 (5), 2514 – 2522.
Zarco-Tejada, P., Rueda, C. & Ustin, S. (2003). Water content estimation in vegetation with modis reflectance data and model inversion methods. Remote Sensing of Environment 85 (1), 109–124.


![Figure 10. Field VWC and the NDII index series on S7 site in 2001 (both quantities are dimensionless, respectively in [0,1] and [-1,1])](https://thumb-eu.123doks.com/thumbv2/123doknet/13957695.452707/19.921.137.770.534.903/figure-field-ndii-index-series-quantities-dimensionless-respectively.webp)
