Biomechanics of the Human Chorioamnion
by
Thibault Philippe Pr6vost
Ingenieur de l'Ecole Polytechnique
Ecole Polytechnique (2004)
Submitted to the Department of Materials Science and Engineering
in partial fulfillment of the requirements for the degree of
Master of Science
at the
MASSACHUSETTS INSTITUTE OF TECHNOLOGY
February 2006
( 2006 Massachusetts Institute of Technology
All rights reserved
The author hereby grants to Massachusetts Institute of Technology
permission to reproduce and
to distribute copies of this thesis document in whole or in part.
Signature of Author
Certified by ...
Department of MatKials Science and Engineering
January
31, 2006
... ...
Subra Suresh
Ford Professor of Engineering
Thesis Supervisor
Certified by ...
...
... ...
Simona Socrate
Assistant Professor of Mechanical Engineering
--)
-,
Thesis Supervisor
Accepted
by ...
c __, 1 1 A 11_
Samuel Ivl. Allen
POSCO Professor of Physical Metallurgy
MASSACHUSETTS INSTITUTE OF TECHNOLOGY
Biomechanics of the Human Chorioamnion
by
Thibault Philippe Pr6vost
Submitted to the Department of Materials Science and Engineering
on January 31, 2006, in partial fulfillment of the requirements for the degree of
Master of Science
Abstract
The human fetal membrane, namely the chorioamnion, is the structural soft tissue retaining
the amniotic fluid and the fetus during pregnancy. Its biomechanical integrity is crucial for
maintaining a healthy gestation and a successful delivery. The premature rupture of the
fetal membrane (PROM) can result in serious perinatal complications. Despite extensive research in this field, the mechanical and biochemical processes governing the membrane
deformation and failure remain poorly understood. The aim of this study is to characterize
the mechanical behavior of the chorioamnionic tissue along with its biochemical properties,
through mechanical testing and biochemical analyses. In order to accomplish this goal,
specific mechanical and biochemical testing protocols were developed. In vitro mechanical testing was performed on samples from seven patients under different uniaxial and biaxial
loading conditions. Significant relaxation was noted under uniaxial loading while very limited
creep was observed under biaxial loading. Biochemical measurements such as collagen and
sulfated glycosaminoglycan contents were also obtained. In addition, a microstructurally
based constitutive model for the fetal membrane is proposed. The model allows for nonlinear
hyperelastic response at large deformation. We also propose a framework to capture the
time-dependent response of the tissue. The model was implemented in a finite element formulation
to allow three-dimensional simulations of membrane deformation.
Thesis Supervisor: Subra Suresh Title: Ford Professor of Engineering Thesis Supervisor: Simona Socrate
Contents
List of Figures
List of Tables
Acknowledgments
11 1112
1 Motivation and Background
13
1.1 Introduction ... 13
1.2 Anatomy and structure . . . ... .. . . 13
1.3 Extracellular matrix components of the fetal membranes .
...
17
1.3.1 Collagens . . . ... 17
1.3.2 Proteoglycans . . . ... 20
1.3.3 Other glycoproteins and elastin ...
..
21
1.4 Premature Rupture Of Membranes (PROM) ... 23
1.4.1 Clinical definition and diagnosis ... 23
1.4.2 Inferred risks and medical management ... 24
1.4.3 Etiology ... . 25
2 Experiments
28
2.1 Tissue collection and preparation ...
28
2.2 Unia>xial tensile test .... ... 30
2.3 Pressurized bulge test ...
2.3.1 Apparatus and methods
2.3.2 Measurements ...
2.3.3 Comments ...
2.4 Biochemical testing ...
2.5 Thickness measurement ...
2.6 Protocol summary.
... . 37
... . 37
... . 37
... . 40
... . 42
....
42
... .
42
3 Results
3.1 Histological studies ...
3.2 Membrane thickness.3.3 Biochemical testing ...
3.3.1 Water content and amnion/chorion mass ratios
3.3.2 Sulfated glycosaminoglycan content ...
3.3.3 Collagen content - Collagen extractability . .
3.4 Mechanical testing. 3.4.1 Uniaxial tensile tests ... 3.4.2 Biaxial pressurized bulge test ...3.5 Critical measurement: membrane strain in vivo . . .
3.5.1 Membrane marking ... 3.5.2 Magnetic Resonance Imaging (MRI) ...4 Modeling and comparison of the model predictions with the experimental
results
4.1 Collagen planar network ...4.1.1 Individual chain force-stretch relationship ...
4.1.2 Representative network structure ...
4.1.3 Stress-Strain Constitutive Behavior ...
4.1.4 Stretch criterion ...
4.2 Time-dependent response ...
4.3 Numerical implementation ...
45
. . .. .. .. . .. . .45... . .45
... . .47
... . .47
... . .48
... . ..48
. . . . .. .. . .. . .49 . .. . .. . ... . . .49 . .. . .. . .. .. . .55... ..58
. .. . .. . . ... . .62... ..62
65
65 66 67 68 70 70 724.3.1 4.3.2
Results .
Discussion.
5 Conclusion and recommendations for future work
5.1 Conclusion ...
5.2 Recommendations for future work ...
A Membrane Clinical variables
B Mechanical Testing and Thickness Measurement Protocols
B.1 Collecting Chorioamnionic Membrane from the New England Medical Center
B.1.1 Materials ...
B.1.2 Procedure ...
B.2 Pressurized Bulge Test with CA Specimen . .
B.2.1 Equipment and materials ...
B.2.2 Procedure ...
B.3 Uniaxial Tensile Test with Amnion Specimen.
B.3.1 Equipment and Materials ...
B.3.2 Procedure ...
B.4 Thickness Measurement.
B.4.1 Equipment and Materials.
B.4.2 Procedure ...
C Biochemical assay protocols
C.1 Water content and Amnion/Chorion mass ratio measurement ...
C.1.1 Materials.
C.1.2 Procedure ...
C.2 Pulverization and Homogenization for Collagen and GAG Content Assays ..
C.2.1 Materials ...
C.2.2 Procedure ...
72 7378
78 7981
83
83... .. 83
. . . 83 . . . 84... ...84
... ..86
... ...87
... ...87
... ...90
. . . 91 . . . 91... ..93
94
94 94 95 95 95 96C.3.2 Procedure ...
97
C.4 Collagen Content - Tissue Preparation for the Hydroxyproline Assay ...
.
97
C.4.1 Materials ... 97
C.4.2 Procedure ... 98
C.5 Sulfated Glycosaminoglycan Content - DMMB assay
.
...
98
C.5.1 Materials ... 98
C.5.2 Procedure ... 99
C.6 Collagen Extractability Assay ... 99
C.6.1 Materials ... 99
C.6.2 Procedure ... 99
D Pressurized Bulge Test Engineering Drawings
101
E Matlab m-files for Image Analysis
104
List of Figures
1-1 (A) Sagittal section of the pelvis of an adult woman. (B) Uterus of pregnant woman showing normal placenta in situ. Modified from "Williams Obstetrics"
[4] ... 14
1-2 Illustration showing chorionamnionic sac in uterus at early (Figure A) and more advance (Figure B) stages of pregnancy. Modified from "Williams
Ob-stetrics" [4] ... 16
1-3 Schematic section through human chorioamnion. A: Epithelium. B:
Base-ment membrane. C: Compact layer. D: Fibroblast layer. E: Spongy layer. F: Cellular layer. G: Reticulum layer. H: Pseudo-basement membrane. I:
Trophoblast layer. From Bourne GL [7]. ... 17
1-4 Schematic illustration of the CA membrane microstructure at term. The
main ECM components of each layer, the production sites of matrix
metal-loproteinases (MMP), and tissue inhibitors of metalmetal-loproteinases (TIMP) are
shown. From [3]. ... 18
1-5 The structure of a typical collagen molecule. (A) Schematic section of a
single collagen a chain in its left-handed helical conformation. The chain is about 1000 amino acids long. (B) Schematic section of a collagen molecule
in which three a chains are wrapped around one another to form a
triple-stranded helical rod. Glycine is the only amino acid small enough to occupy
the crowded interior of the triple helix. Only a short length of the molecule
1-6 Cross-links formed between modified lysine side chains within a collagen fibril.
FErom "Molecular Biology of the Cell" [12], chapter 19. ... 20
1-7 Scanning electron micrograph of the amnionic layer showing the dense collagen fibril network of the compact layer beneath an epithelial cell layer. Micrograph
picture taken by Dr. Steven Calvin at University of Minnesota. ...
21
1-8 The linkage between a GAG chain and its core protein in a proteoglycan
molecule (A); the repeating disaccharide sequence of a dermatan sulfate gly-cosarninoglycan chain (B); and examples of a small (decorin) and a large(aggrecan) proteoglycan found in the extracellular matrix, compared with a
typical secreted glycoprotein molecule, pancreatic ribonuclease B (all three are drawn to scale). From "Molecular Biology of the Cell" [121, chapter 19.. 222-1 Chorioamnionic membrane and placental disc collected after delivery. .... 29
2-2 Uniaxial testing apparatus. . . . ... 31
2-3 Force (F) and grip displacement (AL) as recorded along the vertical tensile
direction
...
32
2-4 Uniaxial load-unload cycle definition ... 33
2-5 Uniaxial creep test definition over the first 100 seconds ... 34
2-6 Uniaxial stress relaxation definition over the first 100 seconds. ... 35
2-7 Pictures of pressurized bulge test apparatus. ... 38
2-8 Schematic illustration of pressurized bulge test device and protocol. ... 39
2-9 Membrane deflection profile analysis through MATLAB. Profile peak tracked as a function of time at any given pressure step ... 41
2-10 Summary of biochemical assay protocol. ... 43
2-11 Summary of the membrane protocols ... 44
3-1 Histological cross-sections from one typical CA specimen, showing the amnion
layer (A), the chorion layer (C) with its trophoblast layer (T), and part of the
decidua (D). The histological studies were performed by Dr. Michael Houseat the New-England Medical Center. ...
46
3-2 Uniaxial load-unload cycles from one typical patient. The average curve is
shown in red ... 50
3-3 Uniaxial creep curves obtained from one typical patient. The average response
over the first twenty minutes is shown in red ... 51
3-4 Uniaxial stress relaxation curves from one typical patient. The average
re-sponse over the first 20 minutes is shown in red ... 52
3-5 Uniaxial average creep response from one typical patient fitted to an
expo-nential decay function ...
53
3-6 Uniaxial average stress relaxation response from one typical patient fitted to
an exponential decay function. ...
54
3-7 Typical stress-strain response of the amnion under uniaxial tension. The
engineering strain is defined as . Stress calculation is based on a 50 pm
amnion thickness. af and Ef refer to the failure stress and strain respectively.
Ef corresponds to the "pseudo-linear modulus" ...
.
56
3-8 Area strain and stretch calculation from membrane deflection profile .... 57
3-9 Upper graph: applied pressure as a function of time for one representative patient. The instantaneous and final deflections are shown for each 10 minute step. Lower graph: applied pressure as a function of the final deflection (after
10min pressure hold for each step) from the seven CA specimens. ... 59
3-10 Stress - area strain, and stress - equivalent 1D stretch responses from the seven
CA specimens tested. Stress calculation is based on a 50 pm thickness. ... 60
3-11 Biaxial creep response occurring during the initial 10 minute pressure hold.
From one representative specimen. ... 61
3-12 MRI image of the uterine cavity. The fetal membrane contour taken into
account in the cavity volume reconstruction is marked in red ... 63
4-1 Scanning electron micrograph revealing the multi-sheet collagen structure of
the compact and fibroblast layers beneath a thin epithelial cell layer. The
amnion is folded upon itself. Micrograph picture of the amnion taken by Dr.
4-2 The 4-fibril unit cell. The cell is taken to deform along the principal directions
of the planar left Cauchy-Green tensor ...
68
4-3 Uniaxial load-unload cycles from one typical patient. Results are compared
to the hyperelastic strain-to-failure curve from the model ...
74
4-4 Uniaxial load-unload cycles. Average stress-stretch curve from one typical
patient compared to the hyperelastic model predictions ...
75
4-5 Biaxial pressurized bulge test. Applied pressure vs membrane deflection peak curve compared to the hyperelastic model predictions ... 76
4-6 Biaxial pressurized bulge test: membrane in vitro response compared to the
model's predictions.
AL =1.06, Alinear
= 1.055,
KA= 10 Mpa,
NkTAL =800
Pa ...
77
B-1 Materials for biaxial testing ... 85
B-2 Pressurized bulge test: main steps. ...
88
B-3 Uniaxial testing fixtures and accessories. ... 89
B-4 Uniaxial testing: main steps ...
92
D-1 Acrylic cylinder engineering drawing (dimensions are in mm). ... 102
List of Tables
3.1 Amnion and chorion thickness measurements. ... 47
3.2 Amnion and chorion hydration level and mass ratios. The mass ratios are
based on 5 patients only. No measurement uncertainty was provided by
Mein-ert et al ...
47
3.3 Amnion and chorion collagen contents. ... .. 48
3.4 Comparison of parameters from the uniaxial strain-to-failure curves. Stress
computation is based on a 50 micrometer thickness ... 55
Acknowledgments
I first thank Professor Subra Suresh, whose counsel and support made this project possible.
I am also truly indebted to Professor Simona Socrate for her extraordinary guidance, and
her constant, enthusiastic support. Her invaluable help in the modeling has been critical to
the success of this project. I am as much indebted to Dr. Michael House without whom
none of the in vitro experiments could have been carried out.
My deepest gratitude goes to Kristin Myers for kindly allowing me to use her laboratory facilities and for so patiently and skillfully guiding me in the mechanical and biochemical testing. I am also truly grateful to Peter Morley from the MIT Machine Shop whose help in the design of the mechanical apparatus was essential.
Let me also warmly thank Dr. Hidemi Kato for his crucial contribution in performing
mechanical tests. His patience and support during uncountable hours of testing, along with
his critical reviewing, have greatly contributed to the success of this project.
I would neither forget to thank Professor Michelle Oyen, Dr. Steven Calvin, Orian
Regnier and Olivier Vernhet, for their crucial assistance in the successful starting of the
mechanical testing. Special thanks to Dr. Steven Calvin for his scanning electron microscopy
pictures of the chorioamnion.
I am also truly grateful for the fruitful contributions of Martin Skelton to the MATLAB
image analysis.
Finally, I would like to thank all my friends who have made the past twelve months at
Chapter 1
Motivation and Background
1.1 Introduction
Preterm delivery occurs in about 11% of all pregnancies in the United States and is one of the leading causes of perinatal morbidity and mortality [1]. Despite extensive research in
this field, the preterm birth rate has continued to rise steadily, increasing by more than 15%
over the past two decades [2]. Among the critical factors accounting for preterm delivery, are
preterm labor (i.e. premature onset of regular uterine contractions with progressive cervical
dilatation), rupture of the fetal membranes, cervical malfunction, bleeding, infection, fetal
anomaly or abruptio placentae. Premature rupture of the membranes (PROM) alone is
associated with 30 to 40 percent of all preterm births and is considered one of the main obstetrical complications resulting in preterm delivery [3]. Its clinical prevention, assessment
and treatment remain major challenges in modern obstetrics.
1.2 Anatomy and structure
The fetal membrane, also referred to as the chorioamnionic (CA) membrane, is the structural
soft tissue retaining the fetus within the uterine cavity during pregnancy (Figure 1-1). The
membrane itself consists of two main layers, the amnion (inner layer) retaining the amniotic
Figure 1-1: (A) Sagittal section of the pelvis of an adult woman. (B) Uterus of pregnant woman showing normal placenta in situ. Modified from "Williams Obstetrics" [4].
integrity is crucial for maintaining a healthy gestation: not only acting as a protective
"mechanical envelope" preventing the amniotic fluid and the conceptus from leaving the
cavity, it also allows for solute and fluid exchange from maternal blood to the fetus through
its numerous microscopic vascular projections or microvilli.
Its maturation throughout gestation corresponds to a complex, yet poorly understood,
process combining tissue growth, biochemical changes, and structural remodeling. Until near
the end of the third month of gestation, the chorion laeve remains a distinct entity, separated
from the amnion by the exocoelomic cavity and from the decidua vera by the uterine cavity
(Figure 1-2). By the fourth month, the enlarging sac fills the entire uterine cavity and, with
fusion of the decidua vera and capsularis, the cavity is obliterated. The amnion and chorion also come in close contact, forming a single bilayer (the chorioamnion) that continues to develop as a whole with the growing fetus until term.
The normal organization and microscopic anatomy of the CA membrane (Figure 1-3)
have been described in detail by Bourne et al [5-8]. The amnion, which is normally 20 to 80 m in thickness, accounts for the essential part of the CA membrane's strength [9]. It is
composed of five sublayers: the epithelium, the basement membrane, the compact layer, the
fibroblast layer and the spongy layer. The epithelium is the innermost layer in contact with
the amniotic fluid. It consists of a single layer of cells adherent to the basement membrane.
Beneath the epithelium lie the compact and fibroblast layers constituting 60 to 80 % of the
amnion's thickness. They essentially consist of a dense network of collagen fibrils responsible
for the tissue resilience. The intermediate layer lying at the interface of the amnion and the
chorion is referred to as the spongy layer, rich in hydrated proteoglycans.
The chorion, which is 100 to 500 ym thick, is a soft cellular structure resembling a typical
epithelial membrane and consisting of three main layers
1. Adherent to the trophoblast layer
(in contact with the maternal decidua), the basement membrane provides support for the
reticular layer which forms the majority of the chorion thickness (Figure 1-3).
'The additional "cellular layer" labelled as such by Bourne can be considered as part of the reticular
Decidua Embryo in ' anionic sac Chorionic villi Deckdua Yo a-Exoco
cavity Uterine cavity A Uterine cavit~
A
A
i
Figure 1-2: Illustration showing chorionamnionic sac in uterus at early (Figure A) and more advance (Figure B) stages of pregnancy. Modified from "Williams Obstetrics" [4].
s
lnmrw
-chose
Figure 1-3: Schematic section through human chorioamnion. A: Epithelium. B: Basement
membrane. C: Compact layer. D: Fibroblast layer. E: Spongy layer. F: Cellular layer.
G: Reticulum layer. H: Pseudo-basement membrane. I: Trophoblast layer. From Bourne
GL [7].
1.3 Extracellular matrix components of the fetal
mem-branes
The extracellular matrix (ECM) is the organized assembly of macromolecules surrounding the
cells. Collagen and proteoglycan molecules are, along with elastin, fibronectin and laminin,
the major components of the CA membrane ECM (Figure 1-4), accounting for the tissue
integrity and macroscopic mechanical properties [11].
1.3.1
Collagens
Collagens are glycoproteins consisting of polypeptide chains, called a chains, characterized
by the repeated Gly(Glycine)-X-Y amino-acid sequence (X and Y often referring to proline
and hydroxyproline), that can assemble into stable triple helical structures (Figure 1-5).
Their extensive post-translational modifications [12] lead to the formation of higher-order
aggregates stabilized by covalent intra- and intermolecular crosslinks (Figure 1-6) via reactive
Amniotic fluid Layer Amnalon helium errent nbrane npact layer oblast layer rmsdiate ogyl layer Chodion cular if ement iTfane I i v I, JUl I D Mateal decidua Maemal decidua Extracellular-Matrix Composition
Collagen types III, V, V; labinin,
ibronectin, nidogen Cdollagen types 1, 1, V. VI; ibronectin
Collagen types I. II, VI; nidogen, laminin, libonectin
Collagen types I, IMV;
proleogans
Collagen types I, II, IV, V, VI;
proteoglycans
Collaqen type IV; fibronectin,
Lwmidn
Figure 1-4: Schematic illustration of the CA membrane microstructure at term. The main
ECM components of each layer, the production sites of matrix metalloproteinases (MMP), and tissue inhibitors of metalloproteinases (TIMP) are shown. From [3].
MMP or TIMP Produced MWA-iMMP-2. MW-9 MMP-1 MMP-9 11MP-1 MMP9 Ot- . .7. ··
-Its
v,, . -f At- e-~
nhW:iAI l (B)
glycine .
I i
1.5 nm
Figure 1-5: The structure of a typical collagen molecule. (A) Schematic section of a single
collagen a chain in its left-handed helical conformation. The chain is about 1000 amino
acids long. (B) Schematic section of a collagen molecule in which three a chains are wrapped around one another to form a triple-stranded helical rod. Glycine is the only amino acid small enough to occupy the crowded interior of the triple helix. Only a short length of the molecule is shown; the entire molecule is 300 nm long. From "Molecular Biology of the
Cell" [12], chapter 19.
crosslink . '
inlevnole Ula,
' - -' -cross, tn
Figure 1-6: Cross-links formed between modified lysine side chains within a collagen fibril. From "Molecular Biology of the Cell" [12], chapter 19.
At least twenty genetically distinct types of collagen have been identified so far. Collagen types differ not only in their amino acid sequences but also in their spatial conformations
conferring to them specific functional properties [12]. Collagen types I and III, together with
smaller amounts of types IV, V and VI, are thought to be the main collagen components of
the CA membrane (Figure 1-4). Collagens I, III and V belong to the same family, for which
collagen molecules aggregate in quarter stagger arrangement to form higher order structures
or fibers. They are presumed to be the primary components of the collagen network-like
structure dominating the mechanical response of the tissue (Figure 1-7). Type IV collagen
molecules form structural sheets within the basal lamina of the amniotic epithelium and the
basement membranes of both amion and chorion. Finally, type VI collagen, whose functional
properties remain uncertain, is thought to provide anchoring filaments at the interface of the
amnion and chorion layers.
1.3.2 Proteoglycans
Proteoglycans are special glycoproteins (Figure 1-8) composed of a core protein to which sul-fated polysaccharides or glycosaminoglycans (i.e. repeating disaccharide units) are covalently
attached. Proteoglycans interact with collagen molecules to promote network crosslinking
and to regulate collagen fibril formation.
Sulfated glycosaminoglycans such as dermatan and chondroitin sulfate, small
proteogly-cans like decorin or biglycan, and to a smaller extent, large proteoglyproteogly-cans such as versican and perlecan, have been identified in the CA membrane ECM [13,14]. A non-sulfated gly-cosaminoglycan, hyaluronic acid (hyaluronan, HA), is also present in the tissue. HA forms
Figure 1-7: Scanning electron micrograph of the amnionic layer showing the dense collagen
fibril network of the compact layer beneath an epithelial cell layer. Micrograph picture taken
by Dr. Steven Calvin at University of Minnesota.
complex networks and does not attach to a core protein. Essential contributors to the
viscoelastic response of the connective tissues [15], proteoglycans are also said to play a
structural role in maintaining the tissue integrity [16].
Decorin can be found in the amnion and also in the reticular layer of the chorion [14].
It binds to collagen types I and III, thereby enabling lateral organization of the collagen
fibrils [18]. Biglycan, another small proteoglycan, mainly located in the trophoblastic part
of the chorion, is thought to interact with type VI collagen [17]. Finally, the spongy layer
at the interface between the amnion and the chorion is dominated by hyaluronan [14] which
permits the amnion to slide on the underlying chorion, thereby alleviating shear stress along
the interface [3].
1.3.3 Other glycoproteins and elastin
B
A
epea(n dsaohade $ (X) , 114 A 4 satzfat S.tshot b- "ie )h(I b,.actl* ~.~t~ ,I ,1 { , , $,e i chan ,, GAGFigure 1-8: The linkage between a GAG chain and its core protein in a proteoglycan molecule
(A); the repeating disaccharide sequence of a dermatan sulfate glycosaminoglycan chain (B); and examples of a small (decorin) and a large (aggrecan) proteoglycan found in the
extracellular matrix, compared with a typical secreted glycoprotein molecule, pancreatic
ribonuclease B (all three are drawn to scale). From "Molecular Biology of the Cell" [12], chapter 19.
D
a
ler6,,
Some of the fibronectin molecules present in the trophoblast layer of the chorion are
believed to bind to ECM cells via specific integrin receptors [19], contributing to the
chorion-decidua adhesion. Disruption of such fibronectin binding, occurring before or at term, may result in the separation of the chorion from the decidua in the lower uterine segment [20,21].
Laminins, an important component of basement membranes, also interact with ECM
cells through integrin receptors [22,23]. Ensuring the "anchoring" of the epthelial cells to
the underlying stroma via the basement membrane, they are thought to perform a significant
strengthening function in the amnion [24].
Finally, elastin molecules, which correspond to complex insoluble proteins cross-linked to fibrillin-based microfibrils, are suspected to be abundant in the reticular and compact layers [25]. Having mechanical properties analogous to those of pure rubber, they may
confer to the fetal membrane part of its intrinsic elasticity [10].
1.4 Premature Rupture Of Membranes (PROM)
1.4.1 Clinical definition and diagnosis
PROM is defined as the rupture of membranes before the onset of labor. Rupture occurring before 37 weeks of gestation is referred to as preterm PROM. Premature membrane rupture is confirmed clinically by the leakage of amniotic fluid in the posterior vaginal fornix or clear fluid passing from the cervical canal [1]. Its diagnosis can be performed mainly through:
* sterile speculum cervical examination2
*
pH assessment of the vaginal sidewalls or fluid pool3* ultrasound examination.
Physical examination is preferred, the last two methods being used when doubt remains on diagnosis.
1.4.2 Inferred risks and medical management
At term, 95% of women with PROM are reported to deliver within 28 hours of membrane rupture [26]. For patients with preterm PROM, delivery occurs within 1 week in 55-70% of the cases [27,28]. Rapid assessment and appropriate treatment(s) are crucial.
The diagnosis of PROM is based on accurate knowledge of the associated maternal, fetal
and neonatal risks, which include:
* intrauterine infection
* umbilical cord compression * fetal ascending infection
* complications of prematurity
4.
Depending on fetal presentation and gestational age, the following medical approaches
towards management of PROM may be advocated or pursued [1]:
* expectant management
5* antibiotic treatment
* labor induction
* cesarean section.
However, numerous controversies still exist regarding the adequate treatment of PROM
in both term and preterm births, and no general management guidelines have reached con-sensus in most cases. Given the potential serious complications resulting from PROM and 4Depending on the gestational age, neonatal and postneonatal complications include respiratory distress
syndrome (due to pulmonary immaturity), intraventricular hemorrhage, neonatal death, generalized devel-opmental delay, blindness, mental retardation or physical deformation [1].
5
This usually implies bed rest along with a "watchful waiting" or close monitoring of the patient's and infant's clinical conditions (among other things, assessment of infection risks, fetal heart rate and pulmonary maturity are most often performed).
the limited array of currently available treatments, developing effective prevention
meth-ods appears to be of fundamental importance. In this perspective, a better understanding
of the different pathological, mechanical and biochemical mechanisms leading to PROM is essential.
1.4.3 Etiology
The causes leading to PROM are multifactorial and poorly understood. They may act
individually or in concert. Among them, are:
* pathological factors
* mechanical factors
* biochemical factors.
Pathological factors comprise chronic inflammation and acute infection (such as
chorioam-nionitis). They cause some local weakening of the tissue and/or the production of the
autocrine/paracrine hormones governing the activation of the myometrium responsible for
preterm labor [29]. Pathologies such as maternal placental vasculopathy have also been
shown to be a separate risk factor for preterm birth, distinct from infection [30].
PROM has also been attributed to purely mechanical factors such as membrane fatigue
under repeated uterine contractions [31] or local membrane stress concentration. Stresses
may be generated locally:
* in shear along the uterine wall from preterm contractions and/or by partial
delamina-tion of the chorionic layer from the amnion or the decidua6
* by membrane prolapse along the cervical inner canal
6Separation of amnion from choriodecidua might be integral part of the normal event sequence resulting in membrane rupture at term, as suggested by a study published this month [32].
* by abnormally high amniotic fluid pressure7.
Biochemical factors mainly refer to the enzymatic and hormonal processes resulting in
partial disruption of the ECM components, membrane weakening, and subsequent tissue
failure. Most studies available have focused on the possible correlations between collagen
content and membrane rupture. The biochemical integrity of soft tissue relies on a subtle
equilibrium between collagen synthesis and degradation troughout pregnancy. At term,
pre-ceding the onset of labor, this balance is thought to shift towards proteolytic degradation of
the collagen fibrils, resulting in decreased collagen content and membrane rupture8. Similar
explanations have been proposed for PROM, including increased collagenolytic activity, re-duced collagen synthesis, or altered collagen structure [3]. These biochemical changes might be dictated by:
* abnormal genetic expression [43,44]
* hormonal regulation [45-48]
* nutritional deficiencies [3] * local infection [49].
However, despite substantial investigation into the etiologies of PROM, no direct
corre-lation has yet been established between PROM and the mechanical and biochemical factors
succinctly reviewed in this chapter. A better understanding of the biochemical processes involved with tissue growth, remodeling and degradation is needed. Further, the compre-hension of its intrinsic mechanical behavior in relation to its biochemistry is crucial for understanding the "cascade" of microstructural mechanisms governing PROM.
The aim of this study is to characterize the mechanical response and biochemical content
of the CA membrane in vitro, through uniaxial and biaxial testing on the one hand, and
7
Hydroamnios which is a pathology characterized by excess amniotic fluid, may be associated with PROM [33,34]. The amniotic fluid pressure of women presenting hydramnios has been found to be ,40% higher than that of healthy patients [35].
8
measurements of the hydration levels, collagen and sulftated GAG contents, on the other
hand.
Chapter 2
Experiments
This chapter will focus on the experimental protocols for handling and testing of the
chorioam-nionic (CA) membrane. The membrane was tested for its mechanical and biochemical prop-erties; thickness measurements were also obtained on both the amnion and chorion layers. Two types of mechanical testing were devised and implemented: uniaxial tensile tests on
a single amnion layer (load-unload, creep, stress relaxation), and biaxial pressurized bulge
tests on chorioamnion. In addition, biochemical assays measured the hydration level, the
collagen and sulfated glycosaminoglycan (GAG) content (per dry weight of tissue), and the
collagen extractability of the fetal tissue. A histological examination of the membranes was also performed to detect any possible sign of infection.
2.1 Tissue collection and preparation
CA samples were obtained from the Tufts-New England Medical Center (Division of Maternal
Fetal Medicine, Boston, Massachusetts). Patients consenting for the study' were unlabored
women undergoing elective cesarean section at term. An approximate 20 x 20 cm2 section of
'Consent of the patient was obtained according to a protocol approved by the Institutional Review Board
at the New England Medical Center. The details of the clinical variables collected for each patient can be found in Appendix A.
Chorioamnion .
Placental disc
Umbilical cord
...
Figure 2-1: Chorioamnionic membrane and placental disc collected after delivery.
the membrane was carefully cut with surgical scissors, excluding the region of the placental disc (Figure 2-1); the specimen was then immersed in standard saline solution and kept
on ice. An approximate 2 x 5 cm2 strip was saved for histology2; the remaining part was
transferred to the laboratory, rinsed in saline and carefully cut into three 9 x 9 cm2 pieces
for uniaxial, biaxial, and biochemical testing respectively. For biaxial testing, the membrane was left intact and tested as a single chorioamnionic layer. For uniaxial tension tests and
biochemical analysis, the selected membrane pieces were separated apart into individual
amnion and chorion components by means of gentle traction (see Appendix B for details).
All testing was performed at room temperature within a few hours following delivery3.
2
The histology slides were stained hemotoxylin and eosin in the standard manner. They were then reviewed with an attending pathologist at the New England Medical Center.
3The temperature, measured for each series of testing, oscillated between 210
2.2 Uniaxial tensile test
2.2.1 Materials and methods
Following separation from chorion, the amnion sample was allowed to recover for a few
hours in saline solution4. The specimen was then cut into approximate 6 x 25 mm2 strips
using a rotary cutters. The samples were clamped between two aluminum grips, specifically
designed for soft-tissue gripping
6, and loaded vertically into a universal material testing
machine (Zwick Z2.5/TSIS, Ulm, Germany). The tissue was kept hydrated during the entire
handling process and placed in solution within a transparent fluid box during testing (Figure
2-2). Specific protocols can be found in Appendix B.
2.2.2 Measurements
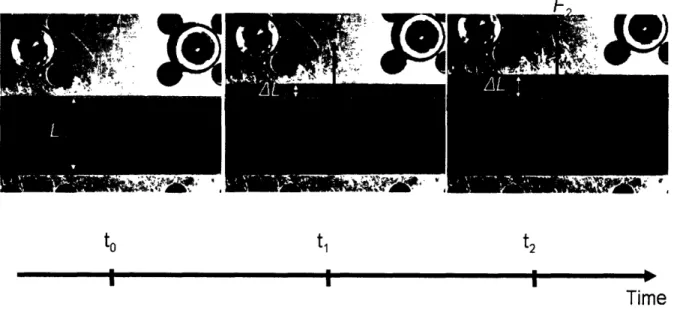
Force (F) and displacement (AL) were recorded every 100 ms along the vertical direction of stretch via a 20 N load cell; the initial gauge length (Lo) was set at 10 mm (Figure 2-3). The
tissue deformation in the transverse direction was tracked using a digital image correlation
technique (VIC-2D version 4.4.0) with a QImaging Retiga 1300 CCD camera (Figure
2-2). Images, taken every 100 ms, were automatically correlated to the corresponding tensile
"force-displacement" output from the Zwick Test Control software.
Three distinct tensile tests were performed:
* load-unload cycles
* creep
* stress relaxation
Three specimens were used per test, to get relevant statistical results for each patient.
The tests' definition is detailed hereafter for 6 mm wide samples.
4The specimen slightly stretched during the separation process was found to approximatively recover its
original shape after sitting two to three hours in solution.
5After numerous tries of different cutting tools (including scissors and cutting press), the rotary cutter
turned out to be most appropriate to ensure minimum shear stress while cutting and smooth regular edges.
Load cell
Uniaxial testing device
Fluid box
Zwick
machine
. * O··*~~~~~~,"
CelAmnion strip
Camera
Figure 2-2: Uniaxial testing apparatus.
/ I
to ti t2
I I I
Time
Figure 2-3: Force (F) and grip displacement (AL) as recorded along the vertical tensile
direction.
1 min 1 min ... .I. I... 1 min 1 min 140 180 180 200 220 240 260 280 300 320 340 380 Time (s) 380 400 0 20 40 60 80 100 120 140 160 180 200 220 240 260 280 300 320 340 360 380 400 Time (s) 4 A -I .t 1.2 -1.0 -Z- 0.8- 0.6-0.4 -0.2 -0.0 0 2 3 AL (mm) 4 5 6
Figure 2-4: Uniaxial load-unload cycle definition.
Load-unload cycles
The specimens were subjected to a set of four load-unload cycles, at a displacement rate of
0.25 mm/s, to the same 0.2 N peak force'. The recovery time between two successive cycles
was set at one minute. The specimens were finally strained to failure (Figure 2-4).
7
The 0.2N peak value corresponded to a 15-50% strain level which is within the strain range experienced
in vivo (see Section 3.5).
6 5. E 4 3. 2' 1' 0 1
z
0.2 n 0 20 40 60 80 100 120 _ . . · . · . · . · . lb. .. v I r I I -10.3-- 0.2 .0 0.25mm/s ramp 0 5 10 :5 20 25 30 35 40 45 50 55 60 Time (s)
4-E3
E , 2-/ .' 1 0 5 10 15 20 25 30 35 40 45 50 5 60 Time (s) 3.7 E 3.5 15 20 25 30 35 40 45 50 55 60 65 70 75 80 85 90 95 100 Time (s)Figure 2-5: Uniaxial creep test definition over the first 100 seconds.
Creep
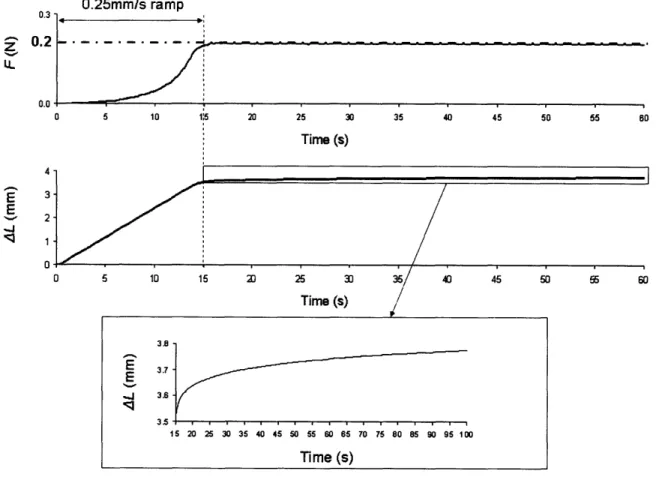
The samples were stretched up to 0.2 N at a 0.25 mm/s strain rate, followed by a 20-60
min. force holds (Figure 2-5). Unloading was then performed at the same 0.25 mm/s strain
rate and the specimens were allowed to recover for one minute before being stretched up to
failure. 8
The creep time was set at 20 minutes for the first two specimens and 60 minutes for the last one.
4
-0.25mm/s ramp /111 4 .- 3. E E 2 'J 1 ;1 0 5 10 , 15 20 0.8 0.6
Z
U 25 30 35 40 45 50 55 60 Time (s) 0 5 10 15 20 25 30 35 40 Time (s) 45 50 55 60Figure 2-6: Uniaxial stress relaxation definition over the first 100 seconds.
Stress relaxation
The specimens were loaded up to the same peak force of 0.6 N9 at a 0.25 mm/s displacement
rate, before relaxing 20 minutes for the first two tests and over 24 hours for the last one (Figure 2-6). All specimens were subsequently unloaded at a rate of 0.25 mm/s. Following
a one minute recovery time, they were finally strained up to failure.
9
Given the strong peak stress dependence of the tissue's relaxation response observed in a preliminary investigation, relaxation tests were defined starting from the same peak force and not from the same peak displacement. Relaxation responses were found to be reproducible.
0.0 I Ub I U. z 0.5 LL 0.4 10 15 20 25 30 35 40 45 50 55 60 65 70 75 80 85 90 95 100 Time (s) I v· · - · · .. . . - -- -- -- -- - - -W ·
2.2.3 Comments
The amnion is a very thin slippery membrane which grows and develops in a fluid
environ-ment. Because of its delicate nature, the tissue damages easily during handling, especially
while in contact with the grips. Therefore, its handling and loading require great care (see
Appendix B for more details). The following factors must be taken into account to obtain reliable results:
* constant hydration
* proper gripping
* adjustment of specimen at "initial configuration".
Hydrating the membrane is essential, not only to avoid tissue damage but also to prevent
the membrane from rolling upon itself. Proper gripping ensures that the specimen is correctly
placed at the grip center and perfectly aligned with the vertical direction of test. The
adjustment of the specimen at "initial configuration" is another significant concern. Making sure that the specimen is neither pre-stretched nor slack before test initiation is of crucial
importance to secure valid reproducible results. To address the issue, the bottom grip was
tightened after the specimen had been loaded into the machine (see Appendix B.3).
Finally, a technical difficulty was encountered: the load cell occasionally showed signs of
instability after three to ten hours of testing. As a consequence, stress relaxation tests over
24 hours could not always be carried out successfully'0.
l°It could never be determined with 100% certainty whether the small force fluctuations (4 mN) measured after more than three hours of testing arose from internal electronic machine problems or environmental perturbations (such as temperature variations, power fluctuations or external mechanical vibrations). The power supply and the temperature regulation were checked. The DC card of the Zwick machine was also changed. As a result, the long-term force fluctuation problem was alleviated, even though not completely sorted out.
2.3 Pressurized bulge test
2.3.1 Apparatus and methods
The apparatus designed for biaxial testing is shown in Figure 2-7. The mechanical drawings of the device parts are included in Appendix D.
The CA membrane was fastened to a 54 mm diameter hollow acrylic cylinder with an
O-Ring and stainless steel sleeve whose diameter was adjusted to tighten the membrane.
The cylinder was then immersed in saline solution within a 30 x 20 x 15 cm3 transparent
acrylic fluid box, and connected to an upper tank whose incremental raising was used to
control pressure.
The membrane was submitted to discrete pressure increases by 500-2000 Pa increments
until failure occurred. Each pressure step was held for ten minutes. The pressure level and
stability within the cylindrical cavity were tracked by a 5 psi range pressure transducer, and
the deflection of the pressurized membrane was recorded by a digital camera at a 1 Hz rate.
Further details concerning the pressurized bulge test protocol can be found in Appendix
B.2.
2.3.2 Measurements
Pressure control
The pressure level was directly controlled through the height difference between the saline
bath and the upper tank, a pressure increase Ap related to a tank lifting AH by the fluid
statics Equation 2.1
Pressuretransducer'1-
Z
ssure transducer ,
.
C 'I, R-_Wm
P
Saline solution
CA membrane
(chorion outwards)
Figure 2-7: Pictures of pressurized bulge test apparatus.
4 n nn I ,VVVu .-._ 10,000 -0A 8,000 -Q.. 6,000 -4,000 -2,000 -I. IH Connection tube
3 following 2,000Pa steps
-
CA membrane
Saline solution
1,000 Pa steps until failure 8 74 successive 500Pa steps 6
A5
2
I I I I I I I I I I I I I I I I1
0 5 10 15 20 25 30 35 40 45 50 55 60 65 70 75 80 85 90 95
Time (min)
Figure 2-8: Schematic illustration of pressurized bulge test device and protocol.
where Pwatr is the volume mass of water" at 200C (i.e. 1000 Kg.m- 3) and g, the gravity
(taken as 9.8 m.s-2).
The tank was therefore manually lifted by 5.1 cm, 10.2 cm or 20.4 cm to obtain the desired pressure increases by 500 Pa, 1000 Pa or 2000 Pa respectively (Figure 2-8). The
pressure values measured experimentally with the pressure transducer were found to be in
very good agreement with the above theoretical values'2.
l
1
The volume mass involved in reality is that of the saline solution which was approximated to that of
pure water.
12The pressure levels measured at equilibrium by the transducer deviated by less than 5% from the expected
Upper tank
U
Lp
=Pwater
g x
A
H
Fluid box I . . II
.. vThe samples, initially stress free, were first submitted to four successive 500 Pa pressure
increase steps in an effort to capture the large tissue deformation at low pressure ranges.
The next three pressure increments were set to 2000 Pa (the tissue being significantly stiffer
at higher pressure levels). Finally, the behavior of the tissue to failure was tracked through
1000 Pa pressure steps (Figure 2-8). The time needed for pressure to equilibrate after each
new pressure increase was 5-20 seconds: the pressure increments were therefore considered
as quasi-instantaneous'
3.
Deflection profile
The deflection profile tracked by the camera every second was retrieved through image analysis, using commercial software MATLAB 7.0.4. The main analyis steps are shown in Figure 2-9. The MATLAB programs written for the image analysis can be found in Appendix E. The image size was 1280 x 1024 pixels, thereby providing a camera resolution of 0.07-0.1mm (i.e. less than 1% of the deflection magnitude).
2.3.3 Comments
The handling of the tissue, even though less "tricky" than uniaxial testing specimen
han-dling, does require some careful adjustments. In particular, the following considerations are
important:
* the specimen must neither be stretched nor damaged by the ring during tightening
* no fluid pressure must be applied to the membrane before starting the test (in other
words, the fluid pressure inside the cylindrical cavity must equal that in the surrounding
bath)
* the cylinder must be properly sealed to avoid any leakage during pressurization.
X0 -woo. a) o0-111ol3 10-c 6-E 0 4-( 0 0 2, c E o-'a 0 1la I i 4xD
X (pixel)
0 100 200 300 400 500 600O Time (s)Figure 2-9: Membrane deflection profile analysis through MATLAB. Profile peak tracked as
a function of time at any given pressure step.
I I
J1
. . . .N
B
.2.4 Biochemical testing
Biochemical testing was performed on chorion and amnion separately, following a protocol developed by Myers [50]. Five biochemical data sets were obtained per membrane:
* water content
* amnion/chorion mass ratio
* collagen content (per dry tissue weight)
* collagen extractability
* sulfated proteoglycan content (per dry tissue weight)
The guidelines of the experimental procedure are shown in Figure 2-10. Further details concerning the biochemical assays are given in Appendix C.
2.5 Thickness measurement
The amnion and chorion layers were separated and cut into approximate 9 x 25 mm
2strips.
Three strips were selected per layer. The former were properly dried on lab tissue and placed
between two microplates. The thickness of the "sandwiched structure" was then measured using Fischer magnetic induction probe ETA3 providing an accuracy of 1 m. The details of the protocol can be found in Appendix B.4.
2.6 Protocol summary
CA membrane
Amnior
3Chorion
/7Extractability
N=6OH-Pro
N=5Extractability
N=6Figure 2-10: Summary of biochemical assay protocol.
GAG
N=5OH-Pro
N=5H
20
N=8GAG
N=5* N: number of samples per assay
* H
20: Water content + Amnion/Chorion mass ratio
* OH-Pro: Hydroxyproline content (from which collagen content is derived)
* Extractability: Collagen extractability (mass proportion of "strong" cross-links
relative to "weak' cross-links)
* GAG: sulfated proteoglycan content
IC7-H2(
CA membrane from hospital
CA 2
CA 3
C 1A2
C2
Thickness Measurement (N=3)Uniaxial tensile tests:
* Load-unload (N=3) * Creep (N=3) * Stress relaxation (N=3) Biochemical assays: * H20 content (N=8) * Collagen extractability (N=6)
Pressurized
bulge test
Pressurized bulge test
V/
A3
C3
Biochemical assays:
* Collagen content (N=5) * GAG content (N=5)
CA: Chorioamnion C: Chorion A: Amnion
N: number of samples per test.
Figure 2-11: Summary of the membrane protocols.
CA 1
Al1
MI-*IO,~
2~
Chapter 3
Results
The experimental results presented in this chapter were obtained from seven patients who
had an elective cesarean section at 39 weeks gestation'. The results were compared, whenever
possible, to those existing in the literature.
3.1 Histological studies
The histology slides of the fetal membranes (Figure 3-1) were reviewed at the New England Medical Center, and no histological evidence of chorioamnionitis was noted.
3.2 Membrane thickness
Table 3.1 summarizes the membrane thickness measurements obtained from the protocol
developed in this study (Appendix B.4). Because of the thin and delicate nature of the
fetal membranes, significant variations in the measurement2 were observed and an accurate
thickness assessment was difficult to obtain. However, the measurement procedure was
'The patients were unlabored. The cesarean sections were performed because either the patient declined a vaginal birth after cesarean (N=5) or a previous myomectomy was performed (N=2). The cervix was
dilated less than 1 cm in all cases. There was no clinical evidence of chorioamnionitis.
2Measurement uncertainties mainly came from: intrinsic tissue inhomogeneities (especially for the
Figure 3-1: Histological cross-sections from one typical CA specimen, showing the amnion layer (A), the chorion layer (C) with its trophoblast layer (T), and part of the decidua (D). The histological studies were performed by Dr. Michael House at the New-England Medical
Number of patients
Amnion thickness (m)Chorion thickness (m)
Measured thickness
753 28
247 I50
Halaburt et al.
[39] 460 ±3.5
318 ±34.2Oxlund et al.
[9] 647 ±4
185 ±15 Table 3.1: Amnion and chorion thickness measurements.Measured hydration Halaburt et al. Meinert et al.
[39] [14]
Number of patients 7 26 9
A water content (%) 87 ±4.2 87.5 ±2.6 86
C water content (%) 89.9 ±1 85.8 ±1 86
A/C wet mass ratio (%) 10.2 ±2.2
A/C dry mass ratio (%)
13.5
±1.7
-
-Table 3.2: Anmion and chorion hydration level and mass ratios. The mass ratios are based
on 5 patients only. No measurement uncertainty was provided by Meinert et al.
found reproducible and the results derived were consistent with those published in earlier
studies [9,39].
3.3 Biochemical testing
This section reports measurements for the hydration level, the sulfated glycosaminoglycan
and collagen contents (per dry weight), and the collagen extractability of chorion (C) and
amnion (A). Results are compared with those in the literature.
3.3.1 Water content and amnion/chorion mass ratios
The hydration level of both amnion and chorion was consistently 88% (5). These
measure-ments were in good agreement with previous results [14,39]. The amnion/chorion (A/C) dry
and wet mass ratios, which have not been assessed in the past, were also determined (Table 3.2).
Number of patients
A collagen content
(jg/mg dry weight)
C collagen content
(jig/mg dry weight)
Collagen content
7 419 +73 155 +29 [14] 2001 9 382 +23 122 ±8 .n~ [42] 2000 12 357 ±68 [41] 1997 25 525 (336-702)Table 3.3: Amnion and chorion collagen contents.
3.3.2 Sulfated glycosaminoglycan content
The average sulfated glycosaminoglycan contents of amnion and chorion were measured to
be 213 (31) p/g/mg dry tissue weight and 188 (36) g/mg dry tissue weight, respectively.
These results, however, could not be directly compared to the literature, since most previous
studies reporting measurements for the proteoglycan content of fetal membranes mainly
focused on specific families of proteoglycans or glycosaminoglycans (such as decorin, biglycan and hyaluronan), or used different characterization methods like alcian blue precipitation or
electrophoretic separation [14,51].
3.3.3 Collagen content - Collagen extractability
Several earlier studies [14,38,39,41,42] evaluated the collagen content of amnion (A), chorion
(C), and/or chorioamnion (CA), from the tissue hydroxyproline content. Results in the
literature and results obtained in this study are shown in Table 3.3. It was confirmed that
the amnion has more than twice the amount of collagen when compared to the chorion.
The collagen extractability level, defined in % as the proportion of relatively weaker crosslinked collagen fibers (see Appendix C.6 for details), was measured to be 56+8 %
for the amnion and 74 +6 % for the chorion. The significantly lower extractability level
measured for the amnion is in accordance with the substantial difference in stiffness noted experimentally between the two layers [9,52].
[39]
1989 29
336 +54 145 +38
3.4 Mechanical testing
The aim of this section is to present the main experimental results obtained from mechanical
testing and to compare them with those existing in the literature. Unlike the chorion, for
which there exist limited mechanical studies3 [9,52], the amnion layer (separated or not from
the chorionic layer) has been the focus of number of mechanical investigations. Uniaxial
tensile tests [9,52,53,63], biaxial puncture tests [54,55], and pressurized bulge tests [56-61] were among the most commonly performed tests.
3.4.1 Uniaxial tensile tests
Results
The results provided in this section are based on tests performed on membrane specimens from one representative patient (Figures 3-2, 3-3 and 3-4). For each type of test, the three experimental curves along with their average curve (which will be used in the modeling part)
are presented. The amnion thickness, used for the stress calculation, was measured to be
43.3 jAm.The viscoelastic response of the tissue was found to be strongly non linear. The average
stress relaxation and creep responses were fitted to a second order exponential decay function
of the form:
f(t) = A
le'T
+ A
2e-t2 + Yo
(3.1)
The corresponding sets of time constants associated with the creep (t
1= 35.1 s, t
2= 497.3
s) and stress relaxation (t1 = 22.3 s, t2 = 415.3 s) responses were found to be comparable
(Figures 3-5, 3-6).
3Several attempts were made, using the uniaxial tensile test apparatus, but tissue damage could hardly
-7I 6 (U 5 4 V) 1 0 1 1.1 1.2 1.3 1.4 1.5 Stretch A 1< -U.0 0.7 'M 0.6
IL
:i 0.5 0.4 U) oD 0.3 (.j) 0.2 0.1 0 1 1.1 1.2 1.3~~~~~~~~~~~~~~~~~~~~~~~~~~~~~~ 1 1.1 1.2 1.3 Stretch AIEngineering
stretch: A=L/Lo
j
Figure 3-2: Uniaxial load-unload cycles from one typical patient. The average curve is shown in red.
1 no
.
1.1
)0
minutes
is shown in red.
typical Patient
The average respoe
Figure3-3:
- I I 2. (L 2 cn
(I1,
)000
100ou
"---0Time (s)
Z.4 2.2la
0CC)
i)Time (s)
Figure
-4:
stressrelaxation
curves from oue
typical patient.
The average resPo
over the first 20 minutes is shown in
red.
r
fir \-~1.025 - 1.020-1.015 - 1.010- 1.005-
1.000-Uniaxial creep
a(
= 770 kPa Average dataExponential
fit
I I I I ' I ' I I' 0 200 400 600 800 1000 1200 Time (s)Figure 3-5: Uniaxial average creep response from one typical patient fitted to an exponential
decay function.
0 () C--; 11 I/t2) + yO Chi^2/DoF = 2.0636E-8 RA2 = 0.99842 yO 1.0232 +9.5797E-6 Al -0.00919 t0.00002 tl 35.05102 ±0.13442 A2 -0.01154 ±8.0188E-6 t2 497.25688 ±1.35087UniaXial
stress
relaxation
%=% .4 rage data Exponentlfalf 400 0 _~._~-1~ 0 A1200 600 8 OO Fi1gu e 5-6: Uxfearxiala~ege st ress ~e la~ xatio
nre spoz~se from one
tyPical patient tted to
an ~- 6 U nia $~ ~re sp one tia e c Figure nt- d unctiou
... ,,lleltial decay
2.4 2.: la(I
0) 4-I . . V--Time (s)Number of patients
ef (%)af (MPa)
Ef (MPa)
Present study
7 45.5 ±9.83.6 ±1.4
19.2 +4Helmig et al.
[52] 6 6.6 (4.2-10) 29.5 (17.1-43.3)Oyen et al.
[53] 6 38.4 ±2.735.2 ±2.1
23.1 ±6.3Table 3.4: Comparison of parameters from the uniaxial strain-to-failure curves. Stress com-putation is based on a 50 micrometer thickness.
Comparison with literature
Most previous studies focused on the uniaxial strain-to-failure response of the amnion. Under
uniaxial tension, the amnion layer exhibits the same basic force-stretch pattern as that of a
collagen fiber [62], characterized by an initial "stress-free" response followed by a significant
increase in stiffness (Figure 3-7). The average failure stress oa and strain ef values, along
with the "pseudo-linear modulus" Ef derived from a tangent fit of the stress-strain curve over the final .10% strain range (Figure 3-7) are reported in Table 3.4. These parameters, computed from the average strain-to-failure curves of the load-unload cycles from the seven
patients, agree well with published values in the literature. The average maximum failure
stress for the seven patients was below the levels reported in the literature (Table 3.4).
3.4.2 Biaxial pressurized bulge test
Deflection, area strain, and stress calculations
The membrane deflection profile, derived from the image analysis through MATLAB (see Section 2.3.2), was approximated as a half-ellipse which showed a good fit to the observed deflection (Figure 3-8). The overall bulged membrane area was then computed using
ax-ial symmetry, and its associated engineering area strain
A (A-Ao)and "equivalent"
one-dimensional stretch A were derived (Figure 3-8). 3
The average failure strain is based on the "maximum displacement" as reported by Oyen et al. and defined as the difference between the displacement at failure and that at which "the load clearly deviates from zero" (see [53] for more details). The somewhat arbitrary nature of this definition may account for the 15% discrepancy between the results of the studies.