Publisher’s version / Version de l'éditeur:
Vous avez des questions? Nous pouvons vous aider. Pour communiquer directement avec un auteur, consultez la première page de la revue dans laquelle son article a été publié afin de trouver ses coordonnées. Si vous n’arrivez pas à les repérer, communiquez avec nous à [email protected].
Questions? Contact the NRC Publications Archive team at
[email protected]. If you wish to email the authors directly, please see the first page of the publication for their contact information.
https://publications-cnrc.canada.ca/fra/droits
L’accès à ce site Web et l’utilisation de son contenu sont assujettis aux conditions présentées dans le site LISEZ CES CONDITIONS ATTENTIVEMENT AVANT D’UTILISER CE SITE WEB.
Forum Acusticum 2011: 27 June 2011, Aalborg, Denmark [Proceedings], pp. 1-6,
2011-06-27
READ THESE TERMS AND CONDITIONS CAREFULLY BEFORE USING THIS WEBSITE. https://nrc-publications.canada.ca/eng/copyright
NRC Publications Archive Record / Notice des Archives des publications du CNRC : https://nrc-publications.canada.ca/eng/view/object/?id=5a41c11f-f704-4ccd-a4bc-bbd2dc72f7db https://publications-cnrc.canada.ca/fra/voir/objet/?id=5a41c11f-f704-4ccd-a4bc-bbd2dc72f7db
NRC Publications Archive
Archives des publications du CNRC
This publication could be one of several versions: author’s original, accepted manuscript or the publisher’s version. / La version de cette publication peut être l’une des suivantes : la version prépublication de l’auteur, la version acceptée du manuscrit ou la version de l’éditeur.
Access and use of this website and the material on it are subject to the Terms and Conditions set forth at
Floor excitation with the heavy soft impact source
Schoenwald, S.; Zeitler, B.
Floor e x c it a t ion w it h t he he a vy soft im pa c t sourc e
N R C C - 5 4 0 1 2
S c h o e n w a l d , S . ; Z e i t l e r , B .
A p r i l 2 0 1 1
A version of this document is published in / Une version de ce document se trouve dans:
Forum Acusticum 2011, Aalborg, Denmark, June-27-July 1, 2011, pp. 1-6
http://www.nrc-cnrc.gc.ca/irc
The material in this document is covered by the provisions of the Copyright Act, by Canadian laws, policies, regulations and international agreements. Such provisions serve to identify the information source and, in specific instances, to prohibit reproduction of materials without written permission. For more information visit http://laws.justice.gc.ca/en/showtdm/cs/C-42
Les renseignements dans ce document sont protégés par la Loi sur le droit d'auteur, par les lois, les politiques et les règlements du Canada et des accords internationaux. Ces dispositions permettent d'identifier la source de l'information et, dans certains cas, d'interdire la copie de documents sans permission écrite. Pour obtenir de plus amples renseignements : http://lois.justice.gc.ca/fr/showtdm/cs/C-42
Floor Excitation with the Heavy Soft Impact
Source
Stefan Schoenwald Berndt Zeitler
Institute of Research in Construction, National Research Council, Ottawa, Canada
Summary
Low frequency impact sound is one of the most common reasons for complaints by building occupants. Therefore, some countries, Japan and Korea, have introduced heavy soft impact sources into their standards – the “tire” and the “rubber ball” - that effectively excite low frequency sound. Both are dropped from a specified height on the floor under test. Although the ball was introduced more recently, it seems to be more accepted by engineers in the field because of the ease of handling. In previous studies, to better understand the floor excitation by the ball, a simple analytical model that does not account for modal ball deflection was applied to predict its blocked force. Good agreement between prediction and measurement was found in the low frequency range, however, the analytical model grossly underestimated the blocked force in the mid and high frequency range. In this paper the finite element method is applied to predict the modal deformation of the ball during impact on the floor. The results of this numerical study helps to better understand discrepancies found in earlier publications between the analytic ball model and measurement. Conclusions for the improvement of the analytical model are finally drawn.
PACS no. 43.55.Nn, 43.40.Nn
1. Introduction1
Complaints about low frequency impact sound– often generated by children jumping – is a major source of complaint in residential multi-family buildings. Heavy impact sources that effectively excite low frequency sound – the tire (or “Bang-Machine”) and the rubber ball – are defined in the Japanese (JIS A 1418-2) and the Korean (KS F 2810-2) measurement standards. Both sources are dropped from a specified height onto the floor under test and the maximum Fast-weighted sound pressure level of the generated noise impulse is measured in an adjacent receiving room. The “Bang-machine” is the original heavy impact source and provisions in the Korean building code and Japanese quality indication system limit the maximum acceptable sound pressure level caused by this source.
However, forces exerted on the floor by the intense tire impact are much greater than by people walking or children jumping. As an alternative heavy soft impact source, Tachibana [1] developed the rubber ball for which the magnitude of force agrees better with that expected by walkers. The ease of its use made it very popular in Japan even
1(c) European Acoustics Association
leading to recognition in Annex F of ISO 10140-5:2010.
Whereas the sound insulation of heavy monolithic building structures can be predicted for quasi-stationary sources, like ISO-tapping machine or airborne sound, with the statistical energy analysis (SEA) based ISO 15712 or EN 12354-model respectively, no such model exists for sound impulses generated by the heavy impact sources. The closest would be transient SEA, but significant research would be required to investigate its applicability for heavy impact sources and building structures. Regardless of the prediction method the blocked force exerted by the heavy sources has to be known and related to sound power injected into the floor.
Recently, Park et al. [2] introduced a modal based model for the blocked force exerted by the rubber ball that required measured modal properties as input data. In this paper an analytical model from Hubbard et al. [3] that requires only material properties and ball geometry as input data is briefly reviewed. The finite element method (FEM) is used to explain discrepancies between predicted and measured results found in an earlier publication [4].
2. Analytical Prediction Model
The analytical model is based on the elastic deformation of a hollow sphere. Hubbard et al. [3]
FORUM ACUSTICUM 2011 Schoenwald, Zeitler: Floor Excitation with the Heavy Soft Impact Source 27. June - 1. July, Aalborg
used it to investigate the impact of table tennis balls and pointed out that their prediction model delivers even better results for tennis balls with a thinness ratio R/h (radius, R divided by the wall thickness, h) of around 5, which is closer to the thinness ratio of the “rubber ball” source (R/h ≈ 3) than of the table tennis balls (R/h ≈ 47).
In this paper the model with its basic equations and assumptions is only briefly reviewed, a detailed description of the model is given elsewhere [5].
2.1. Impact of rubber ball
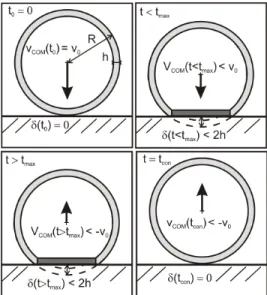
An elastic hollow sphere deforms during impact on a rigid surface and following deformation is assumed in Hubbard’s model. At time t = 0, the shell approaches the surface in the z-direction normal to the x-y-plane of the surface, with the uniform centre of mass velocity vCOM(t0). Directly
after initial contact at t < tmax (tmax is time of
maximum deflection), the part of the shell that is in contact with the rigid structure flattens and remains in contact with the surface. This flattened cap, the dark grey part in Figure 1, has no velocity and is at rest, whereas the remaining undeformed part, shown in light gray in Figure 1, moves uniformly with reduced velocity, vCOM(t<tmax). At
maximal shell deflection max, at t = tmax the whole
shell is at rest and has zero velocity (vCOM(tmax) = 0). All kinetic energy is transformed
into elastic (potential) energy and stored in the deformed shell. The whole process reverses during the restitution phase as shown in the bottom two pictures of Figure 1.
Figure 1. Ball deformation in analytical model The deformed shell accelerates and moves in opposite direction. Elastic energy is transformed back into kinetic energy and the centre of mass velocity increases with time - the undeformed shell rebounds from the surface with a uniform rebound
velocity that is of opposite sign, however, smaller than the initial impact velocity v0. The duration of
the impact is inversely proportional to the impact velocity v0, and the shell stiffness, i.e. the contact
time tcon, of a fast object or stiff shell at impact is
much shorter than of a slow and/or soft one. The described deformation is only valid for small deflections for which the lower part of the shell that is at rest does not buckle and snap through into the interior. For drop heights of the rubber ball investigated in the paper the small deflection constraints are met. In this model the modal deformations of the body are omitted also, since the body is assumed to move with a uniform centre of mass velocity.
2.2. Forces and equation of motion
The predicted total contact force FT is the sum of
the elastic force FB related to the shell stiffness and
the much smaller gas force FG related to the
increase of internal pressure due to the shell deflection during impact. Both force components are defined below.
, (1)
! " !# $ %# $ %&'! ( ) !# $ , (2)
Both components depend on the ball
deflection (t) and the ball radius R. FB is further
a function of wall thickness h, modulus of Elasticity E, and Poisson’s ratio of the shell material. FG assumes that the shell does not
expand radially during impact. A little hole in the rubber ball ensures that the initial internal pressure in the shell is equal to the atmospheric pressure pa
and hence the gas pressure pg is zero. The ratio of
specific heats is 1.4 for air.
Relationships between kinetic and elastic energy and conservation of momentum during impact, assuming no irreversible losses due to conversion of energy to heat, lead to the equation of motion.
* !%,+- . & -/ . !%,+-0% . 1 -0 . !23 . ! 24 . , "
Equation 3 is function of the total ball mass M, the deflection of the ball, and of its first and second order time derivatives, 0 and /, which are the centre of mass velocity vCOM and acceleration of
the ball respectively. 1 -0 . is the Heaviside function which is zero during the restitution phase (-0 . 7 and unity during compression phase
FORUM ACUSTICUM 2011 Schoenwald, Zeitler: Floor Excitation with the Heavy Soft Impact Source 27. June - 1. July, Aalborg
2.3. Solving equation of motion
At t0=0 when the ball touches the surface two
initial conditions are known, namely the ball deflection =0 and the centre of mass velocity v0
as function of ball drop height hD and gravity
constant g.
89 7 09 7 ):;<, (4)
Thus, after some simple manipulations the equation of motion is solved as an initial value problem using a commercial software package. As input data the geometry (R = 89 mm, h = 32 mm) and the total mass (M = 2.5 kg) of the ball according to JIS A 1418-2:2000 and literature values for material properties (E = 1.6 N/mm2, = 0.5) are used. The resulting ball deflection, obtained at discrete time samples with a sampling rate of 44.1 kHz, is used to calculate the ball force with Equations 1 & 2.
3. Measurement vs. Prediction
A standard “rubber ball” impact source (Type YI-01, Rion) was dropped on a force plate (Impulse-Force-Transducer PF-10, Rion) resting on a rigid heavy concrete slab. Using a rectangular time window, a signal of 1 s length containing the whole blocked force impulse of the ball impact was measured with an A/D-data acquisition card (sampling rate 44.1 kHz) connected to a standard desktop computer. The measured signal was low pass filtered with a band edge frequency of 1.25 kHz to remove force components resulting from the first eigenmodes of the aluminum force plate (calculated to be around 1.6 kHz). Five ball drops were measured for the same drop height and averaged in the frequency domain.
3.1. Comparison of results
Time histories of measured and predicted blocked force are shown in Figure 2 for the standard drop height of 1 m and additionally for 10 cm and 1.60 m. The peak force, contact time, and general trend shown are similar for measurement and prediction. However, the predicted time histories have an almost symmetrical parabolic shape, whereas the measured have a much steeper initial slope and show a distinct oscillating pattern. For 1 m standard drop height the impact time for both prediction (20.8 ms) and measurement (19.6 ms), fulfill the requirements (20 ms ± 2 ms) for heavy soft impact sources in JIS A 1418-2:2000. Further requirements are given for the spectrum of the force exposure level LFE. The force exposure level
is determined similarly to the sound exposure level, where the energy of a transient noise event is converted into a sound level equivalent to a
steady-state noise with duration of 1 s. LFE was
calculated according to JIS A 1418-2:2000 from measured and predicted instantaneous force using a Fast Fourier Transform.
Figure 2. Time history of measured and predicted blocked ball force
In Figure 3 LFE is shown for the prediction and
measurement of the ball dropped at the 1 m standard drop height. Prediction and measurement agree very well in the 31.5 Hz and 63 Hz octave bands, but although the measured LFE fulfills the
standard requirements in the remaining frequency range also, the prediction delivers levels below the JIS required limits.
Figure 3. Measured and predicted force exposure levels LFE for 1 m standard drop height
4. Analysis of Discrepancy
The discrepancies in the shape of measured and predicted instantaneous force and the in force exposure level are assumed to be caused by elastic modes of the ball that are excited during impact [5] and are omitted in the simple analytical model since it was assumed that the shell of the ball moves with uniform centre of mass velocity vCOM.
FORUM ACUSTICUM 2011 Schoenwald, Zeitler: Floor Excitation with the Heavy Soft Impact Source 27. June - 1. July, Aalborg
4.1. Free elastic ball modes
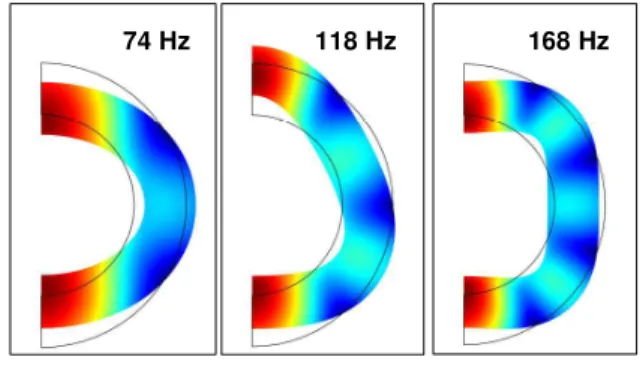
To investigate this hypothesis further, a commercial FEM-software package was used to calculate the eigenfrequencies and mode shapes of the free elastic modes of the ball. For axial symmetric bodies, like the rubber ball, computational effort can be minimized by reducing the object to only a half a ball cross-section as presented in the following figures.
Figure 4. FEM-model of free elastic ball modes where the colour describes displacement relative to initial ball shape.
The first three free mode shapes of the ball are shown in Figure 4 with eigenfrequencies at 74 Hz, 118 Hz, and 168 Hz all situated in the frequency range where the discrepancies between prediction and measurement begin.
However, it must be further investigated if the modes are also excited during ball impact and how mode shapes and associated eigenfrequencies change due to the pressure load during impact. Park et al. [2] investigated the ball impact with high speed camera and a modal analysis suggested that the first elastic mode has its eigenfrequency at 24 Hz and the second at 89 Hz. The shape of Park’s first elastic mode at 24 Hz is similar to the ball deformation shown in Figure 1. The mismatch in the eigenfrequency of Park’s second mode and the free elastic mode shown above is likely due to the pressure load that acts on the body during impact in the experiment and is neglected in this free body FEM prediction.
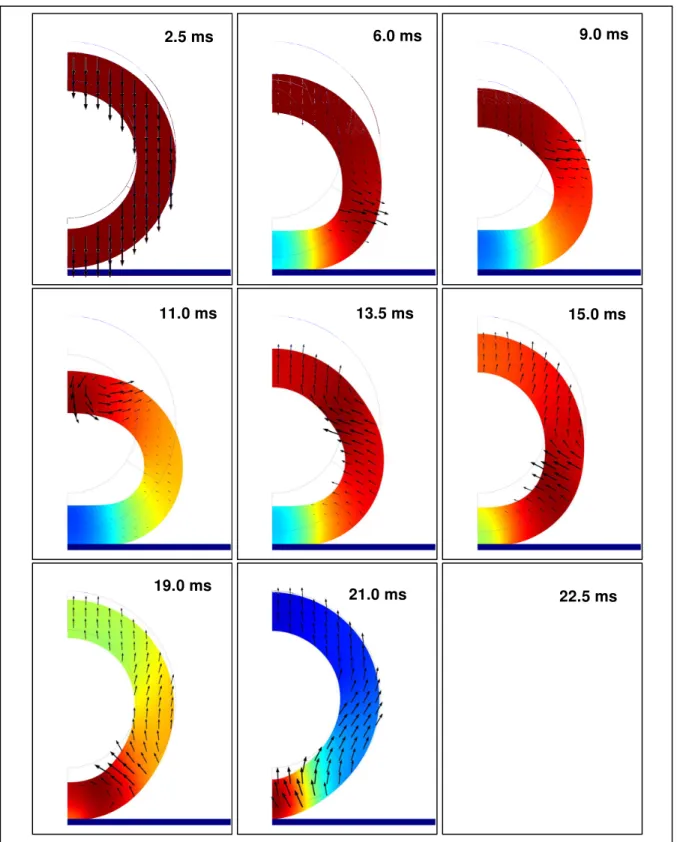
4.2. Time transient FEM impact model To investigate the ball deformation during impact a new time-transient FEM model was set up. Some preliminary results are presented and discussed in the following section. In the following FEM model, the ball impacts a rigid immobile surface with the initial velocity v0
resulting from a 1 m drop height. For the ball-surface contact a simple contact model is used. The deformation of the shell during and shortly after impact are shown for 9 discrete time steps in Figure 5. The color map indicates the resultant
total displacement of the grid nodes relative to the undeformed body and the vectors show their velocity. The vector length is scaled proportional to the magnitude of the velocity field.
At t = 2.5 ms the undeformed ball reaches the rigid floor surface with uniform velocity. During the compression phase t < 11.0 ms the ball is decelerated. The velocity and total displacement of the upper section of the ball begin uniform, shown by the parallel vectors still pointing downwards, whereas the lower section deforms immediately, shown by the vectors pointing away from the symmetry axis. At around t = 11 ms, the transition between compression and restitution phase, a deformation of the upper part of the shell is also visible resembling the elastic mode at 74 Hz in Figure 4. However, it is also evident that the lower ball surface is in contact with the rigid body. This part of the rubber ball does not buckle and snap through into the interior to minimize its strain energy of deformation as described by Hubbard et al. [4] for moderately large deformations of table tennis balls.
During restitution phase (t > 11 ms) the ball accelerates again and the vectors are of different magnitude and direction in both the lower and upper section of the ball. In some regions they point towards the symmetry axis whereas in other they point away, meaning all parts of the ball are moving relative to the undeformed ball (also seen in the colored displacement map). This trend continues even after the ball has bounced back and is not in contact with the surface anymore.
4.1. Discussion
Hence, the time transient FEM model supports the assumption that ball modes are excited during impact and cause the discrepancy between predicted and measured results. In the frequency domain predicted and measured results agree well in the octave bands below the eigenfrequencies associated with the free elastic modes of the ball. The oscillations in the measured time histories as well as their asymmetric shape can be attributed to the modes. The steeper initial slope of the contact force or deflection is typical for impact by partially elastic bodies with energy loss and without permanent deformation [6]. During impact some of the initial kinetic energy is lost due to material damping or due to wave propagation in the partially elastic body itself. Only the remaining part is transformed into elastic potential energy during compression and later transferred back into the final translatoric kinetic energy of the shell.
FORUM ACUSTICUM 2011 Schoenwald, Zeitler: Floor Excitation with the Heavy Soft Impact Source 27. June - 1. July, Aalborg
Figure 5. Transient FEM model – impact of rubber ball on rigid surface (color map: ball displacement relative to the undeformed body; vectors: ball velocity)
2.5 ms 11.0 ms 19.0 ms 22.5 ms 21.0 ms 13.5 ms 15.0 ms 6.0 ms 9.0 ms
FORUM ACUSTICUM 2011 Schoenwald, Zeitler: Floor Excitation with the Heavy Soft Impact Source 27. June - 1. July, Aalborg
Because of these energy losses, the acceleration of the impacting body during restitution phase is less than the deceleration during compression phase. This results in the asymmetric shape of the force history. The period of the mode at 70 Hz is, 13.5 ms and is shorter than the total contact time of approximately 20 ms, meaning that the mode can be excited during impact. Furthermore, the periods of the higher order elastic modes of the rubber ball source are still shorter; hence the associated waves travel several times through the sphere during impact, which causes the distinct oscillating behavior of the measured force. However, these are only preliminary results of the transient FEM-model and further analysis, e.g. modal analysis is planned. Also the contact forces and the ball impedance during impact will be further investigated.
5. Summary and Conclusions
An earlier study of a simple analytical model for predicting the blocked force of the Japanese rubber ball impact source was briefly reviewed. The great advantages of this analytical prediction model are that only a limited set of well-known input data are required ( i.e. geometry and material properties) and despite this simplicity it provides a better understanding of the behavior of the ball during impact. Measurements were carried out to validate the prediction model. Good agreement was found for the maximal impact force and the contact time in the time domain. However, these two quantities do not sufficiently characterize the “rubber ball” source, because in the frequency domain prediction and measurement only agree well in the 31.5 Hz and 63 Hz octave bands. In order to help understand the discrepancies between predicted and measured results in the frequency range above 63 Hz, a finite element model (FEM) was applied to the problem. Preliminary FEM results support earlier assumptions that the discrepancies are due to omitted Ball modes in the simple analytical model. In the future, the applied FEM models will be further exploited and used to investigate possibilities to improve the simple analytical prediction model.
References
[1] H. Tachibana et al., “Development of new heavy and soft impact source for the assessment of floor impact sound insulation of buildings”, Proceedings of INTERNOISE 98, Christchurch, New Zealand, 1998. [2] B. Park et al., “Force generation characteristics of
standard heavyweight impact sources used in the sound generation of building floors”, Journal of the Acoustical Society of America, 128 (6), 2010.
[3] M. Hubbard et al., “Bounce of hollow balls on flat surfaces”, Sports Engineering, Vol. 4, 2001.
[4] S. Schoenwald et al., “Excitation of wood joist floors with the standard rubber ball”, Proceedings of Internoise 2009, Ottawa, Canada, 2009
[5] S. Schoenwald et al., “Prediction of the blocked force at impact of Japanese rubber ball source”, accepted for publication at Acta Acustica
[6] G. Gilardi et al., “Literature survey of contact dynamics modeling”, Mechanism and Machine Theory, Vol. 37, 2002