AN ASSESSMENT OF FOREIGN INVESTORS IN THE WASHINGTON, D.C. REAL ESTATE MARKET
by
S. JOHN HODGE
B.A., Accounting (1977) M.B.A., Finance (1979) University of Texas - Austin
and
S. KENT ROBERTS
B.S., Engineering Management (1969) Missouri School of Mines - Rolla
Submitted to the Schools of
Urban Studies and Planning & Architecture in partial fulfillment of
the requirements for the Degree of
Master of Science in Real Estate Development at the
Massachusetts Institute of Technology September 1987
S. John Hodge & S. Kent Roberts - 1987 The authors hereby grant to MIT
permission to reproduce and to distribute copies of this thesis document in whole or in part.
Signatures of the authors
S. John odge Department of Urban Sjdies and Planning
-
//.A
l)31, 1987 S. Kent Roberts Department of Architecture /'--)July 31, 1987 Certified by Lawrence S. Bacow Associate Professor, Urban Studies and PlanningThesis Supervisor Accepted by
Michael Wheeler Chairman Interdepartmental Degree Program in Real Estate Development
S AC EINSTUE QF ECNftOLOGY
ACKNOWLEDGMENTS
This thesis is the effort of two students who had no prior experience in international real estate investment or in the Washington, D.C. market place. The time allotted for our re-search was limited to two months. During this time we not only made field trips to Washington, D.C. but we also com-pleted an exhaustive study of the international aspects of real estate investment and capital flows.
Given these limitations, interviews were of critical import-ance. We wish to thank the more than 50 individuals who shared their time and knowledge with us. We wish to give special thanks to the National Association of Realtors (NAR) who sponsored our thesis as part of a broader study examining foreign investment patterns in the United States. In par-ticular we want to thank Mariam Meyer, Manager - Inter-national Operations of the NAR, Fred Flick, Director of Economic Research and Sean Burns, Economist for the personal time and assistance they gave us. Our special gratitude goes to Rusty Lindner, Managing Director of Bear Saint Properties for providing us with an office and secretarial services while we were in Washington, D.C. Without this assistance our work would have been much more difficult. We cannot conclude these acknowledgments without giving a special thanks to Professor Lawrence S. Bacow, M.I.T. He has truly been a guiding light.
AN ASSESSMENT OF FOREIGN INVESTORS IN THE WASHINGTON, D.C. REAL ESTATE MARKET
by
S. JOHN HODGE and S. KENT ROBERTS
Submitted to the School of Urban Studies and Planning and to the School of Architecture in partial fulfillment
of the requirements for the Degree of Master of Science in Real Estate Development
ABSTRACT
Our research represents one part of a _ joint study by the National Association of Realtors and the Massachusetts Institute of Technology Center For Real Estate Development. The purpose of the study was to examine foreign investment patterns in U.S. real estate by analyzing investment activity in three cities: Washington D.C., Los Angeles, and Chicago. This thesis is focused on Washington, D.C. Many of our con-clusions have been supplemented by the findings in other parts of the joint study. (See Notes [183 & [193)
Central to our research is the question "Do foreign investors in U.S. real estate differ from their American counter-parts?" Our significant findings include the following: foreigners view United States real estate as a "capital haven"; foreigners are "long-term" investors in U.S. real es-tate; foreign investors will accept lower returns under cer-tain conditions (they are only interested in very high qual-ity well located properties); exchange rates are important in the investment decision (favorable rates are a buy signal but unfavorable rates are a hold signal); foreign investors have strong location preferences; foreigners are "predisposed" to invest in real estate; foreign investors are relationship oriented; foreign investors are cash buyers; as foreign in-vestors become more familiar with the U.S. market, they act more like U.S. investors.
In conclusion we believe that an increasing foreign presence in the U.S. marketplace will present great opportunities for all kinds of U.S. real estate players.
Thesis Supervisor: Lawrence S. Bacow Title: Associate Professor,
TABLE OF CONTENTS
Acknowledgments ... 2
Abstract ... 3
CHAPTER 1 - Foreign Investment in the United States ... 5
CHAPTER 2 - The Washington, D.C. Market: An Overview ... 12
CHAPTER 3 - Foreign Investment and the Washington, D.C. Real Estate Market ... ... 27
CHAPTER 4 - Profiles of Investors ... 35
CHAPTER 5 - The Foreign Investor's Strategy for Investing in United States Real Estate ... 40
CHAPTER 6 - Significant Findings and Implications ... 44
APPENDIX A - Washington, D.C. Properties Involving Foreign Investors ... ... 51
CHAPTER 1
FOREIGN INVESTMENT IN THE UNITED STATES
INTRODUCTION
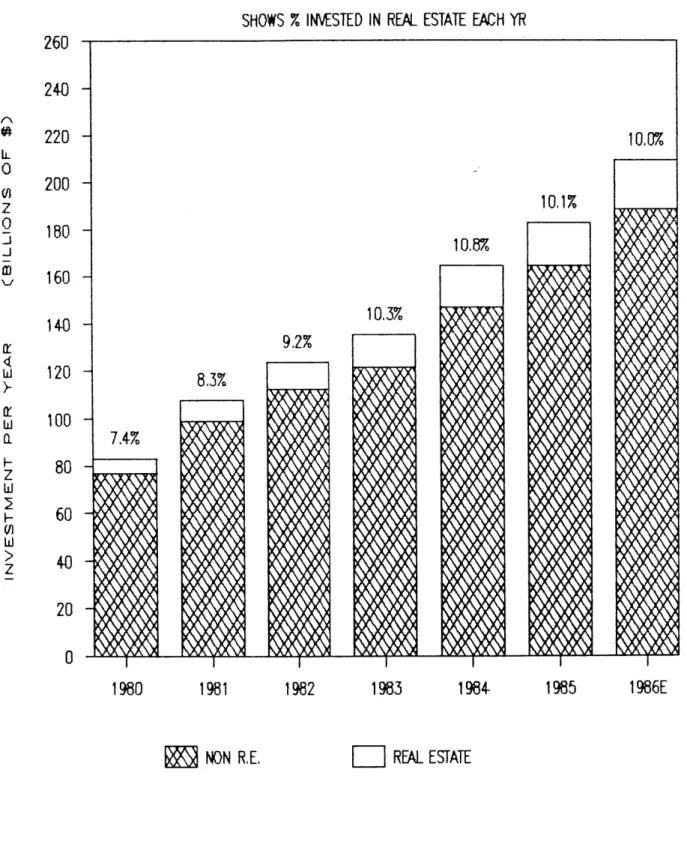
Much publicity has been given to the recent surge of foreign investment in the United States. For 1986, total foreign investment in U.S. securities, businesses and real estate increased 13.4% to $209 billion. [1] Approximately $21 billion of this amount was invested in developed real estate. On average over the last eight years, foreign investors have introduced $10 billion of new money to the U.S. market annually. [2] (See Figure 1-1.)
The appeal of the United States as a destination for foreign capital has been attributed to several factors.
* The balance of trade deficit in the U.S. has shifted the economy from a net supplier of investment capital to a net importer of capital. [5 The United States is currently the largest debtor nation in the world and seems to have an insatiable appetite for money. [63
* The U.S. is perceived as being a politically stable country and one of the strongest remaining bastions of free enterprise. [7] & [83
* Recent depreciation of the dollar vis-a-vis other currencies has produced what seem like great bargains to foreign buyers of U.S. assets. [6)
FIGURE 1-1. TOTAL FOREIGN DIRECT INVESTMENT IN THE UNITED STATES
SHOWS % INVSTED IN REAL ESTATE EACH YR
260
24-0
220
200
180
160
140
120
100
80
60
40
20
0
1980
1981
1982
1983
1984-
1985
NON R.E.
K]
REAL ESTATE
SOURCE: Real Estate Review [3]
IL 0
z
0ix
4z
1986E
FIGURE 1-1.* Nominal interest rates are higher in the U.S. than in some foreign countries; accordingly, investors from these countries can obtain higher current returns here. This is especially significant if dollar denominated investments are financed with the foreign currency. E63
* The Japanese government has recently relaxed limits on foreign investment. [93
Many observers predict further increases in foreign
investment in the U.S. as:
(1) investment opportunities in the U.S. remain attractive relative to other investments;
(2) pressure for reinvestment in the U.S. continues to build in Japan, due to the growing Japanese export surplus; the Japanese have been one of the most active investors in the U.S. for the past several years; [103
(3) foreign investors become more knowledgeable and comfortable with U.S. markets, and;
(4) the number of participants in the market continues to increase. E113
Indeed, foreigners are heavy buyers of U.S. Treasury bonds and corporate stocks; additionally, there continues to be strong interest in direct foreign investment in the U.S. in-cluding the establishment of manufacturing plants, mergers and acquisitions, and the purchase of real estate.
Especially interesting is the foreign investor's attraction to U.S. real estate. Since the late 1970's, foreigners have invested large amounts of capital into U.S. properties.
While current foreign ownership represents only- about 1% of the total value of developed real estate in the U.S., it is noteworthy that in the few markets in which foreigners have a presence, their activity has had a significant impact on
values. [63
U.S. real estate is appealing to the foreigner for several reasons. First, it provides diversification benefits to the foreign investment portfolio. Should inflation rekindle, real estate would provide a hedge, thereby reducing the volatility of the overall portfolio. Second, current yields on investment grade office buildings in many countries are very low relative to comparable yields in - the U.S. Additionally, foreign investors typically do not sell local real estate. In contrast, U.S. real estate is perceived to be accessible, liquid, and inexpensive. Third, tax reform has reduced competition from U.S. tax shelter oriented investors. [123
The majority of foreign equity investment in U.S. real estate has come from pension funds, and insurance, construction and real estate companies. These investors have shown a pref-erence for high quality office buildings in large American cities such as New York, Washington, D.C., Boston and Los Angeles. This can be explained by the foreigner's desire to invest in stable and familiar markets. The interest in downtown office properties over suburban locations reflects the foreigner's lack of familiarity with large-scale suburban office development. Shopping centers and multifamily housing tend to be avoided, largely due to a more intensive management requirements. [133
Many questions are currently circulating about the future of foreign investment in U.S. real estate. Will money continue to pour in? If so, how will the deals be structured? How
sensitive are foreigners to fluctuations in exchange rates? What property type and geographic preferences do foreigners exhibit? Do the foreigners pay more for U.S. real estate than their American counterparts? And, what opportunities are available for U.S. real estate professionals to establish relationships with foreign investors?
The common assumption underlying the above questions is that foreign real estate investors differ from their U.S. count-erparts. But little research has been done to corroborate this. By better understanding the nature of the foreign investor, the U.S. real estate professional will be more effective in serving this important segment of the market.
RESEARCH OBJECTIVE AND METHODOLOGY
The purpose of this paper is to explore the differences between foreign investors in U.S. real estate and their American counterparts. The research addresses this issue by analyzing foreign real estate investment in Washington, D.C.
This paper represents one part of a joint study conducted by the National Association of Realtors and the Massachusetts Institute of Technology Center For Real Estate Development. The purpose of the study was to examine foreign investment patterns in U.S. real estate by analyzing investment activity in three cities; Los Angeles, Chicago, and Washington, D.C. These cities were selected based on their geographical dispersion and their popularity as destinations for foreign investment.
The research was organized in three stages. First, a literature search was performed to gain an understanding of the overall context of foreign investment and the Washington,
D.C. market. Second, an attempt was made to determine the universe of foreign owned real estate in Washington, D.C. To our knowledge, this has never been done. We started by contacting the brokers, lawyers and investors we already knew. We asked them to give us the names of others they felt were key players in the D.C. market place and/or had first hand knowledge of local foreign investment. Each contact led us to other contacts and the network expanded until we had
about fifty names. At this point we began to get
convergence. That is, we reached the point when continued searching only turned up the same names we had already acquired. We then began to concentrate on interviewing the key players in foreign owned deals. We focused on obtaining insight into the specifics of the transaction and the motivations of the various parties involved. Lastly, the data was organized and analyzed.
LIMITATIONS
It is important that the reader understand the limitations of this study. The nature of the real estate business is such that research can often be a difficult and frustrating pro-cess. The business is transaction oriented and information about specific deals is proprietary and difficult to come by. This is compounded by the fact that foreign investors tend to be secretive about their activities.
While we have endeavored to be accurate, our attempt to identify the universe of foreign owned real estate in Washington is subject to the error of omission. Also, our data is subject to bias to the extent that we have not interviewed a "representative" sample of foreign investors. No attempt was made to statistically verify our work.
ORGANIZATION
Chapters 1, 2, and 3 of this paper describe the historical context of foreign real estate investment in the United States and in Washington, D.C. Chapters 4 and 5 profiles the foreign investors involved in the Washington market and de-scribes how they differ from the American investor. Finally, Chapter 6 provides a summary of our findings and evaluates the implications.
CHAPTER 2
THE WASHINGTON, D.C. MARKET: AN OVERVIEW
The official Washington, D.C. MSA (Metropolitan Statistical Area) consists of the District of Colombia, five Maryland counties and five Virginia counties. The majority of for-eign investment has been concentrated in five of these jurisdictions which comprise over 80% of the population and employment of the MSA: the District, and Arlington, Fairfax, Montgomery, and Prince George's counties. These five markets provide the focus for this chapter. (See Figure 2-1.)
HISTORICAL CONTEXT
The District of Columbia owes much of its appearance to the French architect and engineer Pierre L'Enfant. L'Enfant's 1790 city plan calls for long diagonal vistas cut across the usual 90 degree angle blocks and streets, and circular rotaries to provide reference points within the diagonal vistas. The scheme extended even to the width of the avenues, which were planned to be 160 to 400 feet wide. Although the Capitol is the center of the historic plan, most of the commercial and residential activity is in the Northwest quadrant of the District, and in the adjacent
counties. The Capitol Hill area consists mostly of
government and institutional uses. E143
Unlike most major markets, Washington, D.C. consists primarily of low-rise (8-12 story) buildings. Strict height
WASHINGTON, D.C. MSA (METROPOLITIAN STATISTICAL AREA)
MONTGOMERY, MD
FAIRFAX, VA
PRINCE GEORGE'S, MD
SOURCE: Rand McNally, Inc. FIGURE 2-1.
visibility of the Washington Monument and the Capitol Building. These restrictions limit the height (exclusive of penthouse) of most buildings to 90 feet; within a relatively small area (less than two square miles) structures of 130 feet are allowed, while buildings along Pennsylvania Avenue, under certain circumstances, reach 160 feet. Applicable FAR's (floor area ratios) within the central business dis-trict range from 6.5 to 10. These restrictions force de-velopers to build to the lot line and straight-up in order to maximize square footage. Clearly, these zoning restrictions limit future development in the District. [153
L'Enfant's layout in combination with the city's-zoning re-strictions, gives the District much architectural appeal. Europeans find the city's ambiance and human scale rem-iniscent of many of the older European capitals, while the Japanese identify with its low-rise scale. This, along with the international recognition of Washington, gives the for-eigner a better understanding of the city, relative to other U.S. cities.
THE ECONOMY
Historical Growth:
Prior to the first half of the 20th century, life in Wash-ington more closely resembled that of a Western frontier town, than a stately capital. Beyond the governing of the nation, there was a general lack of activity in the city. The District was surrounded by small farms and plantations and there was little commerce or industry. Any growth that occurred was usually the result of government spending. [143
a major surge in federal employment and created a large, permanent bureaucracy of lobbyists, associations, and support groups. The majority of the employment growth occurred in the District, but the new bureaucracy frequently chose to live in the adjacent suburbs. [143
Beginning in the 1960's, another increase in federal spending had a significant impact on expansion. This time, growth oc-curred in the suburbs, which fostered the development of major suburban business centers. Suburban employment in-creased from 33 percent of metropolitan employment in 1960, to 52 percent in 1970. Growth initially occurred in the close-in suburbs of Virginia and Maryland; however, with the 1964 completion of the Capital Beltway, growth spilled into much wider areas of Montgomery, Fairfax and Prince George's counties. The District saw a sustained decline in population and employment growth. This pattern was consistent with the city's overall plan to decentralize government employment and
direct growth toward major suburban transportation
corridors. [133
The 1970's and early 1980's characterized the area's economy. Government employment pand; however, the largest growth occurred and "high technology" sectors. Existing growing rapidly, and there was a very high ness formation and corporate in-migration. this growth occurred in the Maryland and markets. E163
another change in continued to ex-in the "services" businesses began rate of new
busi-The majority of Virginia suburban
Recent Trends: Population and Income
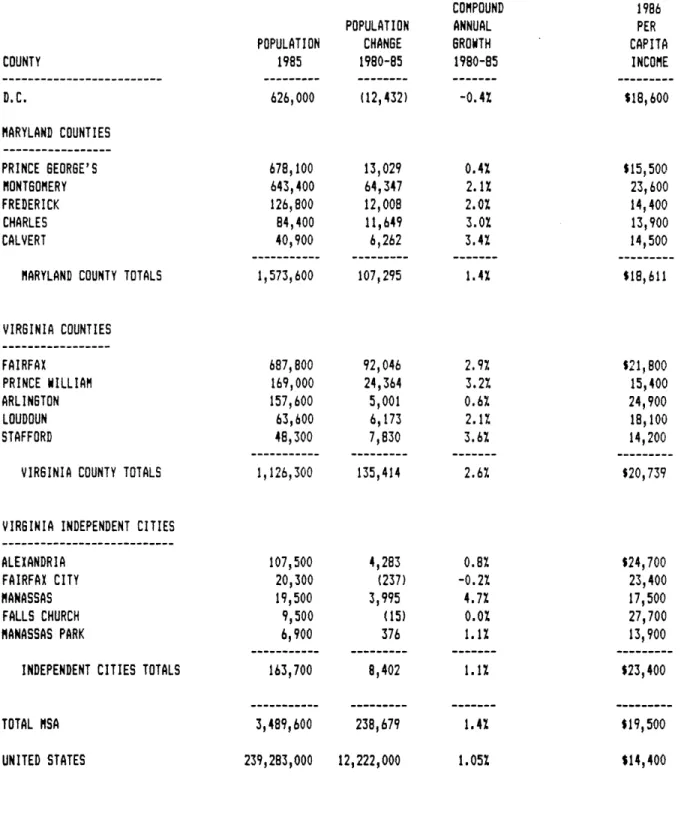
The Washington MSA population has grown by about 1.4% since 1980 to almost 3.5 million today. While the growth rate has
FIGURE 2-2. WASHINGTON, D.C. NSA DEMOGRAPHICS, 1980-1986
COMPOUND 1986
POPULATION ANNUAL PER POPULATION CHANGE GROWTH CAPITA
COUNTY 1985 1980-85 1980-85 INCOME D.C. 626,000 (12,432) -0.47 $18,600 MARYLAND COUNTIES PRINCE GEORGE'S 678,100 13,029 0.4% $15,500 MONTGOMERY 643,400 64,347 2.1% 23,600 FREDERICK 126,800 12,008 2.0% 14,400 CHARLES 84,400 11,649 3.0% 13,900 CALVERT 40,900 6,262 3.4% 14,500
MARYLAND COUNTY TOTALS 1,573,600 107,295 1.4% $18,611
VIRGINIA COUNTIES FAIRFAX 687,800 92,046 2.9% $21,800 PRINCE WILLIAM 169,000 24,364 3.2% 15,400 ARLINGTON 157,600 5,001 0.6% 24,900 LOUDOUN 63,600 6,173 2.1% 18,100 STAFFORD 48,300 7,830 3.6% 14,200
VIRGINIA COUNTY TOTALS 1,126,300 135,414 2.6% $20,739
VIRGINIA INDEPENDENT CITIES
ALEXANDRIA 107,500 4,283 0.8% $24,700
FAIRFAX CITY 20,300 (237) -0.27 23,400
MANASSAS 19,500 3,995 4.7% 17,500
FALLS CHURCH 9,500 (15) 0.0% 27,700
MANASSAS PARK 6,900 376 1.1% 13,900
INDEPENDENT CITIES TOTALS 163,700 8,402 1.1% $23,400
TOTAL NSA 3,489,600 238,679 1.4% $19,500
UNITED STATES 239,283,000 12,222,000 1.05% $14,400
recently begun to decline, it still exceeds the U.S. growth rate by 40%. [133 (See Figure 2-2.)
Population growth has been uneven across jurisdictions. Since 1970, the District has lost approximately 120,000 people; it currently comprises 18% of the metropolitan pop-ulation, compared to 25% in 1970. This decline has been more than offset by an increase in the suburban population of over 320,000 people. [133 The most populous counties are Fairfax, Prince George's, and Montgomery, each comprising about 20% of the total metropolitan population. Fairfax and Montgomery Counties had the largest absolute population gains from 1980-1965. [143 (See Figure 2-2.)
Per capita income for the MSA was estimated to be $19,500 in 1986, almost 35% higher than the national average. (See Figure 2-2.) Consistent with its relative affluence, the MSA includes five of the ten wealthiest counties in the United States. [133
Recent Trends: Employment
With two million jobs (see Figure 2-3.), Washington, D.C. is the fifth largest metropolitan employer in the U.S. behind
New York, Los Angeles, Chicago, and Philadelphia.
Historically, economic growth has been shaped by Government policy, especially federal spending and location decisions; however, since 1970, the employment base has become more
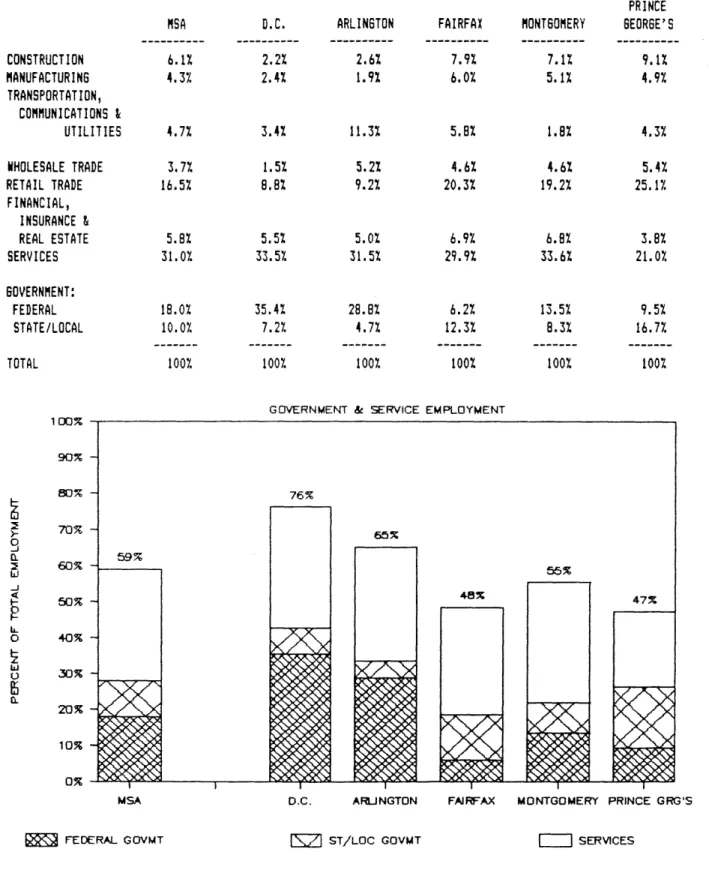
diversified and less reliant on Government spending for its growth. Direct government employment fell from 38% of total employment in 1970 to 28% in 1985, while services employment increased from 21% to 31%. [133 (See Figure 2-4.)
FIGURE 2-3. WASHINGTON, D.C. MSA EMPLOYMENT AND EMPLOYMENT GROWTH, 1985-1986
1975
SUB AREAS D.C.
MONTGOMERY COUNTY PRINCE GEORGE'S COUNTY OTHER 3 MARYLAND COUNTIES
MARYLAND SUB TOTAL FAIRFAX COUNTY ARLINGTON COUNTY
OTHER 3 VIRGINIA COUNTIES VIRGINIA SUB TOTAL
ACTUAL EMPLOYMENT 577,000 149,000 111,000 171,000 431,000 109,000 97,000 156,000 362,000 1980 X OF TOTAL 42% 11% 8% 12% 317. 8% 7% 11% 26% ACTUAL EMPLOYMENT 616,000 275,000 213,000 72,000 560,000 195,000 118,000 149,000 462,000 1985 % OF TOTAL 38% 17% 13% 4% 34% 12% 7% 9% 28% ACTUAL EMPLOYMENT 631,000 339,000 239,000 85,000 663,000 282,000 142,000 191,000 615,000 % OF TOTAL 33% 18% 13. 4% 35% 15% 7% 10% 32% 1986 ACTUAL % OF EMPLOYMENT TOTAL 641,000 32% 350,000 251,000 89,000 690,000 305,000 146,000 204,000 655,000 18% 13% 4% 35% 15% 7% 10% 33%
TOTAL D.C. MSA AREA 1,370,000 100% 1,638,000 100% 1,909,000 100% 1,986,000 100% UNITED STATES 2.0 1.9 1.8 1.7 1.6 1 .5 1.4 1.3 1.2 1.1 1.0 0.9 0.8 0.7 0.6 0.5 0.4 0.3 0.2 0.1 0.0 76,945,000 90,406,000
TOTAL MSA D.C. MONTGONERYPRINCE GRG'S FAIRFAX ARLINGTON OTHER COS
1975 E= 1980
SOURCE: Salomon Brothers, Inc. [13]
97,614,000 100,167,000
TOTAL EMPLOYMENT BY COUNTY
C
-2
FIGURE 2-4. 1985 EMPLOYMENT MIX IN MAJOR WASHINGTON D.C. NSA COUNTIES CONSTRUCTION MANUFACTURING TRANSPORTATION, COMMUNICATIONS & UTILITIES WHOLESALE TRADE RETAIL TRADE FINANCIAL, INSURANCE & REAL ESTATE SERVICES GOVERNMENT: FEDERAL STATE/LOCAL TOTAL 100% 90% 80% 70% 60% 0 Li 0 L) 40% 30% 20% 10% 0% MSA D.C. FEDERAL GOVMT MSA 6.1% 4.3% 4.7% 3.7% 16.5% 5.8% 31.0% 18.0% 10.0% 100% D.C. 2.2% 2.4% 3.4% 1.5% 8.8% 5.5% 33.5% 35.4% 7.2% 100% ARLINGTON 2.6% 1.9% 11.3% 5.2% 9.2% 5.0% 31.5% 28.8% 4.7% 100% FAIRFAX 7.9% 6.0% 5.8% 4.6% 20.3% 6.9% 29.9% 6.2% 12.3% 100% MONTGOMERY 7.1% 5.1% 1.8% 4.6% 19.2% 6.8% 33.6% 13.5% 8.3% 100% PRINCE GEORGE'S 9.1% 4.9% 4.3% 5.4% 25.1% 3.8% 21.0% 9.5% 16.7% 100%
ARUNGTON FAJRFAX MONTGOMERY PRINCE GRG'S
ST/LOC GOVMT
SOURCE: Salomon Brothers, Inc. [131
GOVERNMENT & SERVICE EMPLOYMENT
=I SERVICES
Approximately 80% of the area's employment is centered in the District, and in Fairfax, Prince George's, Arlington and Montgomery Counties. District employment comprises about 32% of the total. Montgomery, Fairfax, Prince George's and Ar-lington comprise 18%, 15%, 13% and 7% of total employment, respectively. (See Figure 2-3.) The Federal Government is the major employer in the District, while services is the dominant sector in the other four counties. [133 (See Figure 2-4.)
While not "recession proof", Washington's high concentration of government jobs and lack of manufacturing employment should continue to insulate the area from national economic downturns. While the area has experienced a slow down in growth during national recessions, no absolute losses in total employment have occurred in the postwar era, except for a 0.4% decline in 1982. And the 1982 decline was met with a strong recovery in 1983. [14] (See Figure 2-5.)
The Washington, D.C. economy is expected to continue to grow faster than the nation's, albeit at a slower rate. However, the rate of growth could be adversely affected by several factors. First, the high cost of housing and transportation makes it difficult for local employers to attract employees from out of the area. Washington's high employment growth rate cannot be sustained without in-migration. Second, shifts in Federal spending could affect employment in the government and defense sectors. Third, because the em-ployment base has diversified, the area is more susceptible to the national economy. A recession could significantly slow growth. Notwithstanding the above, most experts predict the Washington economy will remain healthy for some time to come. E133
FIGURE 2-5. EMPLOYMENT GROWTH RATES - WASHINGTON, D.C. versus THE UNITED STATES
D.C. METRO AREA vs. THE UNITED STATES
67 68 69 70 71 72 73 74 75 76 77 78 79 80 81 82 83 84 85 86 87E88E
0
D.C. METRO AREA
X THE UNITED STATES
SOURCE: Salomon Brothers, Inc. [13]
10%
9%
7%
5%
4%
3%
2%
1%
0%
-1%
-3%
-4%
-5%
THE REAL ESTATE MARKETS
The majority of foreign investment in the Washington MSA has been concentrated in office buildings located in the D.C. CBD (Central Business District). A recent article by Mary Sherburne, of Smith Braedon Company, suggests that at least 26% of the CBD is under foreign ownership, while over 35% of the famous "Golden Triangle" is foreign owned. [173 City-wide, we estimate that foreigners own 15.9 million square feet, representing approximately 12% of the total Washington office market. (See Figure 4-1.) This exceeds foreign
in-vestment in such U.S. cities as Los Angeles and Chicago, which have 10.8 million square feet and 9.3 million square feet, respectively, under foreign ownership. [183 & [19) In fact, we believe that on a square footage basis, foreign ownership of the D.C. office market is second in the nation, only to New York City.
To a lesser extent, foreigners have purchased and/or de-veloped office and retail properties in Arlington and Fairfax Counties. Little foreign activity has been noted in the other counties and jurisdictions. Also, foreigners have shown little interest in industrial and residential prop-erties. Because foreign investors are primarily interested in downtown office properties, our discussion of the Washington real estate markets will be confined to this area.
The shift toward services employment in the 1970's, in tandem with increased defense and other government spending after 1979, created an explosive increase in demand for office space. Over the past five years, the metropolitan market has absorbed (net) over 50 million square feet of office space. In 1986, the area led the nation in net absorption. In response, developers have added close to 55 million square feet over the same period. (See Figure 2-6.) The area's
ANNUAL ADDITIONS TO WASHINGTON. D.C. AREA OFFICE INVENTORY & NET ABSORPTION D.C. ANNUAL ADDITIONS & ABSORPTION
22 20 18 10 14 12 10 22 20 18 1 6 1.4 1 2 I = 2 0 1979 1980 1 901 EO ADDITIONS 1 982 1 983 1 94 1 988 1 980 1 987E 02OAISORPTION FIGURE 2-6. 1979 1980 1 901 1982 1983 1984 1 98 190 197E
SUBURBAN ANNUAL ADDITIONS & ABSORPTION
NASA ANNUAL ADDITIONS &f- ABSORPTION
22 20 1 15 10 10
I
speculative office inventory increased to 125 million square feet in 1986, ranking Washington fourth in the nation behind New York, Chicago, and Houston. [133
The current vacancy rate of 16.4% (11.7% in District, 20% in suburbs) at the end of 1986 is high based on historical stan-dards; however, compared to the national vacancy rate of 21%, Washington remains one of the strongest markets in the country. Vacancy levels should increase over the next sev-eral years as supply continues to expand (more than 22 million square feet are currently under construction) and ab-sorption moderates. [133 (See Figure 2-7.)
Real rents in the MSA appreciated until 1985, and have been flat to down ever since. As vacancy levels rise over the next several years, downward pressure on rents should con-tinue. Land and building prices continue to rise, however, due to demand for investment properties.
Despite the current high vacancies, Washington (especially D.C.) is supply constrained due to its stringent zoning laws. A report by MIT's Center For Real Estate Development esti-mates that in the D.C. area, there remains only 120 de-velopable sites. Accordingly, the city is less susceptible to overbuilding and increases in demand will more readily translate into increased rents. (15)
FUTURE PROSPECTS
Washington's growth record, economic stability, and visi-bility will continue to attract global attention as one of the most sought after real estate markets in the nation. Foreign investors perceive the presence of the U.S. gov-ernment as a stabilizing factor and consider an investment in
the area safe from the political uncertainties of the rest of the world. The next section of this paper will identify and discuss specific real estate transactions that involve for-eigners investing in Washington in an attempt to better un-derstand the nature of foreign investment and the oppor-tunities it creates for U.S. real estate professionals.
WASHINGTON.
D.C. AREA TOTAL OCCUPANCY & VACANCY RATESD.C. OCCUPANCY & VACANCY RATE
1 .7C 1 2 1 v 1 0. 00 0.0w
~
12 2~ 1 0. _v M 10 00 0. 95P 18o 1 4O 130 120 110 00 80 70 .0 140 20) 10 90 1 40 1 30 120 110 1 00 e~o 70 90 .40 .MO 20 1 0 1 0 1 .40 1 20 110 1 00 950 00 40 30 20 1 0 03 1 979 1 980 1 901 1 982 1 903 1 9404 1 90 1 906 1 907EMSA OCCUPANCY & VACANCY RATE
1
979 1 90 1 901 1 982 1993 194 190 190 97EOCCLUPIEO SPACE VACANT SPACE
SOURCE: Salomon Brothers, Inc. [131 & Jones Lang Wootton Investment Research [141 FIGURE 2-7,.
1 979 1 oa0 1 901 1 982 1 90.3 1 904 1 95 1 900 1 987E
SUBURBAN OCCUPANCY & VACANCY RATE
2 1. .1M 20.0% 916.O0|: 013.9% ds.1 w o 1 .3.2 1 O.2 1 0. 6 a 30
CHAPTER 3
FOREIGN INVESTMENT AND
THE WASHINGTON, D.C. REAL ESTATE MARKET
Economists, politicians, and financiers are involved in an ongoing debate about the pros and cons of foreign investment in U.S. assets. Some experts claim that foreigners are "buying up the country" thereby taking jobs from American citizens and creating national security problems. They worry about the United States' recent emergence as the world's largest debtor nation and argue that a reversal of this trend (capital flight) could have severe economic repercussions. Others believe that foreign investment is necessary to satiate the U.S. appetite for capital and that such investment has been partly responsible for U.S. economic expansion and the decline in interest rates.
Notwithstanding the above predictions, it is important that the student of the Washington, D.C. real estate market have an understanding of international economics and capital flows, and how they effect foreign investment in this country. This is because the large presence of foreign
investors in Washington, D.C. has a significant impact on property values and development patterns. This chapter addresses the issue of capital flows, and then proceeds with a discussion of foreign interest in real estate and, more specifically, Washington, D.C. real estate.
INTERNATIONAL CAPITAL FLOWS AND THE UNITED STATES
The decade of the 80's has seen a significant increase in in-ternational capital flows. A recent Salomon Brothers report attributes the trend to the integration of separate na-tional capital markets and economies into a single worldwide capital market and economy. As a result, the prosperity of the U.S. is heavily influenced by the rest of the world. [63
Several aspects of this world wide integration are important to the U.S. First, international capital will flow into mar-kets (countries) which provide the best real returns for a given level of risk. On this basis, certain U.S. investments appear to have higher risk adjusted returns than similar in-vestments in other countries. Second, as this international arbitrage continues, real return differentials will begin to disappear. Obviously, there are numerous factors which could affect this equilibrium process including currency rate fluc-tuations, inflation rates, world political stability, etc. Nevertheless, certain classes of U.S. assets seem to be attracting foreign capital for exactly this reason. For ex-ample, yields on institutional grade office buildings in sev-eral U.S. cities have declined as a result of foreign participation. (Note: It is important that the reader under-stand that it is differences in risk adjusted real returns, not nominal returns, that would cause this international ar-bitrage process to occur). E133
As these international capital flows continue, the U.S. will capture a disproportionate amount of foreign investment. Attractive yields are only one reason; other reasons include:
* The recent U.S. balance of trade deficit has flooded the world with dollars and resulted in a decline of the U.S. dollar in the world currency markets.
Accordingly, U.S. assets look cheap in the global market. Also, the drop in value of the dollar reduces
the risk of further declines in the dollar's value.
Most significant is the value of the dollar relative to the Japanese yen, attracting an onslaught of Japanese investment. This is likely to prove temporary, however, as nations act to correct the imbalance.
* The U.S. is perceived to be politically stable and to represent a "safe haven" for foreign investment. [203
* The U.S. market is a large, wealthy market with numerous investment opportunities. Additionally, the country is considered a "growth market". Overseas
investment opportunities seem limited and less
desirable in this context.
* The U.S. free enterprise system encourages foreign investment. The market is accessible to foreigners and places little regulation on private property.
* The U.S. market appears to provide superior returns relative to many foreign markets. Additionally, because borrowing costs are lower in some countries than in the U.S., leveraged yields on U.S. investments financed with foreign funds might enhance overall returns, subject to exchange rates and relative inflation rates.
* Some foreign nations, especially the Japanese, have recently relaxed restrictions on foreign investment by their institutions and other major investors. This has allowed for greater participation in the U.S.
WHY REAL ESTATE?
Many of the reasons foreigners invest in real estate are similar to those which motivate American real estate in-vestors. For one, real estate provides an effective way to diversify the investment portfolio against inflation. This is especially appealing to the foreigner as many nations have historically suffered much higher inflation rates than in the U.S. Also, many foreigners are "predisposed" to invest a significant portion of capital into real estate as a result of in-house investment policy and regulatory mandate. For example, it is common for foreign pension funds to invest up to 3OX of their assets in real estate compared to less than
3% for most U.S. funds.
U.S. real estate is especially appealing for two reasons. First, it provides a greater degree of liquidity than foreign real estate. Turnover of real estate in some foreign coun-tries occurs infrequently. The U.S. market is very active, however, making it fairly easy to buy or sell a property. At any time, there are numerous high quality U.S. properties a-vailable for purchase. Second, yields on U.S. properties tend to be higher than similar properties elsewhere. In Ja-pan and Great Britain, for example, yields on institutional quality investments are currently less than 3%, compared to 6%-B% in the U.S. [213
WHY WASHINGTON, D.C. REAL ESTATE?
The interest of foreign investors in the Washington, D.C. market was once newsworthy, but no longer. Over the last decade, foreigners have arrived in force and purchased large amounts of prime investment property. The Europeans were first (primarily Dutch and British pension funds) and, in the
late 70's and early 80's, began buying existing buildings and land. They were followed by the Canadians and, most re-cently, the Japanese. Also represented are investors from West Germany, the Mid-East, Greece, Belgium, France, Cyprus, Lebanon, Turkey, and several other countries. Foreigners typically entered the market through the purchase of an existing property or through a joint venture with an American investor. Recently, some foreigners have become more ag-gressive and are currently developing property for their own account.
A wide range of international investors regard Washington as their primary target. According to one expert, Washington,
D.C. is the number one destination for the European investor, and number three for the Japanese investor, behind Los Angeles and New York. [223 A senior representative of a Japanese insurance company has gone as far to claim "today, Washington is our next target." [153
Why Washington, D.C.? One reason is that Washington has the third largest Central Business District (in terms of square feet of office space) in the country. This provides the foreigner with numerous investment properties to select from. More important, however, is what one broker calls the "Hong Kong Factor": the notion that the central business district is running out of developable space. The CBD has 30 million square feet of developable FAR (floor area ratio) remaining, compared to an existing inventory of 54 million square feet. Based on the current absorption rate of 2.9 million square feet per year, the supply of developable land will be exhausted in about 11 years. [223 (See Figure 2-6.)
The strength and stability of the local economy, along with the area's relatively low vacancy rates are also attractive to the foreign investor. As described in Chapter 2,
Wash-ington is experiencing rapid growth in employment, population and income, which is expected to continue for some time to come. Also, the presence of the federal government has a
stabilizing effect on the local economy insulating the city from a national economic downturn. Vacancy rates in the Washington, D.C. area are currently among the lowest in the country.
Another reason Washington is appealing is that it is con-sidered less expensive relative to other cities of foreign interest. For example, fully leased Class A downtown office space in Los Angeles, with comparable effective rents, is $20 to $70 per square foot more expensive than in Washington, D.C. [18]
Also appealing is the lower cost of acquiring an initial presence in D.C. compared to other cities. This is because buildings tend to be a good deal smaller due to height and bulk restrictions. [233
Finally, Washington, D.C. is a city well known to foreigners. This is partly due to the City's international recognition as the Capitol of the United States, and partly due to the
"European look" of the city.
LOOKING TO THE FUTURE
Foreigners did not take their profits and retreat from the U.S. real estate market when the dollar was at its all-time high a few years ago. And most observers believe that in the near-term, foreign investment in U.S. real estate will con-tinue, as the dollar remains weak, and yield spreads between U.S. and foreign markets remain substantial. Since for-eigners are generally long-term investors, they tend to use
exchange rates and yield differentials as "buy" signals only, not "sell" signals. For example, during the early 1980's when the U.S. dollar was very high in relation to almost every other currency, there were very few real estate sales by foreign investors. Based on this, it would seem that for-eign ownership of U.S. property will only increase in the fu-ture.
Current investment will be constrained only by apprehension over soft markets and scarcity of good product. Over the longer term, the deregulation of the global capital markets and foreign institutional investors will continue, resulting in a further increase in U.S. real estate investment.
What effects will foreign investment have on U.S. real estate and, specifically, Washington, D.C. real estate? Nationally, these effects are limited by the relatively small size of
foreign investment. Despite all the hoopla, foreign invest-ment in U.S. developed real estate comprises just over 1% of the total market.
However, it is significant that foreign investment has been focused on a very narrow market; class A downtown office buildings in select cities, and certain types of hotel and resort properties. In these markets, property values have risen as a result of foreign activity.
It is not certain what "spill-over" effect, if any, foreign activity will have in these markets. However, it would seem that as market yields decline and investors gain increasing familiarity with U.S. markets, foreign capital flow will spread into more cities and more property types.
The impact of foreign investment in Washington, D.C. is clear. First, the Washington, D.C. market will continue to
capture a disproportionate amount of foreign capital due to its strong underlying fundamentals. Second, the market price for downtown and certain suburban markets will be set by foreign activity. The foreigner's somewhat different invest-ment objectives (see chapter 5) enable them to outbid their American counterparts and pay prices that motivate sales. Last, the foreign investor's long-term investment horizon forces them to focus on high quality properties and intensive property management. This will also increase values and place competitive pressures on other property owners to raise quality standards.
Now that we understand why foreigners invest in U.S. real estate, we will take a closer look at who these foreign
CHAPTER 4
PROFILES OF INVESTORS
So far, we have examined the Washington, D.C. market and explored the reasons foreigners invest in U.S. and D.C. real estate. We are now ready to turn our attention to the task of identifying and describing the various foreigners cur-rently represented in the D.C. market. Obviously, foreign investors come in all sizes, shapes and forms. However, describing the characteristics of the various players pro-vides a useful understanding of their modus operandi.
Before proceeding, it is important that we reiterate the lim-itations of this study. Data in this chapter was derived from our efforts to identify and describe the universe of foreign owned real estate in Washington. While we have en-deavored to be accurate, our data gathering and interview process is subject to bias and error of omission. Appendix A presents a summary of our findings.
WHO ARE THEY?
There are many different categories of foreign investor active in the D.C. market. The typology of the foreign in-vestor is best divided into two classifications: nationality
Nationality:
At least ten countries are represented in the D.C. market. Historically, the Europeans and Canadians have been the most active. The British established a major presence in the late 1970's and were immediately followed by the Canadians. During the 1980's, the Dutch and Germans became major players. The most recent entry into the market has been the
Japanese who since 1985 have been involved in over a dozen major transactions. Also active have been Belgians, Germans, Saudis, Scots, and Fins. [173
Currently, the largest foreign property owners in D.C. are the British, followed by the Japanese and Canadians. (See Figure 4-1) In the last two years, the Japanese have been the most active investors while European activity has mod-erated. This is probably the result of more favorable ex-change rates for the Japanese, relative to other foreigners. For example, the yen denominated price per square foot of
U.S. real estate has declined by 41% since 1985. [12)
Business Activity:
The majority of the British and Dutch money has been provided by pension funds. [243 This money has been placed either through outright purchases of existing properties or through development joint ventures with established foreign or American developers. [213 Japanese investment has been placed primarily by the large Japanese life and construction companies, while Canadian investment has come from the insurance industry and development companies. [9) & [253 Other nationalities are represented through banks, pension funds and individuals.
FIGURE 4-1. FOREIGN INVESTOR INVOLVEMENT IN THE WASHINGTON, D.C. REAL ESTATE MARKET NATIONALITY OF INVESTOR CBD Belgium Canada Finland Germany Great Britain Japan Netherland Antilles Netherlands Saudia Arabia Scotland Unknown SUBURBS Belgium Canada Finland Germany Great Britain Japan Netherland Antilles Netherlands Saudia Arabia Scotland Unknown TOTAL D.C. MSA Belgium Canada Finland Germany Great Britain Japan Netherland Antilles Netherlands Saudia Arabia Scotland Unknown NUMBER OF INVESTORS NUMBER OF PROPERTIES 1 2 4 6 1 1 3 3 22 22 12 12 2 2 4 7 2 3 1 1 4 5 56 64
Spring 1987 total inventory --- >
0 0 1 1 0 0 1 1 2 4 0 0 0 0 2 4 1 1 0 0 0 0 7 11
Spring 1987 total inventory --- >
1 4 3 22 12 2 4 2 4 56 Spring 1987 2 7 1 4 26 12 2 11 4 1 5 75 total inventory --- ) SQUARE FEET OF BUILDING 421,000 E 1,556,000 140,000 1,403,000 3,137,737 E 3,654,497 E 192,000 485,000 437,655 101,000 1,464,000 E 12,991,889 E 53,000,000 0 439,000 0 221,000 E 943,000 0 0 885,000 417,000 0 0 2,905,000 E 96,000,000 421,000 E 1,995,000 140,000 1,624,000 E 4,080,737 E 3,654,497 E 192,000 1,370,000 854,655 101,000 1,464,000 E 15,896,889 E 149,000,000 (--- Foreign owned (--- Foreign owned (--- Foreign owned
WHAT ARE THEY INVESTING IN?
While the profiles of the foreign investors have been very diverse, their investment preferences have been remarkably similar. The vast majority of foreign investors are buy-ers/developers of downtown office buildings in D.C. The typical investment might be an 8 to 12 story office building in the central business district, preferably, in the "Golden Triangle" area of the CBD. Little interest has been shown for other property types, with the exception of a few retail and mixed-use projects. (See Appendix A) Purchases tend to be for all cash, and financial and ownership structures are
typ-ically not complex.
To a lesser extent, the more aggressive foreigners have shown some interest in office properties in close-in suburbs such as Rosslyn and Alexandria. These investments are located in supply constrained markets and are typically developed by the investor.
It is interesting to note that foreign investment patterns seem to be changing over time. As an entry strategy, most foreigners prefer to buy with cash, fully leased, Class A office buildings, either alone, or in a joint venture. How-ever, as the foreigners gain familiarity with the local and U.S. market, they are more likely to become involved in
de-velopment and building renovation, and also to use more innovative financing and ownership structures. [263 & [273
The data seems to bear this behavior out. For example, the Canadians, British and Dutch, all of whom have relatively long histories in the D.C. market, tend to behave very much like their American counterparts. Not only are they ag-gressive investors, but they are also heavily involved in development, and in some instances, suburban development. On
the other hand, the newcomers to the market, the Japanese, have primarily invested in existing buildings and have adopted a very cautious approach.
In summary, foreign investors and their investments are very diverse; however, there are certain biases which seem to guide most foreigners' behavior. Chapter 5 will discuss these biases in the context of the foreign investment strategy.
CHAPTER 5
THE FOREIGN INVESTOR'S STRATEGY
FOR INVESTING IN UNITED STATES REAL ESTATE
Describing an investment strategy which characterizes all foreign investors is like trying to answer the age old question "How high is up?" There are many answers, depending on the context in which the question was asked. Foreigners differ across nationalities, investor profiles and individual preferences. They also differ based on their experience and understanding of the U.S. market, and of the specific city in which they desire to invest. Where a Japanese life company may be only interested in fully leased, triple-A buildings in downtown Washington, a Japanese trading company might be de-veloping a speculative high-rise in Los Angeles. A British pension fund, on the other hand, might adopt an entirely dif-ferent strategy.
While these differences can be numerous, there are also many similarities. By studying these similarities, one can begin to understand, and learn from, the philosophy of the foreign investor relative to his American counterpart. Our inter-views reveal several characteristics which are common to most foreign real estate investment strategies, irrespective of nationality, preferences, and the like. These include:
1. Location preferences 2. Property characteristics
3. Holding period
Location Preferences:
Foreign investors, especially newcomers to the American market, are very aware of the importance of "good" location to the performance of a real estate investment. Because of their lack of familiarity with the country, they tend to focus on a few select locations which can readily be studied and understood. Their definition of good location reflects their preference for safe, stable markets; they are less con-cerned with "home run" investments and, therefore, are less adventurous than their American counterparts. [28)
As part of their strategy, foreigners tend to focus on supply constrained markets. E213 Generally, these markets are characterized by size and zoning restrictions which limit competition and make growth more predictable and structured. The central business districts of Washington, Boston, and San Francisco are examples of cities that meet this criterion. Foreigners believe such markets are less susceptible to the higher vacancies and reduced rents associated with an econ-omic downturn. They view real estate investments under these conditions as inflation protected annuities. C13)
Foreigners are also concerned with the economic fundamentals of a market. They prefer cities with strong growth histories and good prospects for future growth. Additionally, they prefer diversified markets which are less susceptible to the cycles of a single industry. The sunbelt, a popular des-tination for foreign capital in the 1970's, has lost its
al-lure in favor of the more stable markets in the Boston Wash-ington corridor.
Finally, foreigner's prefer cities which have international recognition. One aspect of this is that it is easier to gain
the support of the "home office" to invest in familiar cit-ies. Also, such cities tend to already have a large foreign contingent which serves as an information network for the foreign investor. [213
Property Characteristics:
The vast majority of foreign investment has been in office buildings. The few exceptions have been hotel, and to a les-ser extent, retail properties. Office buildings are prefer-red for three reasons. First, they are the predominant form of real estate investment overseas; thus, the foreigner has a greater familiarity with this investment type. Second, office buildings tend to be less management intensive; other types of properties require much greater attention and on-site management. Third, office tenant lease terms can be more easily structured to match investment criteria.
Because foreigners tend to have much longer holding periods than their American counterparts, they focus on high quality, efficient structures. Emphasis is placed on quality of fin-ish and state-of-the-art technology and design. While this may increase the initial investment, foreigners believe it is more than offset by reduced operating costs and added com-petitive advantage in attracting tenants.
Holding Period:
Foreigners tend to have much longer holding periods than American investors. This is consistent with the "capital haven" philosophy discussed in chapter 3. However, it is also a function of a cultural inclination to hold investment real estate. Because developable land is scarce in many
countries, foreigners tend to develop emotional attachments to property and will sell only if they have a problem.
Relationship Orientation:
Because of their lack of proximity to the U.S., foreign in-vestors often rely on U.S. intermediaries for support. This can be in the form of hiring U.S. real estate professionals on a fee or commission basis, or forming a joint venture with a U.S. partner. Foreigners tend to be very cautious in es-tablishing these relationships. [293 They stress integrity and reputation and they demand that the intermediary/partner have an intimate understanding of their investment objectives and culture. Typically, these criteria are best met by a large, prestigious U.S. company such as a Gerald Hines or an Equitable, or by countrymen who already have a presence in
the U.S. market.
Probably the greatest complaint of foreigners toward U.S. real estate professionals is that Americans are too trans-action oriented; they do not spend enough time developing relationships. As a result, many Americans have little un-derstanding for the foreign investor and therefore do not al-ways effectively serve their needs. [303
Now that we have provided a clear profile of the "who's", "how's", and "why's" of foreign investment, it is time to fo-cus on the ramifications of such investment. Chapter 6 sum-marizes our findings and discusses the implications of the
CHAPTER 6
SIGNIFICANT FINDINGS AND IMPLICATIONS
Foreign activity in U.S. real estate is not a fad. For the foreseeable future, foreigners will continue to purchase and develop U.S. properties. As a result, numerous opportunities will be available for U.S. real estate professionals. For-eigners will continue to need advisors and intermediaries; also, for those who can access it, foreigners have an almost unlimited supply of "patient" capital.
However, developing these relationships is easier said than done. Foreigners are cautious and very selective about who they do business with. Accordingly, U.S. real estate pro-fessionals must understand the foreign mind-set and develop a marketing program which is sensitive to the cultural and philosophical differences that exist among foreigners, as well as between Americans and foreigners.
We believe our research provides insight into the idio-syncrasies of foreign investors. The remainder of this chapter is dedicated to summarizing our significant findings and explaining the implications for U.S. real estate pro-fessionals.
SIGNIFICANT FINDINGS
The following is a summary of the significant findings pre-viously described in this report. Obviously, there are ex-ceptions to each item; however, these findings tend to
re-flect the most likely behavior of the foreigner.
Foreigners view U.S. real estate as a."capital haven".
Safety may be the most compelling reason foreigners invest in U.S. real estate. A history of political and economic tur-moil overseas has made international diversification an im-portant part of the foreign investment strategy. The United States is viewed as politically stable and the last bastion of free enterprise. Private property rights are considered sacrosanct in this country, mitigating the fear of expro-priation.
Additionally, an investment in real estate is an investment in a tangible asset, as opposed to a paper (financial) asset. This has an added emotional value to the foreigner.
Foreigners are long-term investors in U.S. real estate.
The capital haven aspect of the foreign investment strategy, along with the foreigner's cultural disinclination to sell real estate, results in long holding periods. Where an American investor will typically hold real estate for 7 to 10 years, a foreign investor will hold real estate for 25 years, or longer.
Because of this long-term perspective, foreigners prefer high quality, state-of-the-art technology and design in the
prop-erties in which they invest. Also, foreigners stress good management of the physical asset.
Foreign investors will accept lower returns under certain conditions.
Foreign investors accept lower returns (pay higher prices) for a variety of reasons. First, foreigners have focused their attention on a very narrow slice of the U.S. market. The resulting intense competition in these thin markets has reduced yields and made it more expensive to participate. This is analogous to an auction where the "winner" is the party with the highest willingness to pay; that is, the item goes to the party who values it the most. Since foreign in-vestors place a higher value on certain downtown office prop-erties, they tend to outbid their American counterparts for such properties. On less favored property types (i.e. suburban properties), foreigners are generally not compet-itive bidders. Second, global economic conditions are such that to many foreigners, investment in the U.S. looks rel-atively cheap. This is a function of favorable exchange rates, low financing costs overseas (making leveraged yields on U.S. investments even higher) and lack of competing in-vestments in other countries. Third, the safe haven aspect of the foreign investment strategy suggests that foreigners will pay a premium for low risk, high quality properties.
The belief that foreigners pay too much for U.S. real estate may not be true.. Relative to other real estate investments, foreigners do pay more; however, in the very narrow, supply constrained markets foreigners prefer, yields and prices are probably reasonable. And when exchange rates and overseas financing are considered, returns for foreigners may even be
superior to those that can be achieved by American investors.
Given the foreigner's long holding period, it is conceivable that yields may decline further as the appetite for these properties exceeds their availability.
Exchange rates are important in the foreign investment decision.
Favorable exchange rates allow the foreigner to buy more U.S. product for the money, thereby providing an impetus to in-vest. This helps explain the recent flow of Japanese money into the U.S. As exchange rates change, however, the for-eigner does not show an inclination to sell U.S. property for the purpose of capturing currency gains. This reinforces the belief that foreigners are long term investors, more inter-ested in protecting their investment than maximizing gain-op-portunities.
Foreign investors have strong location preferences.
Foreigners are primarily interested in internationally rec-ognized cities. They show a strong bias for Class A office properties located in the central business district. They generally avoid suburban properties due to their lack of un-derstanding of the suburb; most foreign countries do not have suburbs. They are also very market conscious and prefer sup-ply constrained locations with excellent underlying economic fundamentals. These preferences are not surprising and are probably no different than those of an American investor