HAL Id: hal-00640495
https://hal.archives-ouvertes.fr/hal-00640495
Submitted on 29 Apr 2016
HAL is a multi-disciplinary open access
archive for the deposit and dissemination of
sci-entific research documents, whether they are
pub-lished or not. The documents may come from
teaching and research institutions in France or
abroad, or from public or private research centers.
L’archive ouverte pluridisciplinaire HAL, est
destinée au dépôt et à la diffusion de documents
scientifiques de niveau recherche, publiés ou non,
émanant des établissements d’enseignement et de
recherche français ou étrangers, des laboratoires
publics ou privés.
associated with Jovian hectometric radiation
M. Y. Boudjada, Patrick H. M. Galopeau, H. O. Rucker, A. Lecacheux, N.
Mebarki, W. Macher, W. Voller
To cite this version:
M. Y. Boudjada, Patrick H. M. Galopeau, H. O. Rucker, A. Lecacheux, N. Mebarki, et al..
Morpho-logical aspects of the attenuation bands associated with Jovian hectometric radiation. Journal of
Geo-physical Research Space Physics, American GeoGeo-physical Union/Wiley, 2011, 116 (A11), pp.A11208.
�10.1029/2010JA016354�. �hal-00640495�
Morphological aspects of the attenuation bands associated
with Jovian hectometric radiation
M. Y. Boudjada,
1P. H. M. Galopeau,
2H. O. Rucker,
1A. Lecacheux,
3N. Mebarki,
4W. Macher,
1and W. Voller
1Received 6 December 2010; revised 18 August 2011; accepted 20 August 2011; published 10 November 2011.
[1]
We study the frequency and time variations of Jovian hectometric emissions (HOM)
recorded by the Radio and Plasma Wave Science (RPWS) experiment onboard the Cassini
spacecraft during its Jupiter flyby. The capabilities of the RPWS experiment enable us
to analyze the intensity extinction of HOM radiation, the so
‐called attenuation band. Using
about 7 weeks of RPWS data obtained around the closest approach, a statistical analysis
investigates the spectral variations of this phenomenon with respect to the spacecraft
magnetic latitude and central meridian longitude. We show that the
‘trace’ of the attenuation
band is usually not a full sinusoid as reported in previous studies and only parts of the curve
are observed. Also, the intensity extinction can occur when the spacecraft is not in the
planetary magnetic equator plane. This specific feature appears or vanishes when the
observer (e.g., Cassini or Galileo spacecraft) is far from or close to the planet, respectively.
The regular and systematic observations of the attenuation band suggest that the plasma
medium at the origin of these features is steady and stable. The Io torus may be considered
to be the most probable plasma medium where HOM emission is refracted through its
raypath propagation. Furthermore, intensity extinction at frequencies higher than 3 MHz and
up to 5 MHz implies the presence of particular electronic density irregularities in the Io torus.
Volcanic activity, particularly in the northern hemisphere of the Io satellite, may be the
source of such Io torus plasma irregularities.
Citation: Boudjada, M. Y., P. H. M. Galopeau, H. O. Rucker, A. Lecacheux, N. Mebarki, W. Macher, and W. Voller (2011), Morphological aspects of the attenuation bands associated with Jovian hectometric radiation, J. Geophys. Res., 116, A11208, doi:10.1029/2010JA016354.
1.
Introduction
[2] Since the discovery of the Jovian decametric emissions
in 1955, regular spectral structures have been observed from the ground [Carr et al., 1983; Bose et al., 2008], and later from space by several spacecraft (Voyager, Ulysses, Galileo, and Cassini) chronologically. The Planetary Radio Astronomy (PRA) experiment onboard the Voyager spacecraft provided for the first time a complete spectral view of the Jovian radio emissions from a few kHz up to 40 MHz. Four main com-ponents have been reported: the decametric (DAM) and hectometric (HOM) radiations, the narrowband (nKOM) and broadband (bKOM) kilometer emissions [Kimura et al., 2008; Reiner et al., 2000]. In the following we first consider
general features of Jovian HOM emission, followed by detail aspects of the so‐called attenuation band observed for the first time during the Voyager flyby of Jupiter.
1.1. Jovian Hectometric Emissions
[3] Satellite observations revealed in the seventies of the
last century the existence of the Jovian hectometric emissions [Desch and Carr, 1974; Kaiser, 1977]. The HOM emissions were found to primarily occur at frequencies less than 3 MHz which cannot be observed from Earth’s surface because of the ionosphere cutoff. Most of the previous studies of HOM radiation concern the beaming of the emission, the source location and the dependence of the emission on the solar wind conditions. The lower frequency of HOM can be detected down to about 40 kHz, but is usually closer to 300 kHz, whereas the upper frequency cutoff is usually about 3 MHz. However it has been shown that such emissions can reach frequencies of about 5.8 MHz [Galopeau and Boudjada, 2005], and sometimes even higher according to Barrow and Desch [1989]. This emission is generally considered to be emitted from high Jovian magnetic latitudes at frequencies close to or just above the local gyrofrequency [Ladreiter and Leblanc, 1989]. The Jovian hectometric emission originates from distinct sources in both the northern and southern
1
Space Research Institute, Austrian Academy of Sciences, Graz, Austria.
2
Laboratoire Atmosphères, Milieux, Observations Spatiales, CNRS, IPSL, Guyancourt, France.
3Laboratoire d’Etudes Spatiales et d’Instrumentation en Astrophysique,
Observatoire de Paris, Meudon, France.
4Laboratoire de Physique Mathematique et Subatomique, Mentouri
University, Constantine, Algeria.
Copyright 2011 by the American Geophysical Union. 0148‐0227/11/2010JA016354
JOURNAL OF GEOPHYSICAL RESEARCH, VOL. 116, A11208,doi:10.1029/2010JA016354, 2011
hemispheres. The radiation is beamed into a hollow cone with its axis tangential to the local magnetic field direction. The rotation profile consists of two regions of emission situated approximately at central meridian longitude (CML) of about 210°. The range of longitude where the HOM is observ-able depends on the Jovicentric declination as shown by Alexander et al. [1979] using spacecraft observations (RAE 1, IMP 6, Voyager 1 and 2). Polarization measurements indicate that the emission is predominantly right‐hand (RH) circular polarized when observed from the Jovian northern hemisphere and left‐hand (LH) circular polarized when observed from the southern hemisphere [Ortega‐Molina and Lecacheux, 1991]. These authors found that the RH and LH polarized hectometric emissions occur in a quite irregular pattern both in time and in frequency. RH emission is gen-erally seen in CML range between 60° and 330°, with a gap of emission around 200°. LH emission occurs around CML ranges 330°–360°, and 0°–60°.
[4] Investigations using the Voyager data suggested the
auroral regions as the HOM source location [Kaiser et al., 1979; Lecacheux et al., 1980]. Later, the URAP experiment onboard the Ulysses spacecraft provided the first opportunity to perform direction finding measurements of the Jovian radio emissions. Jovian hectometric emissions were found to originate from the auroral regions near the foot of the magnetic field lines in the L‐shell range 4 < L < 6 [Reiner et al., 1993; Menietti and Reiner, 1996] or from field lines 7 < L < 11 that connect the HOM radio sources with the inner Jovian plasma sheet and/or outer plasma torus [Ladreiter et al., 1994]. One has to note that these investigations analyzed HOM emissions at frequency lower than 1 MHz because of the URAP experiment frequency range (1.25– 940 kHz). Occultation of radio emission observed by the Galileo/PWS experiment during the first flyby of the satellite Ganymede suggested a HOM source along a magnetic field line with a L‐shell of 7 or larger [Kurth et al., 1997]. Using spin modulation observations from the Galileo spacecraft, Menietti et al. [1998] found the source of emission to most likely be the Io torus or magnetic flux tubes in the wake of Io. 1.2. Jovian Hectometric Attenuation Band
[5] One of the major discoveries of the Voyager Jupiter
flyby was the detection of a region of high plasma density around the satellite Io, the Io plasma torus, primarily pro-duced by the volcanic activity of the Jovian satellite [Warwick et al., 1979]. The discovery of an attenuation band [Lecacheux et al., 1980] in the HOM emissions was inter-preted as a refraction effect which occurs inside the Io torus [Lecacheux, 1981]. The author computed a number of ray trajectories through the Io torus and compared the results of the computations with the spectral properties of the HOM emission. The attenuated band was observed when Voyager 1 was going across the torus. An electron density model of the Io torus was constructed from measurements of the electron gyro and plasma frequencies. The ray tracing showed the existence of important refraction effects in the range of fre-quencies extending up to about a few megahertz. Later, Higgins et al. [1995] reported dynamic spectral features, using the Voyager/PRA experiment, which appear as lanes of decreased emission intensity at frequencies from 300 kHz to 1.3 MHz [Green et al., 1992]. The occurrence and char-acteristics of these lanes did not depend on local time for the
period examined. The lanes were found to exhibit predomi-nantly right‐hand circular polarization when the spacecraft magnetic latitude varied between 0° and +10°. The authors showed that these lanes are repeatedly observed from 70° to 130° CML and 265° to 335° CML for the inbound data, and from 82° to 142° CML and 253° to 323° CML for the out-bound data. Higgins et al. [1995] analyzed possible effects due to solar wind variations and found that the occurrence of the lanes appeared to be independent of periods of low or high solar wind densities. Further investigation by Higgins et al. [1998] provided an analysis of the latitudinal structure of the Jovian hectometric emission using Voyager, Ulysses and Galileo observations. The combined data showed remarkably similar HOM features, both in latitude and in CML, providing the longevity and the stability of Jupiter’s HOM emission.
[6] The Galileo mission to Jupiter allowed the attenuation
bands to be reinvestigated by Gurnett et al. [1998]. The attenuation at the center frequency was found to vary from about 3 dB, which is the limit below which the band cannot be detected, to more than 30 dB, with enhancements at the upper or lower edge of the attenuation band. Over a period of two years, the HOM intensity extinction was detected about 25% of the time. Gurnett et al. [1998] suggested a model where the attenuation is caused by coherent scattering from short‐ wavelength density fluctuations or shallow‐angle reflection from field‐aligned density irregularities near the Io L shell. In this model the attenuation band occurred as the raypath from a high‐latitude cyclotron maser source passes approxi-mately parallel to the magnetic field near the northern or southern edges of the Io L‐shell. Density irregularities in the Io L‐shell are related to large density gradients which exist near the inner edge of the Io torus. If these density structures are aligned along the magnetic field then strong reflections would be expected when a radio wave is incident at a small angle to the magnetic field. The authors also reported that the center frequency of this band usually occurs in the frequency range from∼1 to 3 MHz, and it varies systematically with the rotation of Jupiter with two peaks in frequency per rotation. The first peak was found to occur at a central meridian lon-gitude of about 50°, and the second one at about 185°. The peak at CML of 50° is attributed to radiation from a southern hemisphere source and the peak at 185° from a northern hemisphere source. More recent work by Boudjada et al. [2001] combining Wind/WAVES and Galileo/PWS data found features at specific longitudes comparable to those reported by Gurnett et al. [1998].
[7] During the Cassini gravity assist flyby of Jupiter in
2000, it was possible to obtain simultaneous observations of the HOM attenuation bands with the Galileo and Cassini spacecrafts. Menietti et al. [2003] carried out a ray tracing study of the radio emissions with the aim to determine the location of the attenuation lanes. The ray tracing was applied for multiple frequencies and source regions in a magneto-sphere that includes an Io L‐shell filled with plasma. The half width of the density distribution perpendicular to the magnetic field line and the central plasma density of the Io L‐shell were fitting parameters. The authors used simulta-neous Galileo and Cassini observations of attenuation lanes at numerous frequencies and radial distances extending to 140 RJto place constraints on the model parameters. Menietti
[1998] where wave refraction can produce the attenuation lanes.
[8] In this paper we report on a statistical study of the
attenuation band observed by the RPWS experiment onboard the Cassini spacecraft during the Jupiter flyby. In section 2 we consider the spectral characteristics of the attenuation band, and in section 3 we discuss the relationship between this phenomenon and observational parameters, specifically the central meridian longitude and the spacecraft magnetic lati-tude. Our results are discussed in section 4 and summarized in section 5.
2.
Spectral Characteristics of the Attenuation
Band
[9] The RPWS experiment recorded Jovian radio
emis-sions during the Cassini flyby of Jupiter. The capability of the experiment allowed a frequency coverage from a few hertz to 16 MHz with a large dynamic range of about 80 dB [Gurnett et al., 2004]. Jovian radio components (DAM, HOM, and KOM) were regularly observed several weeks before and after the closest approach to the planet on 30 December 2000 at a distance of 137 Jovian radii. Detailed spectral features have been reported [Kurth et al., 2001; Lecacheux, 2001; Lecacheux et al., 2001] using the combination of the High Frequency Receiver (HFR), which is tunable from 125 kHz to 16 MHz, with a bandwidth of 25 kHz, and the Wide Band Receiver (WBR), which can analyze the given bandwidth with a spectral resolution of about 100 Hz. In this analysis we study the HFR dynamic spectra where the attenuation band has been almost continuously observed in the frequency range from 300 kHz to∼4 MHz.
2.1. Method of Data Analysis
[10] In this investigation we study the Jovian radio dynamic
spectra recorded by RPWS experiment from 20 November 2000 to 13 January 2001. During this period, the space-craft went from more than 500 RJfrom Jupiter to a closest
approach distance of 137 RJon 30 December 2001, and back
to about 250 RJ. The spacecraft local time varied between
11 LT and 19 LT providing coverage primarily in the after-noon sector of the planet. The attenuation bands are divided into three local time intervals [10.0‐13.2 LT], [13.6– 16.5 LT], and [16.7–20 LT] corresponding to the periods when the spacecraft approached, encountered, and left the planet. We analyze the“daily” variations of the attenuation band and the corresponding observational parameters: (1) the observation time (year, month, day, day of the year, hours, and minutes), (2) the center frequency, (3) the distance between the planet and the spacecraft, (4) the magnetic lati-tude, (5) the local time, and (6) the central meridian longitude of the spacecraft. For our analysis we use about 123 Jovian rotations to examine the variations of the attenuation band from which we derive more than 3500 points.
2.2. General Aspects
[11] The sensitivity of the RPWS experiment permitted the
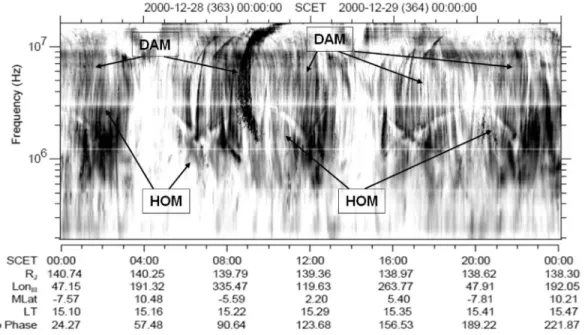
attenuation bands to be detected at a far distance from Jupiter, at least several weeks before the closest approach period. Figure 1 shows a typical dynamic spectrum recorded two days before the closest approach to the planet. The detected Jovian radio emission is displayed versus time (UT, hori-zontal axis) and frequency (Hz, vertical axis). In the spectrum above 100 kHz one can see the hectometric (100 kHz to about Figure 1. Dynamic spectrum recorded by the Cassini Radio and Plasma Wave Science (RPWS)
experi-ment on 28 December 2000. The attenuation band appears as incomplete sinusoid traces occurring when the northern (200° central meridian longitude (CML)) and southern (40° CML) magnetic field axis is toward the observer. Both traces cross each other in the equatorial plane of the planet (e.g., 06:30, 12:00, and 17:00 UT). Interesting is the Jovian decametric arc (associated with the so‐called Io‐D source), observed at about 08:40 UT, which comes down (up to about 2 MHz) to overlap the attenuation band. The horizontal attenuation line at about 3 MHz is an instrument noise effect that is subtracted out of the data.
BOUDJADA ET AL.: JOVIAN HECTOMETRIC EMISSIONS ATTENUATION BAND A11208 A11208
3 MHz) and the decametric (5 MHz to 16 MHz) radio emissions. These emissions are principally modulated by the planetary rotation which is of the order of 10 h. One full Jovian rotation recorded on 28 December 2000 is shown in Figure 1 in the time interval between 04:00 and 14:00 UT. Typical attenuation bands are partially seen on the dynamic spectrum of Figure 1. The outline and the trace of the atten-uation band on the dynamic spectrum appear as an incomplete sinusoid. During a full Jovian rotation one observes a suc-cession of two incomplete sinusoids associated with the northern and the southern hemispheres. These sinusoids cross each other at about 06:15, 11:45, and 16:45 UT as displayed in Figure 1. These intersections correspond to periods when the spacecraft is in the Jovian magnetic equator plane, i.e., the spacecraft magnitude latitude is almost equal to zero.
[12] In the following analysis, we consider that the
atten-uation band belongs to the northern hemisphere and southern hemisphere when the corresponding CML is in the range 60°–330° and 330–60°, respectively, as reported by Ortega‐ Molina and Lecacheux [1991].
2.3. Spectral Morphological Features
[13] The analysis of the attenuation band leads us to
dis-tinguish different spectral aspects showing a dependence on the spacecraft position with regard to the Jovian magnetic equator. These types of attenuation band are linked to the way the intensity level of the emission is partially or completely attenuated, or sometimes overlapped by other emissions like Jovian decametric emissions or Type III solar radio bursts.
[14] 1. The first type, which is the most often observed one,
exhibits a total intensity extinction of HOM emission as shown in Figure 1 when a given hemisphere is observed. These features have been reported in several studies, partic-ularly observations using the Galileo spacecraft [see Gurnett
et al., 1998, Figure 4; Menietti et al., 2003, Figure 1a]. However, the capabilities of the RPWS experiment enables close to the Jovian magnetic plane the observation of atten-uation bands simultaneously in both hemispheres (i.e., during a given time interval). This can be seen in Figure 1, where it is interesting to note that such simultaneous attenuation bands cover a magnetic latitude of at least∼7 °.
[15] 2. The second type is similar to the previous one except
it shows an “open” incomplete sinusoid as displayed in Figure 2. These features exhibit a large frequency increase reaching values of about 5 MHz as one can see in the following time intervals: 14:00–17:00 UT (Figure 1), 08:00– 12:00 UT (Figure 2), 19:00–22:00 UT (Figure 2), and 07:00– 09:30 UT (Figure 4). The HOM intensity extinction related to the open sine curve are usually associated with the northern hemisphere (corresponding CML between 60° and 330°). This feature is not observed (see Figures 1, 2, and 4) in emission from the southern hemisphere (CML in the range 330°–60°).
[16] 3. The third type concerns the overlap of the
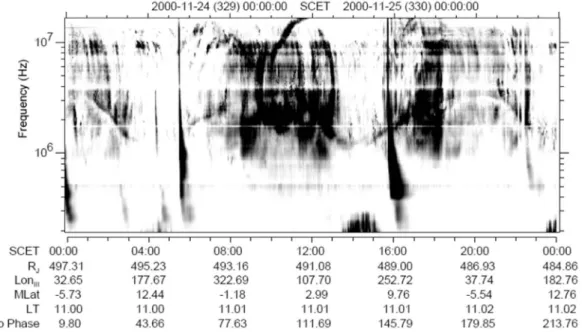
attenua-tion band by Solar or Jovian decametric emissions. Type III solar bursts, like the Jovian Io‐controlled emissions, are not subject to the intensity extinction despite their occurrences at frequencies lower than 3 MHz. Both external (like Type III burst) and internal (like Io‐D source) emissions are not attenuated. The location of the emission source (on the Sun or on Jupiter) with regard to the Io torus is essential. Type III solar bursts in Figure 3 appear to cover during short time duration the attenuation band at about 05:30 and 15:45. Also a similar effect is shown in Figure 1 in the time interval between 08:45 and 10:45 where a spectral arc is superposed on the attenuation band. Values reached by the central meridian longitude and the Io phase lead us to believe that this arc belongs to the so‐called Io‐D source associated with the Figure 2. The attenuation band shows an open incomplete sinusoid (indicated by horizontal dotted
arrows), which exhibits a large frequency increase reaching values of about 5 MHz, as one can see at time intervals 08:00–12:00 and 19:00–22:00 UT. These intensity extinction features are associated with the hectometric (HOM) emissions coming from the northern hemisphere; the corresponding CML ranges are 142°–287° and 182°–290°, respectively.
Jovian decametric emission. The central meridian longitude and the Io phase parameters for the Io‐D source are in the ranges 350°–60° and 95°–110°, respectively. The complete spectral shape of the Io‐D source was reported for the first time by Lecacheux et al. [1998, Figure 2]. The ground‐based observations show that Io‐D source is left‐hand elliptically polarized [Boudjada and Genova, 1991] and is therefore emitted from the southern hemisphere of the planet. Type III solar bursts as well as Io‐D arcs have similar behavior in the
way they overlap the attenuation band. This is unexpected because the Io‐controlled source is emits from the auroral zone of the Jovian magnetosphere. The hollow cone beam of Io‐D source does not seem to be subject to intensity extinction as the HOM emissions do, at the same frequencies.
[17] 4. The fourth type exhibits an enhancement of the
“edges” or “borders” of the attenuation band. An example is shown in Figure 4 at four time intervals 01:00–04:00, 11:00– 14:00, 16:00–18:00, and 21:30–23:00. It is evident that this Figure 3. A more rare case of a nearly complete sinusoid trace of the attenuation band. This trace may be
only associated with the southern hemisphere because the intensity extinction at a frequency of about 2.5 MHz occurs when the southern magnetic field of the planet is tilted toward the observer (e.g., ∼40° CML at 20:00 UT). Also a Type III solar burst, like the Jovian decametric arc in Figure 1, overlaps the attenuation band.
Figure 4. Cases of intensity enhancements that occur on the edge of the attenuation band, as shown at four time intervals: 01:00–04:00, 11:00–14:00, 16:00–18:00, and 21:30–23:00 UT.
BOUDJADA ET AL.: JOVIAN HECTOMETRIC EMISSIONS ATTENUATION BAND A11208 A11208
enhancement is linked to the attenuation band because it appears in one edge of the attenuation and disappears on the other one.
[18] The different types of attenuation bands are linked
to HOM emission coming from the northern or southern
hemisphere. The maximum frequency of the sine curve is usually connected to the time when the tip of the Jovian magnetic axis, in the northern or the southern hemisphere, is tilted toward the observer. The maximum frequency of intensity extinction is associated with the attenuation of the HOM emission coming from the southern hemisphere or the northern hemisphere, as sketched in Figure 5. At the magnetic equator plane, the sine curves of the two hemispheres overlap. The rare case of Figure 3 may be due to a sine curve of HOM emissions only coming from the southern hemisphere. This “trace” of attenuation band is observed despite spacecraft magnetic latitudes in the order of 10°.
3.
Attenuation Band Dependence on Jovian
Magnetic Field
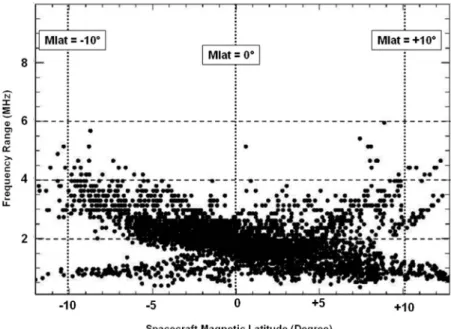
3.1. Dependence on Spacecraft Magnetic Latitude [19] Figure 6 shows the variation of the frequency,
asso-ciated with the attenuation bands, versus the spacecraft magnetic latitude. Each point indicates the frequency and the corresponding magnetic latitude where the extinction of the HOM emission has been observed. The frequency range of the attenuation band is found, on average, between 0.5 MHz and 4 MHz when the magnetic latitude varies between−12.0° and +13°. Two parts can be seen in Figure 6, one that falls in frequency from−13° to +13° magnetic latitude, and another one that rises in frequency from−13° to +13°. They cross at the magnetic equator plane.
[20] The first component shows a systematic intensity
extinction of the HOM emission between −5° and +5° of magnetic latitude. A drift rate in the order of−0.125 MHz/ degree can be derived from point distributions which reveal some symmetric ways around the magnetic equator. This extinction latitude range (of about 10°) gives an idea on the thickness of the region which can be regarded as sort of a screen between the source and the observer. Outside this region, the HOM emission attenuation is randomly scattered and distributed between−12° and −5° (in the frequency range 2–4 MHz), and regularly distributed from +5° to 12 (in the frequency range 0.5–2 MHz). The second component has a constant variation at latitudes lower than −5° which is fol-lowed by a positive drift rate of about +0.130 MHz/degree between−5° and +12°. At magnetic latitude higher than 5°, the second component exhibits a scattering in frequency of the points below∼6 MHz.
3.2. Dependence on Central Meridian Longitude [21] The dependence of the attenuation band on the Jovian
magnetic field is shown in Figure 7. Each point specifies the frequency and the corresponding CML at which the Jovian hectometric emissions disappear. It is interesting to note that the two specific central meridian longitudes∼20° and ∼180° are close to the longitudes of the tip of the magnetic dipole in the southern hemisphere (40° CML) and in the northern hemisphere (200° CML), respectively. The maximum fre-quencies are, on average, about 2.5 and 3.0 MHz in the southern and northern hemispheres, respectively. According to Figure 7 the attenuation of the HOM beam is found to be asymmetric when we compare both hemispheres.
[22] The intensity extinction zone of the northern
HOM emission may be divided into two parts, upper and lower, corresponding to the frequency ranges 1.5–3.0 and Figure 5. A cartoon that shows how the HOM intensity
extinction associated with the northern (NP) or the southern (SP) hemisphere is observed: (a) the most common case where only parts of the attenuation band are detected, (b) the case of Cassini RPWS observations (see Figures 1 and 4) when the spacecraft is close to the magnetic equator plane, and (c) the rare case in Figure 3 where the attenuation band associated with the northern hemisphere is absent and only a continuous sine curve linked to the southern hemi-sphere is recorded.
0.5–1.0 MHz, respectively. A large scattering of the points is observed around the magnetic axis in particular in the frequency range between 2 and 4 MHz. At low frequency (around 1 MHz) the emission is systematically attenuated in CML between 70° and 320°. The attenuation band of the southern hemisphere exhibits a domain covering a thin
band-width between 2 and 3 MHz. A slight dissymmetry is noted in the attenuation band of the southern hemisphere at the longitude intervals 0°– 50° and 320°–360°. Also the attenu-ation only affects the upper frequencies of HOM emission, and not the lower one.
Figure 6. Variation of the frequency associated with the attenuation band versus the spacecraft magnetic latitude. Each point indicates the frequency and the magnetic latitude where the extinction of the HOM emis-sion is observed. Two components can be seen, one that falls in frequency from−13° to +13° magnetic lat-itude, and another one that rises in frequency from−13° to +13°. Close to the magnetic equatorial plane these two components overlap.
Figure 7. Variation of the attenuation band frequency versus the central meridian longitude. Each point specifies the frequency and the CML at which the Jovian radio emissions disappear. We use the following criteria (as suggested by Ortega‐Molina and Lecacheux [1991]) to distinguish between both hemispheres. HOM radiation emitted by the northern hemisphere is mainly right‐hand circular polarized and occurred in the CML range between 60° and 330°, and the southern hemisphere is mainly left‐hand circular polarized and occurred in the CML ranges 330°–360° and 0°–60°.
BOUDJADA ET AL.: JOVIAN HECTOMETRIC EMISSIONS ATTENUATION BAND A11208 A11208
[23] However one has to emphasize the fact that the HOM
intensity extinction in the CML interval 100°–300° and in the frequency range 300 kHz to 1 MHz is probably due to the Jovian hectometric radiation emitted from the southern hemisphere. This feature has been also discussed in section 2.3 and is clearly seen in Figure 3 where only one hemi-sphere (the southern hemihemi-sphere) is detected. It is important to note that our result is in agreement with those reported by Higgins et al. [1998] particularly at frequencies lower than 1.3 MHz. The separation between the northern and southern hemispheres are denoted by intensity extinction at CMLs about 90° and 320°.
4.
Discussion
[24] The analysis of the attenuation band at first requires a
description of the different morphological aspects of such phenomenon. We show that the HOM intensity extinction is observed during several weeks during the Cassini flyby. The capabilities of the RPWS experiment allow us to analyze the attenuation band in a broad frequency range, from few kHz up to 7 MHz. In the following we attempt to discuss three aspects of this phenomenon: (1) the model which provides a best fit to the observations, (2) the HOM beam at low frequencies, and (3) some characteristics of the plasma medium at the origin of the HOM intensity extinction.
4.1. Origin of the Attenuation Band
[25] The attenuation band is a phenomenon which has been
regularly observed by all missions to Jupiter (Voyager, Ulysses, Galileo, and Cassini). The constancy and the durability of the intensity extinction in the Jovian hectometric emission imply the presence of a plasma between the source and the observer which have a nearly constant electronic density. This plasma is localized in the Io torus and in Io L shell according to models proposed by Lecacheux [1981] and Gurnett et al. [1998], respectively.
[26] The analysis of the attenuation band occurrence during
more than 7 weeks of the Cassini flyby shows that this phe-nomenon depends on two observational parameters: the central meridian longitude and the magnetic latitude. The variation of the occurrence of the intensity extinction versus the CML suggests a Jovian magnetic field effect. This dependence can be interpreted as a control of Jovian hecto-metric radiation by the planetary magnetic field which involves HOM intensity extinction as proposed by Gurnett et al. [1998]. The first difficulty of this model is how to keep and to maintain the plasma irregularity constant along the Io L shell (principally in the direction perpendicular to the Io torus plane) with an amount of plasma frequency of about 3 MHz, as in the Io torus. The second difficulty refers to the geometric conditions (magnetic field tangency condition) between the source, the irregularity in the Io L shell, and the observer. In the case of Lecacheux’s model, these two diffi-culties are not encountered. There is no particular geometry between the HOM source and the observer since the HOM beam (in the frequency range 3 MHz to 300 kHz) crosses the Io torus in the way that the emission is refracted before reaching the observer. The plasma density is almost constant in the environment of the Io satellite and along its trajectory around Jupiter, i.e., in the Io torus. Also, the volcanic activity which may expand the electronic density in the plasma torus
giving rise to an attenuation of the emission at frequencies higher than 3 MHz, as reported in our study.
4.2. HOM Intensity Attenuation at Low Frequency [27] It is well known that the Jovian hectometric emissions
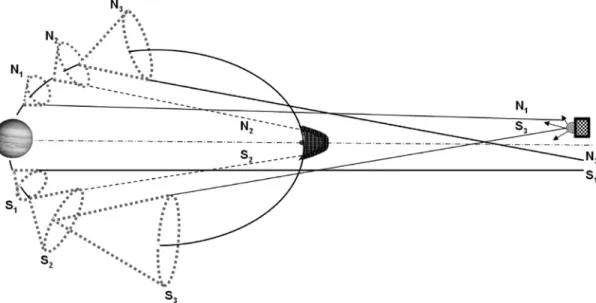
cover a frequency range from about 200 kHz to 4 MHz. The previous investigations concerning the attenuation bands mainly reported the attenuation of the higher‐frequency spectrum of HOM radiation; higher than 500 kHz [e.g., Higgins et al., 1995, Figure 2; Gurnett et al., 1998, Figure 4]. This means that only the periodic and repetitive attenuation due to the emission from the northern or the southern hemi-spheres has been reported. In our study, we show that close to the magnetic equator sine curves of both hemispheres can simultaneously be observed. This particular feature occurs when the observer is far from the planet (like in the case of the Cassini spacecraft during the period used in this study) and vanishes closer to the planet (like in the case of the Galileo spacecraft). The geometric configuration (source to observer) depends on the distance to the planet and the magnetic lati-tude of the spacecraft. Close to the planet only emission cones linked to one hemisphere are subject to an intensity attenua-tion. And far from the planet (>100 Jovian radii), the HOM beam may be the composition of emissions coming from both hemispheres for a spacecraft located a few degrees offset from the magnetic equator plane. Consequently the HOM emission exhibits right‐ and left‐hand circular polarizations emitted from the northern and southern hemispheres, respectively. Such HOM polarization features have been reported in the literature [Ortega‐Molina and Lecacheux, 1991; Reiner et al., 1995] but never in the case of an emission which is subject to an intensity extinction. The HOM beams coming from each hemisphere overlap close to the magnetic equator. In such a geometric configuration the HOM spectrum may be the composition of two parts: a first part emitted by the northern/southern hemisphere from 3–4 MHz down to ∼1.5 MHz, and a minor one emitted by the southern/northern hemisphere in the frequency range from 1 MHz to about 300 kHz. In this frequency boundary between 1.5 and 1 MHz, we should observe a mixture of polarization. A cartoon of the emission geometry that can account for the Jovian hecto-metric emissions at low frequencies is shown in Figure 8. 4.3. Characteristics of the Refracting Plasma Medium
[28] Regular and repetitive intensity extinction occurs in
the Jovian hectometric emission at specific CML ranges for magnetic latitudes between −12° and +12°. This CML dependence has been reported by several authors using data collected by Voyager [Ladreiter and Leblanc, 1990; Higgins et al., 1995], Galileo [Gurnett et al., 1998] and Cassini [Menietti et al., 2003]. However, despite this dependence, it is evident that a clear asymmetry exists when one combines the intensity extinction of HOM emission radiated from the northern and southern hemispheres. Hence it seems that the behavior of the attenuation band is different at positive and negative magnetic latitudes. The HOM sources located in the southern hemispheres are subject to a “systematic attenuation” of their spectra. We have shown samples where the attenuation band is observed during a full Jovian rotation despite positive magnetic latitudes (see Figure 3). The “screen” medium at the origin of this attenuation seems to be temporally and spatially stable. However in the case of the
northern HOM sources the screen medium appears as unstable because of the scattered measurements in the CML interval 100°–300° and in the frequency range from 1.5 to 3 MHz.
[29] Yet the attenuation band may be due to the
combina-tion of two plasma media: principally the Io torus and some plasma enhancements at specific central meridian longitudes. The major effect can be attributed to the Io torus plasma which provides a stable medium where the main HOM intensity extinction occurs. A minor contribution could result from the presence of “unstable” plasma medium associated with specific CMLs where some particular phenomena can occur, like volcanic activity [Menietti et al., 2001]. Such effects give rise to irregularities in the Io torus involving an enhancement of the electron density. The HOM intensity extinction at the highest frequencies (more than 3 and up to 5 MHz) can be interpreted as an augmentation of the electron density irregularities in the medium where the HOM radio waves are refracted. Also such volcanic activities can create the asymmetry in the Io torus because of irregular volcano locations on the surface of Io.
5.
Conclusion
[30] The study of the spectral variation of the attenuation
band leads us to analyze its morphology and its dependence on the Jovian magnetic field. We show that the extinction in intensity of the Jovian hectometric emissions have spectral variable aspects during the time interval from 20 November 2000 to 13 January 2001. The analysis of the attenuation band leads us to distinguish different spectral aspects showing a dependence on the spacecraft position with regard to the Jovian magnetic equator. These types of attenuation band are linked to the way the intensity level is partially or completely
attenuated, or sometimes overlapped by other emissions like Jovian decametric emissions or Type III solar radio bursts. The regular and systematic observations of the attenuation band suggest that the plasma medium at the origin of these features is steady and stable. The Io torus may be considered as the most probable plasma medium where the HOM emission is refracted through its raypath propagation.
[31] Acknowledgments. The authors are grateful to D. A. Gurnett and W. S. Kurth, principal investigator and co‐investigator of the RPWS exper-iment on board Cassini, for making the data available for this work.
[32] Philippa Browning thanks the reviewers for their assistance in evaluating this paper.
References
Alexander, J. K., M. D. Desch, M. L. Kaiser, and J. R. Thieman (1979), Latitudinal beaming of Jupiter’s low frequency radio emission, J. Geo-phys. Res., 84, 5167–5174.
Barrow, C. H., and M. D. Desch (1989), Solar wind control of Jupiter’s hectometric radio emission, Astron. Astrophys., 213, 495–501. Bose, S. K., S. Sarkar, and A. B. Bhattacharyya (2008), Jovian decametric
radio emission: An overview of the planetary radio astronomical observa-tions, Indian J. Radio Space Phys., 37, 77–108.
Boudjada, M. Y., and F. Genova (1991), The left‐hand polarization sense of the Jovian decameter radiation, Astron. Astrophys. Suppl., 91, 453–467.
Boudjada, M. Y., P. H. M. Galopeau, and H. O. Rucker (2001), Jovian hec-tometric beam observed by PWS and WAVES experiments on board Galileo and Wind spacecraft, Planet. Space Sci., 49, 1151–1158. Carr, T. D., M. D. Desch, and J. K. Alexander (1983), Phenomenology of
magnetospheric radio emissions, in Physics of the Jovian Magneto-sphere, edited by A. J. Dessler, pp. 226–284, Cambridge Univ. Press, New York.
Desch, M. D., and T. D. Carr (1974), Decametric and hectometric observa-tions of Jupiter from the RAE‐1 satellite, Astrophys. J., 194, L57–L59. Galopeau, P. H. M., and M. Y. Boudjada (2005), Solar wind control of Jovian auroral emissions, J. Geophys. Res., 110, A09221, doi:10.1029/ 2004JA010843.
Figure 8. A cartoon of the emission geometry that can account for the Jovian hectometric emissions at low frequency when the Cassini spacecraft is located a few degrees offset from the magnetic equator plane. The HOM emission generated in the northern/southern hemisphere (i.e., right‐hand/left‐hand circular polarized) is recorded (hollow cone N1/S3), attenuated (hollow cone N2/S2), and not detected (hollow cone N3/S1). In
such geometric configurations the HOM spectrum may be composed of two parts: one emitted by the northern hemisphere from 3–4 MHz down to about 1.5 MHz and a second minor one emitted by the southern hemisphere in the frequency range from 1 MHz to about 300 kHz.
BOUDJADA ET AL.: JOVIAN HECTOMETRIC EMISSIONS ATTENUATION BAND A11208 A11208
Green, J. L., J. R. Thieman, C. Higgins, S. F. Fung, R. M. Candey, and L. Aist‐Sagara (1992), Lane features in Jovian hectometric radio emis-sions, in Planetary Radio Emissions III, edited by H. O. Rucker, S. J. Bauer, and M. L. Kaiser, pp. 91–103, Austrian Acad. of Sci. Press, Vienna.
Gurnett, D. A., W. S. Kurth, J. D. Menietti, and A. M. Persoon (1998), An unusual rotationally modulated attenuation band in the Jovian hectometric radio emission spectrum, Geophys. Res. Lett., 25, 1841–1844.
Gurnett, D. A., et al. (2004), The Cassini radio and plasma wave science investigation, Space Sci. Rev., 114, 395–463.
Higgins, C. A., J. L. Green, J. R. Thieman, S. F. Fung, and R. M. Candey (1995), Structure within Jovian hectometric radiation, J. Geophys. Res., 100, 19,487–19,496.
Higgins, C. A., J. R. Thieman, S. F. Fung, J. L. Green, and R. M. Candey (1998), Latitudinal structure within Jovian hectometric radiation, J. Geophys. Res., 103, 26,679–26,686.
Kaiser, M. L., (1977), A low frequency radio survey of the planets with RAE 2, J. Geophys. Res., 82, 1256–1260.
Kaiser, M. L., M. D. Desch, A. C. Riddle, A. Lecacheux, J. B. Pearce, J. K. Alexander, J. W. Warwick, and J. R. Thieman (1979), Voyager space-craft radio observations of Jupiter: Initial cruise results, Geophys. Res. Lett., 6, 507–510.
Kimura, T., F. Tsuchiya, H. Misawaa, A. Moriokaa, and H. Nozawa (2008), Occurrence and source characteristics of the high‐latitude components of Jovian broadband kilometric radiation, Planet. Space Sci., 56, 1155–1168.
Kurth, W. S., S. J. Bolton, D. A. Gurnett, and S. Levin (1997), A determi-nation of the source of Jovian hectometric radiation via occultation by Ganymede, Geophys. Res. Lett., 24, 1171–1174.
Kurth, W. S., G. B. Hospodarsky, D. A. Gurnett, A. Lecacheux, P. Zarka, M. D. Desch, M. L. Kaiser, and W. M. Farrell (2001), High‐resolution observations of low‐frequency Jovian radio emissions by Cassini, in Planetary Radio Emissions V, edited by H. O. Rucker, M. L. Kaiser, and Y. Leblanc, pp. 15–28, Austrian Acad. of Sci. Press, Vienna. Ladreiter, H. P., and Y. Leblanc (1989), Jovian hectometric radiation:
Beaming, polarization, source extension, and solar wind control, Astron. Astrophys., 226, 297–310.
Ladreiter, H. P., and Y. Leblanc (1990), Source location of the Jovian hectometric radiation via ray‐tracing technique, J. Geophys. Res., 95, 6423–6435.
Ladreiter, H. P., P. Zarka, and A. Lecacheux (1994), Direction finding study of Jovian hectometric and broadband kilometric radio emissions: Evidence for their auroral origin, Planet. Space Sci., 42, 919–931. Lecacheux, A. (1981), Ray tracing in the Io plasma torus: Application to
the PRA observations during Voyager 1’s closest approach, J. Geophys. Res., 86, 8523–8528.
Lecacheux, A. (2001), Radio observations during the Cassini flyby of Jupiter, in Planetary Radio Emissions V, edited by H. O. Rucker, M. L. Kaiser, and Y. Leblanc, pp. 1–14, Austrian Acad. of Sci. Press, Vienna.
Lecacheux, A., B. Moller‐Pedersen, A. C. Riddle, J. B. Pearce, A. Boischot, and J. W. Warwick (1980), Some spectral characteristics of the hectometric Jovian emission, J. Geophys. Res., 85, 6877–6882. Lecacheux, A., M. Y. Boudjada, H. O. Rucker, J. L. Bougeret, R. Manning,
and M. L. Kaiser (1998), Jovian decameter emissions observed by the Wind/WAVES radioastronomy experiment, Astron. Astrophys., 329, 776–784.
Lecacheux, A., W. S. Kurth, and R. Manning (2001), Sub‐second time scales in Jovian radio emissions as measured by Cassini/RPWS: Compar-ison with ground‐based observations, in Planetary Radio Emissions V, edited by H. O. Rucker, M. L. Kaiser, and Y. Leblanc, pp. 29–40, Austrian Acad. of Sci. Press, Vienna.
Menietti, J. D., and M. J. Reiner (1996), Modeling of Jovian hectometric radiation source locations: Ulysses observations, J. Geophys. Res., 101, 27,045–27,052.
Menietti, J. D., D. A. Gurnett, W. S. Kurth, J. B. Groene, and L. J. Granroth (1998), Radio emissions observed by Galileo near Io, Geophys. Res. Lett., 25, 25–28.
Menietti, J. D., D. A. Gurnett, J. R. Spencer, and J. A. Stansberry (2001), Relationship between Jovian hectometric attenuation lanes and Io volca-nic activity, Radio Sci., 36, 1723–1731.
Menietti, J. D., D. A. Gurnett, G. B. Hospodarsky, C. A. Higgins, W. S. Kurth, and P. Zarka (2003), Modeling radio emission attenuation lanes observed by the Galileo and Cassini spacecraft, Planet. Space Sci., 51, 533–540.
Ortega‐Molina, A., and A. Lecacheux (1991), Polarization of Jovian hecto-metric emission, J. Geophys. Res., 96, 11,441–11,453.
Reiner, M. J., J. Fainberg, and R. G. Stone (1993), Source characteristics and locations of Jovian hectometric radio emissions from the northern Jovian hemisphere, Geophys. Res. Lett., 20, 321–324.
Reiner, M. J., M. D. Desch, M. L. Kaiser, R. Manning, J. Fainberg, and R. G. Stone (1995), Elliptically polarized bursty radio emissions from Jupiter, Geophys. Res. Lett., 22, 345–348.
Reiner, M. J., M. L. Kaiser, and M. D. Desch (2000), Long‐term behavior of Jovian bKOM and nKOM radio emissions observed during the Ulysses‐Jupiter encounter, Geophys. Res. Lett., 27, 297–300.
Warwick, J. W., et al. (1979), Voyager‐1 planetary radio astronomy obser-vations near Jupiter, Science, 204, 995–998.
M. Y. Boudjada, W. Macher, H. O. Rucker, and W. Voller, Space Research Institute, Austrian Academy of Sciences, Graz A‐8042, Austria. ([email protected]; [email protected]; wolfgang. [email protected]; [email protected])
P. H. M. Galopeau, Laboratoire Atmosphères, Milieux, Observations Spatiales, CNRS, IPSL, F‐78280 Guyancourt, France. (patrick.galopeau@ latmos.ipsl.fr)
A. Lecacheux, Laboratoire d’Etudes Spatiales et d’Instrumentation en Astrophysique, Observatoire de Paris, F‐92195 Meudon, France. (alain. [email protected])
N. Mebarki, Laboratoire de Physique Mathematique et Subatomique, Mentouri University, Constantine, 25000, Algeria. ([email protected])