1
Artificial Intelligence Infrastructure into Material Attributes Insights
by Zihuai Liu
B.S., Civil Engineering, Tongji University, 2010
M.S., Civil Engineering, University of Illinois at Urbana and Champaign, 2011 Submitted to the MIT Sloan School of Management and the Department of Civil and Environmental Engineering in Partial Fulfillment of the Requirements for the Degrees of
Master of Business Administration and
Master of Science in Civil and Environmental Engineering in conjunction with the Leaders for Global Operations Program at the
Massachusetts Institute of Technology May 2020
© 2020 Zihuai Liu. All rights reserved
The author hereby grants to MIT permission to reproduce and to distribute publicly paper and electronic copies of this thesis document in whole or in part
in any medium now known or hereafter created.
Signature of Author ... MIT Sloan School of Management and Department of Civil and Environmental Engineering May 8, 2020 Certified by ...
Roy Welsch, Thesis Supervisor Professor of Statistics and Management Science, MIT Sloan School of Management Certified by ...
John Williams, Thesis Supervisor Professor of Civil and Environmental Engineering Accepted by... Colette L. Heald, Chair Professor of Civil and Environmental Engineering, Graduate Program Committee Accepted by... Maura Herson, Assistant Dean, MBA Program MIT Sloan School of Management
2
3
Artificial Intelligence Infrastructure into Material Attributes Insights
ByZihuai Liu
Submitted to MIT Sloan School of Management on May 8th, 2020 in Partial Fulfillment of the
requirements for the Degrees of Master of Business Administration and Master of Science in Civil and Environmental Engineering
Abstract
The development of a biopharmaceutical manufacturing process involves an assessment of all possible sources of variation throughout each of the unit operations in the drive toward six sigma manufacturing. The primary goal of this project is to develop a novel way to assess the variation in raw materials attributes throughout the life-cycle of the material and gain insights about the correlation between material variation to process performance and product quality.
This thesis focuses on understanding the impact raw materials have on unit operations within biopharmaceutical manufacturing processes through machine learning techniques. To evaluate the impact of raw material attributes on process performance and exclude the variations explained by process operating parameters, a modeling framework is developed and tested. The framework contains three steps: (1) fitting models with only process operating data, (2) fitting models with process operating data and batch number information, (3) fitting models with
process operating and raw material attributes data. By comparing the performance measurements from 3 different models, insights of correlations between raw materials and process outcomes could be obtained.
Thesis Supervisor: Roy Welsch
Title: Professor of Statistics and Management Science
Thesis Supervisor: John Williams
4
5
Acknowledgements
I would like to start by thanking my advisors, Professor John Williams and Professor Roy Welsch for their continuous support and advice during my internship and their constructive feedback for this thesis. Thank you so much for your input and advice throughout this journey.
Also thank you so much for the incredible Amgen family, who welcomed me from day one, trusted me, and generously shared their deep industry knowledge to keep me going. Thank you Dollie Grajczak who helped all LGO interns with your warm heart. Thank you, Susan Burke, Ting Wang, and everyone else in the Material Science Team for all your help and support throughout the journey, this project quite literally would have been impossible without you. Thank you to all the Amgen LGO interns who gave me advice, tips, and guidance to help me catch up quickly and also thank you to all the extended Amgen LGO family for your insights, reviews, and friendship.
Thank you to the LGO program office and staff, especially Ted and Patty who gave me tremendous help before, during, and after the internship. To my fellow LGO family, I was constantly surprised by how amazing every one of you is and learn from you daily to become better – thank you.
Finally, thank you to my amazing family. Moving across the country or traversing the globe, you have been providing me with the biggest support I could ever get which keeps me from falling apart. Without you, I would not be able to do what I do. Thank you.
6
7
Table of Contents
Abstract ... 3 Acknowledgements ... 5 List of Figures ... 9 List of Tables ... 10 List of Equations ... 11 1 Introduction ... 12 1.1 Project Background ... 121.1.1 About Amgen Inc. ... 13
1.1.2 Biopharmaceutical and Material Sciences ... 14
1.2 Project Overview ... 15
1.2.1 Project Motivation and Opportunity ... 15
1.2.2 Goals of the Project ... 17
1.2.3 Significance of Study ... 18
1.2.4 Thesis Outline ... 18
2 Literature Review ... 20
2.1 Raw Materials ... 20
2.2 Data Analytics in Pharmaceutical ... 21
3 Research Methodology ... 23
8
3.1.1 Raw Material and Process Selection ... 24
3.1.2 Overview of Available Data ... 25
3.1.3 Selected Raw Materials and Processes ... 26
Step Recovery: Amount of product captured... 27
3.2 Data Collection and Preprocessing ... 27
3.2.1 Data Collection ... 27
3.2.2 Data Preprocessing... 29
3.2.3 Data Imputation ... 31
3.3 Data Exploration ... 33
3.4 Feature Engineering ... 36
3.5 Algorithmic Framework Design... 38
3.6 Model Performance Metrics ... 42
4 Results ... 44
4.1 Model Performance ... 44
4.1.1 Predictive Power Analysis of Models ... 45
4.1.2 Feature Importance Evaluation ... 46
4.2 Model Framework of Evaluating Raw Material Attributes ... 50
5 Conclusion and Future Recommendations ... 54
5.1 Findings and Business Applications ... 54
9
List of Figures
Figure 1-1 Typical Biopharmaceutical Process and Related Raw Materials ... 15
Figure 2-1 Managing raw materials in the QbD paradigm ... 21
Figure 3-1 Outline of The Data Available [15] ... 25
Figure 3-2 Data Matching Method by Lot Numbers ... 29
Figure 3-3 Data without Normalization in KNN [32] ... 32
Figure 3-4 Data with Normalization in KNN [32]... 33
Figure 3-5 Spread of Process 2 Performance ... 34
Figure 3-6 Spread of Raw Material 2 Attribute 1 ... 35
Figure 3-7 Scatterplot of Raw Material 2 Attribute 1 to Process 2 Performance Metric ... 36
Figure 3-8 Feature Engineer Process by Tree Algorithms... 37
Figure 3-9 Example of feature Importance from Random Forest ... 38
Figure 3-10 Model Generating Framework Flowchart ... 39
Figure 3-11 Example of correlation plot of raw material attributes with potential targets... 40
Figure 3-12 Example of k-fold validation with k = 5 [45] ... 42
Figure 4-1 Feature Importance for Process 1 from Random Forest ... 47
Figure 4-2 Feature Importance for Process 2 from Random Forest ... 48
Figure 4-3 Feature Importance for Process 3 from Random Forest ... 49
Figure 4-4 Three-step Modeling Framework ... 50
Figure 4-5 R2 Comparison of Three-step Modelling Framework for Process 1 ... 51
Figure 4-6 R2 Comparison of Three-step Modelling Framework for Process 2 ... 52
10
List of Tables
Table 3-1 Selected raw material and processes ... 27 Table 3-2 Model Measurement Metrics Definition ... 42 Table 4-1 Performance R2 and standard deviation for all the models trained. ... 45
11
List of Equations
Equation 3-1 ... 38 Equation 3-2 ... 43 Equation 3-3 ... 43 Equation 3-4 ... 4312
1 Introduction
The raw materials used in biopharmaceutical manufacturing include materials such as media and other chemical components used in cell culture and fermentation, excipients used in formulation of final drug products and single use equipment used for production [1]. The variation in the attributes of these raw materials can have a significant influence on process performance and product quality in the biopharmaceutical industry. For example, even small variations in trace elemental metals and impurities in media can have a strong impact on product quality, cell culture performance, batch duration, and titer [2]. In other cases, excess impurities of raw materials can be toxic to the process, but unexpected decreases in impurities may also have impacts as large as unexpected increases in impurities [3]. To consistently provide high quality medicine for the patients, it is very important to understand the impact of the variation in raw material attributes on process performance and product quality, and thus enhance the control over the manufacturing process. Amgen is at the forefront of implementing strategies for
understanding raw material attributes important to process performance and product quality attributes during product and process development. However, for legacy manufacturing processes where raw materials may not have been fully evaluated in a systematic way, a novel approach to assess the impact of raw material variabilities is needed. This thesis aims to develop a framework to evaluate the impact of raw material variabilities on process performance of biopharmaceutical manufacturing. The research is performed in cooperation between MIT Leaders for Global Operations and Amgen Inc.
1.1 Project Background
Material Science is a rising topic in biopharmaceutical manufacturing, as raw material potentially can be a significant source of variability, which would cause inconsistent process
13
performance, non-conformance, as well as productivity and product quality issues. Thus, there is a clear need to gain better understanding of raw materials related to manufacturing processes.
On the other hand, biotechnology firms like Amgen are paying extra attention in the digital revolution around the world and have been investing significant resources in data infrastructure and data-driven projects [4,5]. By nature of the pharmaceutical business, these firms have been keeping track of a rich amount of data throughout the manufacturing process. A comprehensive infrastructure has been built and implemented to monitor manufacturing
processes, and Amgen has partnered with AWS for its data services [6]. However, it has only been recently that raw material related data is starting to be actively utilized for understanding the impact raw materials have on process performance and proactively mitigating risks.
1.1.1 About Amgen Inc.
Amgen Inc. is an American multinational biopharmaceutical company founded in 1980. Headquartered in Thousand Oaks, California, Amgen has a global footprint with presence in approximately 100 countries and regions, as of December 2019 Amgen’s market capitalization exceeds $142 billion [7]. Amgen has six focused therapeutic areas which include cardiovascular disease, oncology, bone health, neuroscience, nephrology and inflammation [8].
Amgen also has a multinational manufacturing network, with plants within United States and its territories in Puerto Rico, Rhode Island, and California as well as international locations in Ireland, Netherlands and Singapore. In addition to these facilities, Amgen also utilizes contract manufacturing organizations for certain products [9].
Beyond multinational manufacturing network, Amgen has a diverse portfolio of medicines. The company's major products include Neulasta® (pegfilgrastim), Neupogen®
14
(filgrastim), Enbrel® (etanercept), Xgeva/Prolia® (denosumab), Aranesp® (darbepoetin alfa), Epogen® (Epoetin alfa), and Sensipar/Mimpara® (cinacalcet) [10]. Besides large molecule medicine, Amgen also has small molecule products like Kyprolis® (carfilzomib) [11].
1.1.2 Biopharmaceutical and Material Sciences
The general concept of "biotech" or "biotechnology" includes a wide range of
technologies for altering living organisms according to human purposes, cultivation of the plants, and modification of these through artificial selection and hybridization processes.
Biopharmaceutical manufacturing is one of the advanced usages of biotechnology which manufactures pharmaceutical drugs in and extracted from biological sources.
The product of biopharmaceutical manufacturing, a biologic, is defined as “a large molecule typically derived from living cells and used in the treatment, diagnosis, or prevention of disease. Biologic medicines include therapeutic proteins, DNA vaccines, monoclonal
antibodies, and fusion proteins” [12]. In 1919, the term “biotechnology” first appeared as “the interaction between biology and human technology for conversion of raw materials into socially valuable products” [13]. In the early 1950s, the discovery of the structure of DNA laid the foundation of modern biopharmaceutical manufacturing as most biologic medicines are developed and produced by genetically engineered living cells to produce the desired protein [13]. This technology enabled the production of molecules with considerably larger size and significantly more complex structure than molecules produced by traditional chemical synthesis processes.
Due to the size and complexity of large molecules, biologics are often sensitive to physical conditions (temperature, shear forces, chemical phase, and light) [14], and these
15
medicines are generally taken by injection, inhalation or infusion. Furthermore, manufacturing processes also need to be controlled carefully during the whole production cycle, and the raw materials utilized in each process are known to be have important impact on the processes.
Raw materials used in biopharmaceutical manufacturing include a variety of materials utilized in all steps of manufacturing. Ranging from cell culture media components, chemicals and excipients to product contact materials like single-use bags and equipment, raw materials can be a significant source of variation, where the variability is either in the chemical or physical properties of the material or both (Figure 1-1). Because of the wide range of material types and complex sources of variation, a comprehensive understanding of raw material variability is important yet challenging.
Figure 1-1 Typical Biopharmaceutical Process and Related Raw Materials
1.2 Project Overview
1.2.1 Project Motivation and Opportunity
Amgen Inc. has thousands of raw materials within the system, and a substantial network of raw material suppliers. Often, the direct suppliers will have their own suppliers from which they purchase starting materials or finished goods. This vast network adds additional complexity and is a source of variation. Biotech companies have been paying special attention to understand
16
their processes, but raw material variation is not always well characterized. Therefore, to better understand the variability in raw materials and its impact on process performance, a systematical way of evaluating raw materials is necessary.
While it is important to have a comprehensive understanding of all the raw material in the processes, due to the large number of raw materials used throughout the manufacturing
operations, the time and resources required to evaluate everything manually would be unrealistic. Furthermore, the supply chain with various processes and origins of the raw material acquired also contributes to the complexity of raw material evaluations. Therefore, a novel way of assessing raw materials is needed, and a data driven approach is being considered to solve this problem.
Artificial intelligence and machine learning have been hot topics for years with numerous applications in many industries. Although most of the concepts and techniques have been around for decades, it was not until the recent breakthrough of computational capability of computers and the explosive growth of the amount of data that enabled the wide use of this technology. By the nature of the business, biopharmaceuticals keep track of a lot of data during manufacturing processes, which serves as the foundation for the potential use of machine learning to gain insight of raw materials and their impact on process performance.
During a previous study conducted by a former LGO student, Maria Emilia Lopez Marino [15], the concept has been proved that machine learning could be used to predict certain process performance metrics by utilizing the data collected. And a web-based app was developed to enable proactive prediction of raw material performance in a process, however, this version of models includes many features which would not be available before production starts and could be improved by generating models with only raw material data for prediction. To continue the
17
journey of evaluating the impact of raw materials on process performance, this project was conducted as a follow-up.
1.2.2 Goals of the Project
Amgen has a goal to “serve patients by transforming the promise of science and
biotechnology into therapies that have the power to restore health or save lives” [16], therefore quality is essential in every aspect of the organization. A robust manufacturing process is the cornerstone of ensuring the quality of the medicines produced and raw materials are fundamental to manufacturing reliability. The goal of this project is to provide a data-oriented tool or
framework to better evaluate raw material attributes and harness the power of data to bridge the gap between raw material attribute knowledge and process performance.
This project is a continuation from the previous LGO thesis project and serves as part of the Amgen’s Data Science initiatives. Overall, the aim is to unleash the power of digitalization to advance manufacturing operation excellence which Amgen has long been focused on [17]. Furthermore, this project is forward looking in that it aims to leverage the data available and develop a method to proactively evaluate and monitor raw material variation.
The previous LGO thesis project has proved that through advanced modeling techniques, process and raw material data have the potential to be used on building a predictive model on desired process performance and gain insight. To further develop the achievement of previous work, this project will be focusing on developing a framework as a complementary tool for the current raw material evaluation process.
18 1.2.3 Significance of Study
Digital technology has already disrupted multiple industries and created tremendous changes in today’s business environment. Digital and data analytics are becoming a competitive advantage for more and more companies in traditional industries and have increasingly been a strategic topic for many leading biopharmaceutical companies [18]. With many already known opportunities from better understanding the impact of the quality attributes on the outcome of patients, to leveraging the data for better identifying the most productive cell clone, digital technology can further increase the productivity of the biopharma industry [15,19]. This project is an attempt to create a business scenario by developing a novel framework of gaining insight of raw material through digital technology and data analysis, thus enabling the ability to leverage data to gain enhanced insights about raw material variation and impact on process performance to proactively mitigating raw material related risks. On a higher level, this project also serves as part of Amgen’s digitalization strategy to maintain manufacturing excellence to serve patients.
1.2.4 Thesis Outline
This thesis is structured as follows: Chapter 1 presents a background and overview of the project, the company in the biopharma industry, focusing on both raw material science and digital technology. Chapter 2 presents the relevant literature which provides foundations of the project, and covers the previous work done to understand the raw material attributes variability and the machine learning techniques. Chapter 3 describes the methodologies utilized in this project and how the methodologies are used to develop predictive models. Model evaluating processes will also be illustrated by describing the metrics to evaluate the performance of the models. Chapter 4 explains the results of the models and how the models developed are being interpreted and provide insights to relevant processes. Chapter 5 concludes the thesis with
19
general findings and recommendations to Amgen. This is followed by potential business impact, future possibilities, and improvement opportunities.
20
2 Literature Review
This chapter gives an overview of raw materials in the biopharmaceutical/pharmaceutical industry as well as the previous work done to manage raw materials. Finally, data analytics is discussed for biotechnology.
2.1 Raw Materials
A raw material in biotechnology is a general term defined as “starting materials, reagents, and solvents intended for use in the production of intermediates or APIs (Active Pharmaceutical Ingredients)” by ICH [20], and there are biologically derived raw materials, chemically derived raw materials [21]. Based on the broad definition, there is a variety of different raw materials used in the pharmaceutical industry and each has its own source of potential variability that could impact the manufacturing process.
There are primarily three categories of variabilities in raw materials: (1) trace impurities, some of which may alter the quality of the therapeutics, (2) trace impurities that are themselves toxic to humans, (3) microorganism contaminants that lead to variabilities in bioburden of raw materials [22]. This project focuses on the first category of variabilities related to trace impurities that may alter the quality of biotherapeutics.
The sources of variations are diverse in the field of raw materials. The naturally derived (biologically-derived) raw materials can contain a large number of compounds like acid or putrescine[23], which could be a significant source of variability. Chemically derived raw materials can also contain impurities originating from the synthesis or mining of the material or that may be generated during storage through various degradation pathways [24]. Different raw
21
materials might have different impurities, and lot-to-lot variability can result in various impact on process performance.
Guideline have been established for quality control in the pharmaceutical industry, including raw material quality control requirements, which are outlined in the ICH Q7 Guideline [25]. It states that raw materials used in pharmaceuticals need to have the identity of each batch confirmed on receipt and a Certificate of Analysis (C of A) provided from the supplier. The C of A from the supplier is one important source of raw material data in this project. A key challenge is the large number of raw materials used in biopharmaceutical manufacturing. And a multistep Quality by Design (QbD) based approach has been proposed and shown in Figure 2-1 [26,27]. This project aims at creating a data driven approach to gain insight of raw material critical attributes.
Figure 2-1 Managing raw materials in the QbD paradigm
2.2 Data Analytics in Pharmaceutical
Data driven approaches have been explored extensively in the pharmaceutical industry, previous studies have been conducted to predict titers and product quality through machine
22
learning methods [28,29]. This project focuses on prediction process performance based on raw material attribute data combined with process data, with the aim to gain more material attributes insights though a data driven approach.
In the following section, the methodology and underlying techniques used will be
described in the application. In summary, the python package scikitlearn is the primary source of machine learning algorithms in this project [30].
23
3 Research Methodology
This chapter provides an overview of the methodology of this project. First, the following section will conceptualize the aim of understanding the impact of raw material attributes on process performances. Second, available data is collected, preprocessed and feature engineered for further model training. Third, trained models were evaluated and selected through
performance metrics. Lastly, a framework is established to guide further raw material study through comparing model performance in different stages.
3.1 Contextualization
The research project began by understanding the problems and challenges. Data and resources availability, problem complexity, and previous initiatives were evaluated before data collecting, data mining, and model training.
From a pragmatic point of view, this project should serve as an additional tool to help Amgen gain insights about raw materials. In addition, there is a desire to increase the efficiency of the material evaluation process with by providing analytical insight through the trained models and model evaluation process. Furthermore, the aim of this project is to develop a data analysis framework that could enable quick evaluation of the understanding of the impact of raw material attributes on desired process performance.
Material science related studies in the field of biotechnology are usually conducted by laboratory-based scientists, which can be labor intensive and time consuming, but in this project, a data-driven approach is taken to evaluate material attributes. The growing amount and good quality of data would enable the ability to capture value through advanced data analytics
24
technology. Furthermore, more and more suppliers are brought onboard with the data network, which provide this project with the data foundation for analysis.
To achieve the overall goal of gaining raw material attributes insight through advanced modelling techniques, three question were asked: (1) how much impact does raw material
attribute variation have on process performance, (2) how much impact can be ascribed to the raw material attributes being monitored, and (3) what insights can be gained through advance
modeling techniques? Through answering the three questions, this project could focus on developing an achievable framework to provide analytical insight of raw materials.
3.1.1 Raw Material and Process Selection
To answer the questions stated previously, three raw materials for four processes where selected to develop the data evaluation framework. There are several reasons for choosing the selected raw materials: (1) all of them were known to have attributes impactful to the process performance and / or product quality, and have been studied to gain better understanding which could be used to verify the findings generated though the data analytics method, (2) there are various levels of correlations between the selected raw materials with related processes, which could test the universality, (3) the different amount of data could verify the general applicability of the proposed framework.
A proof of concept project has been done with materials and processes which were known to have a significant correlation with each other [15]. The results showed a strong linear relationship between selected material attributes with desired process performance, however, biotech processes are known to have complex and non-linear relationships. Therefore, in this
25
project, it is important to include materials which do not have clear linear correlations to develop the framework which could be applied more broadly.
In a biotech process, it is typical to have processes separated into several unit operations. Intermediate drug substances are often collected prior to the steps of drug product production. To cover processes in different steps, raw materials used in both upstream and downstream
operations were selected in this project.
Although most of Amgen’s commercial drug products are large molecules, there are also small molecule drugs in Amgen’s portfolio. And small molecule related processes were also included in this project.
3.1.2 Overview of Available Data
Although the subject of focus in this project is raw material attributes, the operating control parameters also have significant impact on the process performance. To generate a model which could represent most of the variabilities in the process and result in the highest
predictability, process data as well as the material data (Figure 3-1) were collected and combined together as a unified source of data.
26
The material data are provided either by suppliers or internal testing measurements, and only attributes of selected raw materials were incorporated into the dataset, however, there are much larger varieties of materials utilized in each process which could potentially contribute to process variation. This is an area for future improvement, more data collected in the future could potentially train models with better performance. Despite this fact, the way the framework of modeling and the evaluation of model metrics, based on out-of-sample performance, were set up still helps to gain insight for selected materials.
The process data comes from operating control parameters which are closely controlled and monitored during the manufacturing operations. The biotech industry has been aware of the complex and nonlinear impact processes have on the overall performance of manufacturing operations [2]. Therefore, an intensive effort was spent on understanding the process and collecting data. Including the process data helps minimize the effect of the absence of other raw material data because a lot of the raw material variation will result in the variation of process data. The general monitored data in this phase include but not limited to pH, temperature, OD (Optical density), DO (dissolved oxygen), and agitation speed which are all parameters representing the condition of processes.
3.1.3 Selected Raw Materials and Processes
Different raw materials and processes are selected to test if the proposed framework would be generally applicable to different types of raw materials in different processes under the several guidelines which are going to be described below. (1) There is enough understanding with the correlation between the selected raw materials and utilized processes to verify the potential finds from the framework. (2) There are different levels of correlation between raw materials and processes so the results could be used to test the universality of the proposed
27
framework. (3) The amount of data also varies a lot to verify the general applicability of the framework.
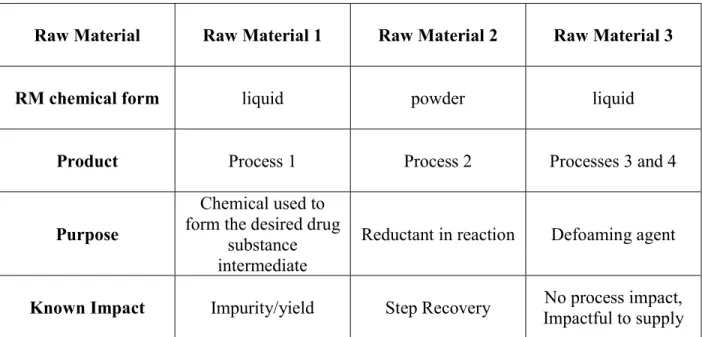
Under these guidelines, three raw materials used in three different processes are selected to be studied in this project. Table 3-1 shows the general information and usage in used
processes. Note that although Raw Material 3 is used in both Process 3 and 4, its relationship with Process 3 is discussed in this project for simplicity.
Table 3-1 Selected raw material and processes
Raw Material Raw Material 1 Raw Material 2 Raw Material 3
RM chemical form liquid powder liquid
Product Process 1 Process 2 Processes 3 and 4
Purpose
Chemical used to form the desired drug
substance intermediate
Reductant in reaction Defoaming agent
Known Impact Impurity/yield Step Recovery No process impact, Impactful to supply
Step Recovery: Amount of product captured
Reductant: an element or compound that loses (or "donates") an electron to an electron recipient (oxidizing agent) in a redox chemical reaction.
Defoaming agent: chemical additive that reduces and hinders the formation of foam in industrial process liquids
3.2 Data Collection and Preprocessing
3.2.1 Data CollectionIt is typical that getting the correct data is the most difficult and time-consuming work in a machine learning project. And both data querying from different parts of the EDL (Enterprise Data Lake) which is a centralized repository that allows Amgen to store all structured and
28
unstructured data at any scale) as well as data stored in Excel spreadsheets were gathered for this project.
To query data from EDL, SQL (Structured Query Language used to communicate with a database) is used in combination with an opensource package in Python to streamline the data collection effort, getting ready for scaling up in the future. EDL system was originally designed to store and document, so additional data processing and clean-up are required to transform data into the format for modeling training. Also, due to the constant evolving manufacturing process and data recording standards as well as different operation monitoring parameters for different processes, significant work of data cleaning, data matching, reconfiguration and reconciliation from various sources was required after direct data querying. Because of these difficulties, it would require an understanding of both the data structure of EDL and the standard operating process (SOP) to be able to efficiently gather data for future analysis. For future scale-up,
significant data restructuring should be considered for practicing machine learning techniques for the large number of processes and raw materials in Amgen’s network.
Although the EDL is very comprehensive and convenient, it does not contain all the information required, especially raw material data from suppliers, which is normally stored and transferred through CofA (Certificate of Analysis) documents. Gathering supplier data requires knowledge with process owners and information outreach from people across the organization. Cumbersome as it seems, data in an Excel file are often more relevant and manageable.
However, as the amount of data keeps increasing and more suppliers adopting digital data infrastructure and onboarding with Amgen’s data sharing partnership, the Excel file formatted data will be less utilized and would be replaced by the EDL system if future scale-up is desired.
29 3.2.2 Data Preprocessing
After the data were collected, data pre-process was conducted for the preparation of the final data frame in the format needed for machine learning algorithms of python scikit-learn package [30]. Three steps are followed for preprocessing: (1) matching data from different sources into one single store of all relevant data for each topic, (2) generalizing continuous operating data into representative data measurement, (3) cleaning up outliers and data errors.
Matching data from different sources
Data collected from different sources and tables are normally in different format and structured differently. In addition, data from different sources are typically not in the same sequential order. To unify the data into one single source, aggregating the raw material data with different process data with the right order was needed. A lot genealogy exploration tool was provided by Amgen’s system to keep track of the lot numbers of manufacturing batches and relevant lot number of raw materials which were utilized in production. As shown in Figure 3-2, different data frames could be connected by tracing back on lot numbers.
Figure 3-2 Data Matching Method by Lot Numbers
While lot genealogy provides enough information to link the raw material data with the process data it also revealed a second level of complexity during the manufacturing process which would be challenging to deal with for relevant data matching. Because not all raw
materials come in quantities as the exact multiples of the amount required in each manufacturing batch, and sometimes raw materials are being stored in the inventory and are mixed together with
30
different lots before use, multiple lots being recorded in the system could potentially be found. Often, one manufacturing process is separated into several unit operations, and like the raw materials, intermediate drug substances are also stored in the inventory and would potentially be mixed with other batches before going further downstream. The challenge here is how to
aggregate the data from different lots and batches to represent the true property of either the raw material attributes used or the process control parameter.
To address this issue, a documentation review was conducted to understand the different attributes being recorded for each of the raw materials selected to pilot in this project. And for most of the attributes, a weighted average is taken to calculate the representative value for the desired parameter because for attributes of raw materials, impurity percentage for example, the results value of the mixed material would equal to the total impurity amount divided by the total weight or volume of the material used. For other type parameters where taking the weighted average does not make sense, in the scenarios studied in this project, they were not being selected as features to be included in the final data to train the models through feature engineering which would be discussed further later in this chapter.
Generalizing continuous data from different sources
After successfully connecting data from various sources, it was to be possible to rationalize that all the parameters, especially continuous or sequential operating control
parameters recorded under the same names, represent the same information. Because the process durations can vary from batch to batch, which is acceptable as long as they are within the range defined in the SOP, one batch might have more recorded features than another. Besides, some sequential information is recorded every set period, the difference in the start recording time will result in an offset of all sequential data. For these reasons, it is not sensible to simply use the data
31
being recorded. After consulting with a subject matter expert, it was decided to generate some representative values (e.g., maximum, minimum and average values) to be included in the datasets.
Cleaning up outliers and data errors
Treatment of outlier and errors is also important in data cleaning and pre-processing. Data found to be orders of magnitude bigger or smaller than the median of the distribution are clearly outliers or errors in the given context. Data outliers and errors are manually removed and left as blanks, depending on whether the features which include the outliers are selected by the feature engineering, decision will be made on whether the data for the whole batch will be deleted or not. If the feature of the outlier data is selected by feature engineering, then the data with the whole record of the batch will be eliminated.
3.2.3 Data Imputation
All datasets suffered from missing values (15% to 25% of the data missing). The three main reasons for missing data were found to be: (1) data was missed when logging into the database or simply missed by users randomly, (2) standard operating process was changed with modifications to operation control parameters being added or dropped, (3) not all attributes are tested for each incoming raw material lot (full testing is done per schedule in accordance with SOP). Data scientists when dealing with real world data need to face these types of issues regularly. Data imputation is one of the common solutions to solve this problem which replaces missing data with substituted values
After evaluating the datasets, it was found that the shape of the dataset is quite “flat”, which means the ratio between number of features and number of records are large with
32
hundreds of features and similar number of records, and the location of missing values are quite sparse rather than concentrated. Dropping all the features (columns) or records (rows) with value missing is quite costly and would decrease the amount of data which is already limited.
Therefore, conducting data imputation is both necessary and achievable.
The approach taken was leveraging KNN algorithm in data imputation [31]. KNN itself is a machine learning algorithm which is useful for both regression and classification in a multi-dimensional scenario. Before implementing KNN for imputation, data were normalized to avoid overly relying on data features in larger magnitude. This is because KNN algorithm relies on majority voting based on 'k' nearest neighbors on Euclidean distance for a given point, and features with larger magnitude would be weighted more than smaller magnitude features if data are not scaled which will introduce bias into the imputed dataset (Figure 3-3 Data without Normalization in KNNFigure 3-3 versus Figure 3-4). And for similar reasons, data are also normalized in the model fitting process.
33
Figure 3-4 Data with Normalization in KNN [32]
A threshold is needed to decide when data imputation would be unreliable and feature elimination is necessary. Eliminating records (rows) was intentionally avoided because there is a large ratio of features number to record number, therefore eliminating records would be costlier than eliminating features. The threshold set is 30%, which means features with more than 30% missing values were deleted. This threshold is recommended in a previous LGO project of similar nature [19], and a more rigorous analysis and optimization is recommended in follow-up projects.
In practice, Python KNN imputation package fancy impute [33] was used to perform the data imputation process, and a value of k = 3 was used in the KNN algorithm as recommended from the package tutorial, and further study should be conducted to find the most optimal k value in the future.
3.3 Data Exploration
After the data frame is constructed, the next step would be data exploration by plotting the history diagrams and scatter plots to understand the distribution and correlation between
34
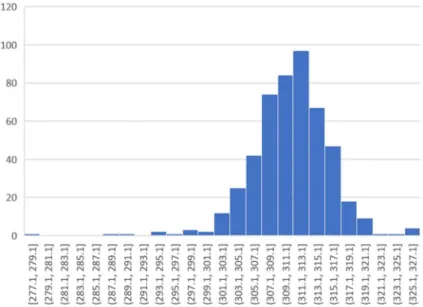
different features and the overall nature of the data. And two primary observations are found. The first observation is that there is very little variation in most of the features, raw material attributes, process operating control parameters and performance metrics are all concentrated in a small range, and it is a challenge to evaluate model results.
Figure 3-5 and Figure 3-6 show the example of bar plots representing the spreads of examples of process performance and raw material attributes. Both are heavily concentrated in the acceptable range. This limited variability is largely due to Amgen’s robust quality control strategy and highly controlled manufacturing processes and could also be a challenge for future projects with a similar nature.
35
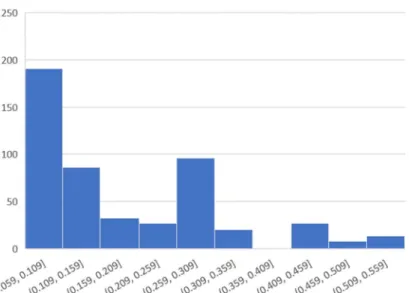
Figure 3-6 Spread of Raw Material 2 Attribute 1
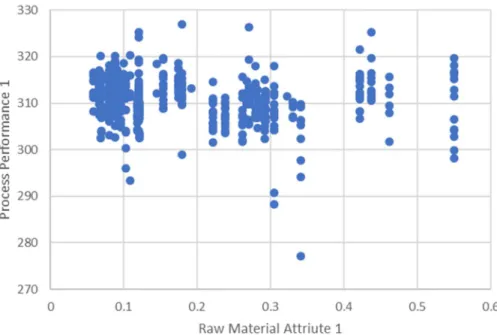
The second observation is that there is no obvious correlation between the evaluated raw material attribute and performance metrics from Figure 3-7, but it is worth noticing that
including this specific raw material attribute would increase the prediction power of the trained model significantly. Figure 3-7 shows the scatterplot of the same two features presented in the Figure 3-5 and Figure 3-6. This could mean that non-linear or more complex algorithms would be required for the best performance, however, such algorithms are normally more difficult to interpret and gain insight from.
36
Figure 3-7 Scatterplot of Raw Material 2 Attribute 1 to Process 2 Performance Metric
3.4 Feature Engineering
Feature engineering is the process of transforming raw data into features that better represent the underlying problem to the predictive models, resulting in improved model accuracy on unseen data, and only feature selection was conducted in this project for simplicity. For the modified data frame, after generalizing continuous data, there are 100 to 200 features just for process control parameters, and if more raw materials would be included in future projects, the number of features could potentially increase significantly. On the other hand, the number of data points or data records is limited. For data frame with high feature numbers and lower sample size scenario, machine learning will typically face interpretability and overfitting problems. In addition, when exploring the data, there is another observation which is not mentioned in Section 3.3, which is some process control parameters are highly correlated between each other and including all of them leave a lot of redundant features in the model. Thereupon, feature engineering is conducted to reduce the features.
37
Different algorithms were explored in determining the features to be included in the model. Feature importance from ensemble of trees and mutual information were selected. Three different tree algorithms Random Forest, Extra Trees and XGBoost as well as mutual
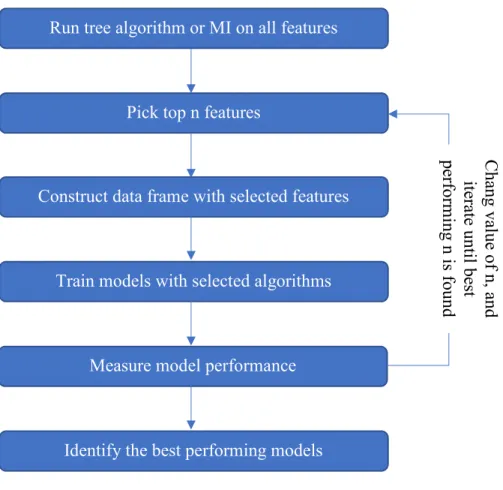
information method (MI) are implemented through python packages [34–37]. Number of features to be selected is determined dynamically for the best performing model. The process of feature engineering is shown in Figure 3-8.
Figure 3-8 Feature Engineer Process by Tree Algorithms
Top n features are identified as the features with the highest feature importance in tree algorithms. Figure 3-9 shows the workflow of how to identify the value of n based on feature importance from random forest algorithms and trained model performances.
Run tree algorithm or MI on all features
Pick top n features
Construct data frame with selected features
Train models with selected algorithms
Measure model performance
Identify the best performing models
C ha ng v alu e o f n , a nd ite ra te u nti l b es t pe rfo rm in g n is fo un d
38
Figure 3-9 Example of feature Importance from Random Forest
The iteration process of finding the best n (number of features) requires significant calculation power because of the larger number of features in the original data frame. Often, the enhancement of performance improvement is marginal. Therefore, a better method for feature selection could be further studied and developed for efficiency, especially when more raw materials are included in the models.
3.5 Algorithmic Framework Design
In supervised machine learning projects like this project, this project aims at training a model 𝒇 that would predict the process performance 𝒚 based on the selected features 𝒙 with the highest accuracy or minimum error 𝒆, which is represented in Equation 3-1 below. And ideally, the model should have the same accuracy when facing new data.
min 𝑒 = min 𝐸 𝑓(𝑥) − 𝑦 Equation 3-1
As the name of this project indicates, gaining insight into raw material attributes is as important as generating an accurate model. In other words, it is also important to look for
39
interpretable models which could explain how raw materials are impactful to the processes and direct future studies directions. The modeling framework is outlined in Figure 3-10 and detailed below.
Figure 3-10 Model Generating Framework Flowchart
Data collection, preprocessing and feature selection are detailed in Section 0 and Section 3.3. After the data frame for model training is set up, various algorithms are explored in the model training process. But before starting to fit models with existing data, the first step is identifying what is the performance metric that needs to be predicted. This process is a
combination of experience selection and correlation selection. Initially, subject matter experts of specified processes were interviewed for the initial selection of potential targets (production titer, product quality, etc.) based upon past experiences and studies. Then data would be explored deeper to identify the target feature which correlated the most with raw material attributes.
Data Preprocessing
Identify Target
Select Best Model Feature Selection
Model Training Data Collection
40
Correlation plots were used to visually identify the correlations. An example of a correlation plot is shown in Figure 3-1, and Target feature 9 is found most correlated with the raw material attributes, thus it is selected to be the first target. In spite of that, other targets like Targets 11 were also explored because it has the second-highest correlation. What is interesting, but not surprising, to find is a lot of the potential targets are highly correlated with each other.
Figure 3-11 Example of correlation plot of raw material attributes with potential targets
There are over a hundred machine learning algorithms and the number keeps growing. It is impossible to include all of them in the library. In this project several most commonly used
41
categories of algorithms were selected to be used in model training. They are Linear Regression, CART (Classification and Regression Trees), and ensemble of trees. In Linear Regression, Lasso [38], Ridge [39], Elastic Net [40], Linear Support Vector [41] and Stochastic Gradient Descent [42] are included. And for ensemble of trees, feature selection engines selected in this project (Random Forest, Extra Trees and XGBoost) are all implemented. Besides, Gaussian Process Regressor [43] is also included in used machine learning library. Selected data are then fitted into models through various algorithms.
For each algorithm included in the library, the model is fitted and evaluated. But one challenge with evaluating performance with complex algorithms like Random Forest is
overfitting. In statistics, overfitting is "the production of an analysis that corresponds too closely or exactly to a particular set of data, and may therefore fail to fit additional data or predict future observations reliably" [44]. To avoid overfitting, K-fold cross-validation is a dominant process in the field of machine learning. In this project, k = 10 was picked to perform k-fold validation, which means the total data set will be divided into 10 subsets and pick one different subset as validation set with the rest being training set for 10 times, train model with training set only and use validation set to measure the performance of models. The average of performance metrics for all 10 times will be used to evaluate the model performance with the set of hyper-parameters for specific algorithms, and this process is also used for hyper-parameter optimization. Example of k-fold validation data split is presented in Figure 3-12. In addition to the average of performance metrics, the variation of performance metrics from k-fold validation is also used to test the consistency of expected model performance.
42
Figure 3-12 Example of k-fold validation with k = 5 [45]
3.6 Model Performance Metrics
There are numerous metrics to evaluate model performance in machine learning. Depending on the type of machine learning algorithms, different metrics are normally
implemented (RMSE for regression and AUC or ROC for classification). Since in this project all models are regression models, the main performance measurements were R2, adjusted R2, RMSE and MAE. The determination of each metric is shown in Table 3-2.
Table 3-2 Model Measurement Metrics Definition
Metrics Definition
R2 Mathematically, R-squared is calculated by dividing sum of squares of residuals (SSres) by total sum of squares (SStot) and then subtract it from 1.
Adjusted R2 The adjusted R-squared is a modified version of R-squared that has been adjusted for the number of predictors in the model
RMSE RMSE is the standard deviation of the residuals (prediction errors). Residuals are a measure of how far from the regression line data points are; MAE The mean absolute error is an average of the absolute errors |𝑒 | = |𝑦 − 𝑥 |, where 𝑦 is the prediction and 𝑥 the true value.
43
Ultimately R2 was chosen as the primary metric for performance evaluation. The reason of picking R2 over RMSE is the object of the framework developed in this project is to gain insight of raw material rather than predicting value, and R2 is one of the metrics which measures the variation of dependent variable explained by all independent variables included in the model. Besides, as shown in Equation 3-2 and Equation 3-3, for the same model and dataset, both RMSE and R2 are calculated by measuring the summation of squared errors.
𝑅 = 1 −∑ (𝑦 − 𝑦 ) ∑ (𝑦 − 𝑦 ) Equation 3-2 𝑅𝑀𝑆𝐸 = 1 𝑛 (𝑦 − 𝑦 ) Equation 3-3
Where 𝑦 is the observed value in the dataset, 𝑦 is the predicted value from the model, 𝑦 is the mean of all observed values.
R2 is utilized over MAE to penalized large errors between predictions and actual values. Adjusted R2 is not primarily implemented because (1) R2 is more commonly used in Amgen network, (2) feature selection process in this project generally returns ratio of 1/15 between number of features selected and sample size, therefore the difference between R2 and adjusted R2 is negligible.
𝑅 = 1 − (1 − 𝑅 )(𝑛 − 1) 𝑛 − 𝑘 − 1
Equation 3-4
44
4 Results
In this chapter, model performance and findings will be discussed both qualitatively and quantitively. First, the model performance metrics in all studied scenarios would be presented accompanied by insights into the impact of raw material attributes on process performance interpreted from the models. Next, a modeling framework designed to evaluate the impact of raw material on process performance through data analytics is proposed and discussed though three case studies.
4.1 Model Performance
As illustrated in Chapter 3, established methodology and machine learning processes were followed for the best performing models to predict the desired process performance metrics. In addition to prediction for the process performance, insights about if and how raw material attributes will be impactful on the process performance could also be interpreted from the models. However, different types of algorithms will provide different insights. Most apparently, linear regression will provide the coefficients of different independent variables which shows the positive or negative and significance level of correlation between dependent variable and independent variable. Decision tree regressors (CART) [46] is recognized as one of the most interpretable models which would generate most visible insight by plotting each
branch and leaf. Last, decision tree ensemble regressions (Random Forest [34], e.g.) are the hardest to interpret, however, feature importance plots are the most obvious indicator of what features are found important to be included in the model .
In total three raw materials in three different processes are selected as case studies in this project. As mentioned in Chapter 3, raw material attribute data and process data are combined as input, and target are either process titer or product impurity.
45 4.1.1 Predictive Power Analysis of Models
As mentioned in Section 3.5, models will be validated through k-fold cross validation, training set will be split into k subsets (10 in this case). This will keep track of model
performance for k times, and by summarizing the distribution of all the values, the average performance of fitted model along with the standard deviation could be calculated which represents the stableness of the prediction power. R2 and related standard deviations obtained from cross validations are shown in Table 4-1.
Table 4-1 Performance R2 and standard deviation for all the models trained.
Process Regressor Type R2 Standard Deviation
of R2
Process 1 Regression Tree 0.19 0.14
Process 1 Gaussian Process Regressor 0.32 0.17
Process 1 Linear Regressor 0.12 0.11
Process 1 Ensemble of Trees 0.27 0.18
Process 2 Regression Tree 0.12 0.49
Process 2 Gaussian Process Regressor 0.42 0.2
Process 2 Linear Regressor 0.20 0.36
Process 2 Ensemble of Trees 0.21 0.21
Process 3 Regression Tree 0.86 0.07
Process 3 Gaussian Process Regressor 0.72 0.15
Process 3 Linear Regressor 0.76 0.10
Process 3 Ensemble of Trees -0.60 1.45
It is observed that the standard deviation is relatively large comparing with the average model performance which means that the predictive power with the same set of
hyper-parameters varieties a lot based on different training set and validation sets. This indicates the accuracy of models is not consistent, therefore, with different validation sets, the result varied significantly. This is a typical challenge with small datasets where the validation set sample size is small and does not represent the whole population.
46
For process 1 and 2, Gaussian process regressor yields the best accuracy of all algorithms, and regression tree and linear regressor algorithms only about 20% in R2. This is expected as there is no known key indicator to the process performance, and the correlation between raw material attributes to the process performance is non-linear which means there is no simple positive or negative correlation between each other, hence linear regressors are not yielding the best results. In process 3, the best performing model is regression tree, while Gaussian process regression and linear regression yield similar results. This is expected as previous study of the specified raw material has a significant and linear correlation with the tracked process performance.
On the other hand, it is surprising to see that ensemble models did not have much better accuracy than simple regressor models. Especially for process 3, the R2 is negative, meaning the fitted model is worse than simply guessing the mean of the sample. This is a typical example of the problem called overfitting, and in this case, it is largely due to the small sample size (less than 30), and ensemble models require large dataset to yield better results. Perhaps in the small datasets, most value lies in the feature importance values associated with the trees.
Feature importance, as the name indicates, measures how important each feature
(independent variable or input) is to be included in the models and how likely the feature would help explain the variation in the dependent variable or target. And feature importance would also help identify the most relevant features in the model.
4.1.2 Feature Importance Evaluation
Due to the non-linear relationship between the raw material attributes or process operating parameters, it is not ideal to generate a linear relationship between independent
47
parameters with dependent parameters from the linear regressors included in the machine learning model library. Decision trees regressors could provide meaningful insight in this case, but without a good model accuracy, it is debatable how reliable the separation conditions are. Thereupon, it is worthwhile checking the feature importance from different ensemble models to get a general guidance on how important each feature is to be included in the model to enhance the accuracy of fitted models. Figure 4-1, Figure 4-2, and Figure 4-3 show the feature
importance from process 1-3 from Random Forest Algorithm.
Figure 4-1 Feature Importance for Process 1 from Random Forest
In process 1, the feature importance chart shows that raw material attribute 1 is the most significance feature to be included in the model, which corresponds with existing understanding of the process that the specified raw material is essential to the process performance, however, it is not a simple linear relationship between the known attributes with the desired performance metrics.
48
Figure 4-2 Feature Importance for Process 2 from Random Forest
Figure 4-2 shows the feature importance for top important features in the model constructed for process 2. Unfortunately, there are no raw material related attributes found too important to increase the explanatory power of the models, so the feature importance indicates that the selected raw material does not have significant impact on final process performance. Although disappointing, it corresponds with existing understanding with the process that this raw material does not have noticeable impact on the process performance. Yet, there is a specified range in the specification of this raw material which was found hard to meet for the supplier, and the feature importance chart, as well as other pieces of information gathered can be supporting evidence to provide a strong scientific justification for removing this attribute from the raw material specification without impacting process performance and product quality.
49
Figure 4-3 Feature Importance for Process 3 from Random Forest
Figure 4-3 shows the feature importance for top important features in the model constructed for process 3. More important than Figure 4-1, in process 3 half of the features found important are raw material related attributes which strengthened the existing knowledge about the raw material being one of the decisive factors to determine the outcome of the process. Referring the results shown in Table 4-1, it shows that linear regression yields a reasonable R2 which could show the correlation between raw material attributes with the process performance.
In summary, the feature importance from ensemble models could be valuable in determining if raw materials attributes are important for process performance variability explanation. And together with linear regressors, it can be identified that the overall positive or negative correlation between independent variables and dependent variables.
50
4.2 Model Framework of Evaluating Raw Material Attributes
As discussed in Section 4.1, feature importance and linear regressors could reveal the correlation between raw material attributes and process performance. But this could not systematically help answer if the right attributes of specified raw materials are being tracked. For example, from the results shown above, there are no raw material attributes found to be important to the process performance, however, it could not be simply concluded that the selected raw material does not have noticeable impact on the process. Thereupon, a framework of modeling is introduced to evaluate whether the right attributes for raw materials are captured or not. The framework includes a three-step modelling process shown in Figure 4-4.
Figure 4-4 Three-step Modeling Framework
First, train a model with only process data fitting for the target variable to set a base line for how much of the variabilities are explainable from process operating control parameters. Second, with the assumption that lot number contains most of the variability in raw materials, models are trained with no specified attributes data but lot number data. Third, attributes data along with process data are utilized to train the models. After best performing models are selected for all three steps, by comparing the model performance metrics (R2 in this project), it can be evaluated if a raw material is important in the selected process and if the specified
51
attributes could represent all the variabilities in evaluating the impact of the raw material on the process performance. Example of results are shown in Figure 4-5 to Figure 4-7.
52
Figure 4-6 R2 Comparison of Three-step Modelling Framework for Process 2
53
Figure 4-5 shows an 18% of R2 increase from model 1 to model 2 and a 3% decrease from model 2 to model 3. Although the 3% is a small drop but it is about 17% of the total R2 increase from model 1 to model 2, and it will need further investigation to verify if there are sources of variability missing from in the specified attributes, for example, if there are any unknown impurities which could affect the process. Differently, in Figure 4-6, it shows no change from model 1 to 3 in terms of R2. This is because no raw material attributes nor lot numbers are found to be important in the feature importance calculation, thus none of them are included in the final model and adding those features in the final data frame for model fitting would only increase noise without increasing the model accuracy. Ideally, like what is shown in Figure 4-7, from model 1 to model 2, R2 increases by more than 65%, and there is a minimal decrease of R2 from model 2 to model 3. This strength of the findings about feature importance from the selected raw material in process 3 is one of the decisive factors to determine the process performance.
54
5 Conclusion and Future Recommendations
The developed modeling framework is the initial prototype of evaluating raw material understanding utilizing advanced data modeling technologies. The chapter summarized the primary findings, associated implications, and business applications. Furthermore, future recommendations and next steps are also discussed in this chapter.
5.1 Findings and Business Applications
This project evaluated the advanced modeling techniques in predicting the process performance metrics (titer, product quality, e.g.) and gaining insight focusing on understanding raw material attributes associated impact on processes through 3 chosen processes and 3 related raw materials. Both raw material data as well as process operating control parameters were included as independent variables in the various algorithms for the best performing model. Various accuracies were achieved for accuracy measurement (R2) of 3 different processes varies from 0.32 on the low end to 0.86 on the high end. However, the different accuracy
measurements of models corresponded with existing understanding with the selected processes and raw materials where there are various levels of correlations between them. This also proves that the data driven approach could not only help identifying correlations where they do exist, but also be helpful in ruling out factors which is not significant source of variabilities.
In addition to the primary models in utilizing material attributes and process data to train predictive models, other approaches were also explored to gain more insights from this data driven mythology. Feature importance was found informative in determining whether specific features are important to be included and significant in increasing the explaining power of developed models. The three-step modeling framework also enables the ability to evaluate
55
whether specified material attributes could represent all the variabilities in the selected raw materials.
The results proved that the models fitted, and modeling framework allow us to identify the level of impact certain raw materials attributes have on associated process performance. Therefore, with more data available, the impact raw materials have on processes could be evaluated in a much more efficient manner with advanced modeling techniques, and a specific strategy could be designed with the suppliers to control the important attributes. In addition, the modeling framework and feature importance analysis could help identify if the right attributes are being tracked and controlled to further help find the direct next study area. Furthermore, this framework is not only useful in identifying the important attributes but also helpful in
eliminating irrelevant attributes which could serve as supporting evidence when filing for a change in a raw material specification.
5.2 Recommendation and Next Steps
This project was successful in developing the modeling framework and identified level of correlations between the selected raw materials with processes. However, there are several aspects in the project that can be improved and even challenged. Incorporating some of the suggested next steps in this section could potentially increase the accuracy of trained models and enable some of the next steps to discuss in this section.
Like most of the machine learning projects, it would require as much data as possible, especially for some of the data consuming algorithms like Random Forest. And it would be important to get more data to be included in the model, so getting more suppliers on board with data sharing would expedite the improvement of future projects of a similar nature.
56
This project intentionally selected one raw material per process to isolate the effect from different raw material and minimum noises. In process 3 the model trained captured most of the variabilities, while in process 1 and 2 no predictive model with enough accuracy was achieved. More raw material attribute data could be included in the model for exploration as the potential explanation of variabilities in the process. Besides, including more raw materials, generating interaction features in the model might also be helpful in increasing the prediction accuracy.
In terms of the data collection and preprocessing steps, although the EDL system is very convenient and comprehensive, it was originally designed to be a data storage infrastructure, and the way it stored the data does not match the data structure required for machine learning. Significant effort is required to understand the structure of different data tables as well as the naming strategy for different processes to convert the data into the desired format. Therefore, standardizing EDL structure and developing another platform for machine learning might be essential for future scale-up of this project.
Finally, this model is a data driven approach to evaluate raw materials, and the processes and raw materials have been evaluated before to be able to validate the findings. It would also be important to conduct a case study on a less understandable material for insight and work with a subject matter expert to verify that finding. If specified attributes variability is found not being able to represent all the variabilities generated from the specific raw material, subject experts could also be involved to perform controlled experiments to test the root causes of this discrepancy.


![Figure 3-1 Outline of The Data Available [15]](https://thumb-eu.123doks.com/thumbv2/123doknet/14091573.464814/25.918.308.673.801.1024/figure-outline-data-available.webp)
![Figure 3-3 Data without Normalization in KNN [32]](https://thumb-eu.123doks.com/thumbv2/123doknet/14091573.464814/32.918.246.643.679.997/figure-data-normalization-knn.webp)
![Figure 3-4 Data with Normalization in KNN [32]](https://thumb-eu.123doks.com/thumbv2/123doknet/14091573.464814/33.918.251.643.113.420/figure-data-normalization-knn.webp)