HAL Id: hal-00304789
https://hal.archives-ouvertes.fr/hal-00304789
Submitted on 1 Jan 2003HAL is a multi-disciplinary open access archive for the deposit and dissemination of sci-entific research documents, whether they are pub-lished or not. The documents may come from teaching and research institutions in France or abroad, or from public or private research centers.
L’archive ouverte pluridisciplinaire HAL, est destinée au dépôt et à la diffusion de documents scientifiques de niveau recherche, publiés ou non, émanant des établissements d’enseignement et de recherche français ou étrangers, des laboratoires publics ou privés.
catchments in Hunan, China
N. Xue, H. M. Seip, B. Liao, R. D. Vogt
To cite this version:
N. Xue, H. M. Seip, B. Liao, R. D. Vogt. Studies of acid deposition and its effects in two small catch-ments in Hunan, China. Hydrology and Earth System Sciences Discussions, European Geosciences Union, 2003, 7 (3), pp.399-410. �hal-00304789�
Studies of acid deposition and its effects in two small catchments
in Hunan, China
Nandong Xue
1,2, Hans Martin Seip
2, Bohan Liao
1and Rolf D. Vogt
21College of Resources and Environmental Sciences, Hunan Agricultural University, Changsha 410128, P.R.China 2Dept. of Chemistry, University of Oslo, P.O.Box 1033, Blindern, 0315 Oslo, Norway
Email for corresponding author: [email protected]
Abstract
Acid deposition and its effects were studied by analysing the chemistry in precipitation, stream water, soil water and soils in two catchments in Hunan. One site, Linkesuo (denoted LKS), is on the outskirts of Changsha, the provincial capital of Hunan, the other (Bailutang, denoted BLT) on the outskirts of Chenzhou in southern Hunan. Volume-weighted average pH values and sulphate concentrations in wet deposition were 4.58 (BLT) and 4.90 (LKS) and 174 µmolc L-1 and 152 µmolc L-1, respectively. Wet deposition of sulphate has been estimated as
4.3 gS m-2yr-1 and 3.4 gS m-2yr-1 at BLT and LKS, respectively. Estimates of the corresponding total depositions (dry + wet) are
6.1 gS m-2yr-1 and 5.3 gS m-2yr-1. In precipitation and throughfall, sulphate was the major anion and calcium the major cation. In stream and
soil water, nitrate was slightly higher than sulphate on an equivalent basis and magnesium (Mg) not much lower than calcium (Ca). Important soil properties, such as soil pH, soil organic matter (SOM) content, exchangeable acidic cations, exchangeable base cations, effective cation exchange capacity (CECe), base saturation (BS), and aluminium (Al) and iron (Fe) pools, were determined for five forest soil profiles (consisting of four horizons) in each of the two catchments. The soils in BLT are generally more acid, have lower BS and higher Al and Fe pools than the LKS soils. The Al- and Fe-pools were generally higher in the topsoils (i.e. the O and A horizons) than in deeper soils (i.e. E and B horizons) especially at the most acidic site (BLT). There are significant correlations between Fe-pools and the corresponding Al-pools in both catchments except between the amorphous Feox and Alox. Considering the long-term high deposition of sulphate, there is a risk of future
ecological damage due to acidification, especially in the BLT catchment, although vegetation damage has yet to be observed in the catchments. This condition appears to be representative of a large part of Hunan.
Keywords: acid deposition, soil acidification, catchment, Al-pools, Fe-pools, Hunan
Introduction
Acid deposition, associated with sulphur dioxide (SO2) and
nitrogen oxide (NOx) emissions created during fossil-fuel
combustion, gives rise to a serious impact on natural ecosystems. Although SO2 and NOx emissions are declining
in North America and Europe, they are rising in many developing countries across the world (Amann, 2001). However, damage from acid deposition still occurs in some regions of North America and Europe and may be increasing in other regions, in particular in south-eastern Asia (Kuylenstierna et al., 2001). Much information about effects of acid deposition has been obtained through catchment studies. Most of these are in Europe or North America and include Christophersen et al. (1982); Nilsson (1985); Neal et al. (1990); Probst et al. (1990); Driscoll et al. (1994);
Dambrine et al. (2000); West et al. (2001); Likens et al. 2002). Recently there have also been such studies in China (Larssen et al. 1998, 2001; Zhao et al. 2001; Shao, 2002). Acid deposition in China, particularly south of the Yangtze, has increased substantially during the last decades. In 2000, 30% of China was characterised as acid deposition areas (annual volume weighted precipitation pH<5.6); in some areas acid deposition levels exceed the environmental damage level) (SEPA, 2000). Hunan is among the provinces in China most seriously affected by acid deposition. Acid rain was first reported in Changsha (the capital of Hunan) in 1972; it has since become one of the most seriously acid rain polluted cities in China, with an average volume weighted precipitation pH value below 4.5. In 2000, the annual average volume weighted pH was 3.53 and the acid
rain frequency (i.e. pH<5.6) was 90% (SEPA, 2001). Fortunately, Chinese public opinion and the authorities have realised the importance of this problem. According to the National tenth five-year Plan for Environmental Protection, the SO2 emissions shall decrease by 10% from 2000 to 2005
(SEPA, 2002). Total SO2 emissions in China decreased from
1995 to 1999 but have since probably increased (Li and Gao, 2002). Furthermore, building of taller chimneystacks to reduce local pollution increases long-range transport and thereby acid deposition in remote regions.
Acid precipitation and its precursors affect human health, materials and ecosystems (Rodhe et al., 1995; SEPA, 2000). While surface water acidification is not thought to be a major problem in China, acidification of soil and soil water may affect terrestrial ecosystems seriously in many areas including parts of Hunan (Chen et al., 1993, 1995; Williams et al., 1995; Larssen et al., 1998; Liao et al., 1997; Zhao et al., 1994; Seip et al., 1999). The soil and soil water in many areas of the province are sensitive to acidification due to low weathering rates (Duan et al., 2002) and medium to small pools of exchangeable base cations (Liao and Li, 1989). Decrease in soil pH due to acid deposition occurs most rapidly when the cation exchange capacity is low and pH values are intermediate (56). Where soils already have a low pH, the change in soil pH may be small even if the acid deposition is high; instead soil water acidity and aluminium (Al)-concentration may increase. This will generally imply the most serious ecological threat.
Following several research programmes, great progress has been achieved in understanding the soil acidification process in Hunan in recent decades. The studies include responses of Hunan forest soil to acidic input (Liao et al., 1998), mechanisms of sulphate adsorption in red soils in
southern Hunan (Chen et al., 1993, 1995), buffering mechanism of Hunan soil (Liao and Li, 1989), and relative sensitivity of Hunan soils to acid deposition (Hao et al., 1999). However, the only other catchment scale studies on acid deposition in Hunan are conducted by the Integrated Monitoring Program on Acidification of Chinese Terrestrial Systems (IMPACTS, 2003). The study site, CaiJiaTang (CJT), is about 150 km SW of Changsha (Shao, 2002).
Site descriptions
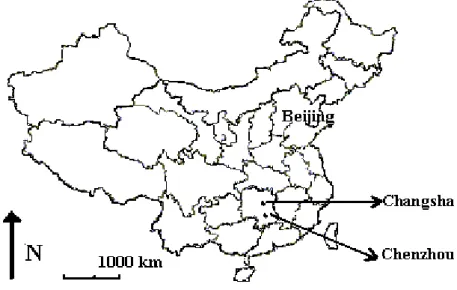
Two acid sensitive catchments, Bailutang (BLT) and Linkesuo (LKS), were selected in Hunan province for detailed studies. The province of Hunan is located in the middle reaches of the Yangtze and lies between 108.8°E and 114.8°E and between 24.6°N and 30.5°N (see Fig.1). Its total area is 211 800 km2. The mountains and hills occupy
more than 80% of the area and more than one-quarter of the terrain lies at a height of more than 500 m. Hunan province has a subtropical monsoon humid continental climate. The annual average temperature is 1618ºC, the non-frost period
lasts for 260300 days. Annual sunshine is 13001800 h, the annual average rainfall is between 1200 and 1700 mm with most rain in spring and summer. It is one of the rainiest regions in China.
The forested BLT catchment (Fig. 2) is nearly 400 m a.s.l. at 25.78°N, 113.01°E about 20 km east of Chenzhou. BLT has, on average, 300 frost-free days a year. The annual average temperature is 16.9°C. The total annual rainfall is 1548 mm with the maximum precipitation occurring in spring and summer. The area of the catchment is about 0.15 km2. The main tree species are Chinese fir
(Cunninghemia lanceolota) and Masson pine (Pinus
massoniana) but there is also a range of broad-leaf trees and bushes. The soil is in the Chinese red soil group corresponding to Ferric Acrisol in the FAO system and its parent material is granite. Kaolinite is the dominant clay mineral; there are also small amounts of vermiculite and illite. The catchment was deforested on a large scale in the 1960s. The soil has been practically undisturbed by other land-use activities. Five soil plots were selected for detailed studies (Fig. 2).
Changsha, at 28.2°N, 113.1°E, about 100 m a.s.l., has a subtropical climate featuring relatively long hot summers and short cold winters, with annual average temperature of 17.5 ºC and annual average precipitation,1378 mm. The LKS catchment (0.12 km2, about 100 m a.s.l, Fig. 2) is some
40 km east of Changsha. The soil is in the Chinese red soil
group corresponding to Ferric Acrisol in the FAO system and its parent material is shale. Kaolinite is the dominant clay mineral; there are also small amounts of hydromica and biotite flakes. The main tree species, Chinese fir (Cunninghemia lanceolota), was planted after deforestation and slash-and-burn cultivation in the late 1960s. Since then, the soil has been practically undisturbed by land-use activities. Five soil plots were selected for detailed studies (Fig. 2).
ANALYSES AND METHODS
Water was monitored through the two catchments, BLT and LKS. To collect soil water, lysimeters (Vogt et al., 2001), were installed in the A horizon at 20 cm depth in Plot 1 (BLT) and in plot 7 (LKS) close to the streams (Fig. 2). From 19 June 2000 to 19 June 2002, 54 wet deposition , 24 throughfall, 54 bulk deposition, 13 soil water and 12 stream water samples were collected from BLT and 58 wet deposition , 58 throughfall, 58 bulk deposition and 12 stream water samples were collected from LKS. Additional deposition measurements are available from Hunan Agricultural University (HAU), 10 km from LKS, but at a lower elevation (about 50 m.a.s.l.) where 58 wet deposition samples and 58 bulk deposition samples were collected during the same period.
The wet-only deposition was collected in plastic buckets placed in the field only during precipitation events while buckets for collecting bulk deposition and throughfall samples were in the field continuously during the monitoring period. Soil water was sampled monthly. However, the lysimeters collected little or no water in dry periods. Stream water was sampled monthly but not in the dry season (usually from July to November). Precipitation volume was measured as soon as rain or snow stopped. All samples were stored in a refrigerator and analysed within a few weeks. The samples were filtered under vacuum through a 0.45 µm membrane prior to analysis. The pH values in water samples were measured with a pH electrode (Ag/AgCl) at 20ºC. The cations of calcium (Ca2+), magnesium (Mg2+), sodium (Na+)
and potassium (K+) were analysed by Flame-AAS. Total
monomeric Al (Ala) in soil water and stream water samples
was separated into a labile fraction (mainly inorganic spacies, Ali) and a non-labile fraction (mainly organic
species, Alo). Ala was extracted and determined as described
by Barnes (1975) and Driscoll (1984). Concentrations of Alo and Ali were calculated by the computer program
ALCHEMI (Schecher and Driscoll, 1987). Ammonium (NH4+) was determined spectrophotometrically after reaction
with Nesslers reagent (K2HgI4) (GB7479, 1989); nitrate
(NO3) was determined by a UV spectrophotometric method
Fig. 2. Topographical map and sampling sites in BLT, near
Chenzhou, and in LKS, near Changsha (The plots 1-10 are soil sampling sites; A, B, C and D are the sampling sites for stream water; plots 1 and 7 are soil water sampling sites. The sampling sites for wet deposition, bulk deposition and throughfall were set up near plots 3 and 7)
(Skoog et al., 1998); bicarbonate (HCO3) by Gran titration
(Gran, 1950, 1952). Sulphate (SO42) was titrated with a
known amount of 0.02 M barium chloride (BaCl2) in excess
and titrating the surplus BaCl2 with EDTA (di-sodium
ethylene- diamine-tetra-acetate solution (APHA, 1985); and chloride (Cl) was titrated by 0.1 M silver nitrate (AgNO
3)
with potassium dichromate (K2Cr2O7) indicator (Department
of Chemistry Columbus State University, 2000).
Soils from four generic horizons (O, A, E and B) at the selected plots (Figs. 2 and 3) were sampled at depths given in Table 1. After removing coarse fragments and root debris, the samples were air dried and passed through a 2 mm sieve prior to analyses. Chemical analyses were conducted partly at the Department. of Environmental Sciences, Hunan Agricultural University, and partly at the Department of Chemistry, University of Oslo.
Soil pHH2O was measured using a Ross® pH electrode
(ISO, 1994). Exchangeable cations were extracted using an
unbuffered BaCl2 solution (Hendershot and Duquette, 1986).
Metal cations (Ca2+, Mg2+, Na+, K+, Fe3+, Mn2+ and Al3+) in
the extracts were determined by ICP-AES (Inductively Coupled Plasma - Atomic Emission Spectrometry). The pH (BaCl2) values measured with a Ross® pH electrode gave
H+ in the extracts. The equivalent sum of exchangeable
cations gave the effective cation exchange capacity (CECe).
Soil organic matter (SOM) was determined by oxidation with a known amount of 0.8 M K2Cr2O7 in excess and
titrating the surplus K2Cr2O7 with ferrous sulphate (FeSO4)
solution (Lu, 1999).
Al and Fe-pools include exchangeable Al and Fe (Alex
and Feex), weakly organically bound Al and Fe (Alc and Fec),
strongly organically bound Al and Fe (Alp and Fep) and
amorphous and organic Al and Fe (Alox and Feox). The data
for exchangeable Al and Fe are generated in the CECe
determination described above. Alc and Fec were extracted
by cupric chloride (CuCl2) electrolyte (Jou and Kamprath,
3.5 3.7 3.9 4.1 4.3 4.5 4.7 4.9 5.1 5.3 1 2 3 4 5 6 7 8 9 10 pH val u e O-horizon A E B
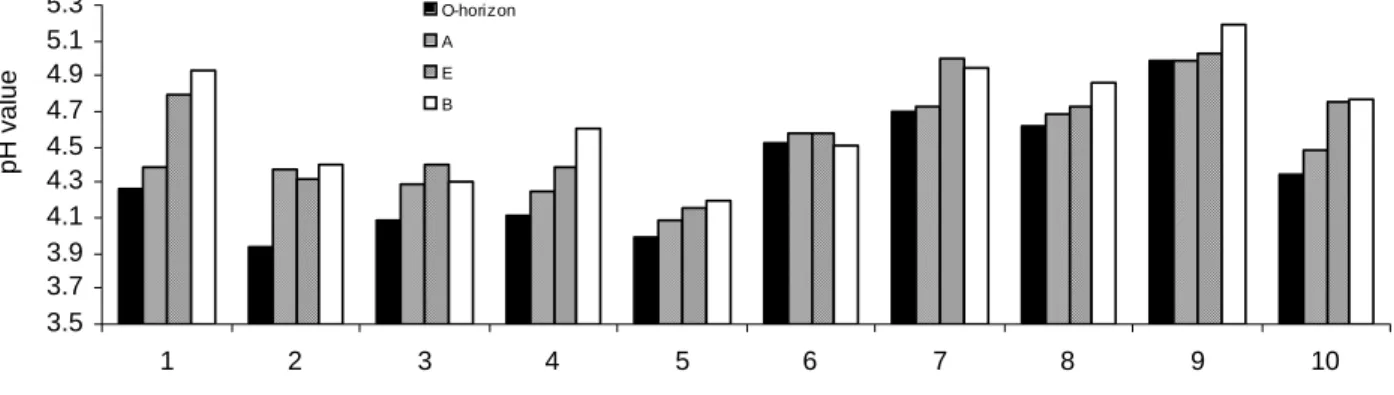
Fig. 3. Soil pH values (in H2O) found in 4 horizons at the 10 plots.
CECe: effective soil cation exchange capacity
;
BS: base saturation; AlS; aluminium saturation; SOM: soil organic matter; Alex and Feex:exchangeable Al and Fe, Alc and Fec: weakly organically bound Al and Fe, Alp and Fep: strongly organically bound Al and Fe; Alox and Feox:
amorphous and organic Al and Fe.
Table 1. Soil properties and the Al- and Fe-pools (mean values and standard deviations) in soils from the two Hunan catchments
Horizon Depth CECe BS AlS SOM Al-pools (cmolc kg-1) Fe-pools (cmolc kg-1)
(cm)(cmolc (%)(%) (g kg-1)Alex Alc Alp Alox Feex×103Fec×103 Fep Feox kg-1) SITE BLT O 0-10 6.2±1.2 10.6±4.2 87.1±2.5 31.4±9.2 5.4±1.0 12.3±1.9 44.9±14.1 34.5±8.9 20±5 50±13 43.6±9.8 16.6±5.5 A 10-30 4.4±0.9 9.6±2.7 86.4±4.8 24.9±8.0 3.9±0.7 9.2±1.2 37.6±11.3 30.1±6.8 14±3 20±4 35.9±8.6 10.5±2.7 E 30-45 4.2±1.6 12.8±4.0 83.9±8.0 23.9±6.9 3.5±0.8 7.8±0.9 31.7±8.1 26.3±4.2 13±3 30±6 28.4±6.6 10.7±2.2 B 45-75 3.6±1.4 13.6±4.6 79.8±8.5 16.7±4.2 2.9±0.5 6.7±0.6 25.2±4.8 24.0±3.0 11±2 20±3 18.6±4.2 7.9±0.9 SITE LKS O 0-8 5.1±0.8 34.9±10.1 62.8±12.2 20.1±4.5 2.8±0.7 6.3±1.4 12.7±4.0 17.2±4.5 3.4±0.8 19±5 8.0±2.0 13.2±4.0 A 8-28 4.5±0.5 29.0±9.7 64. 4±9.5 17.4±3.1 2.7±0.9 5.9±1.2 12.7±3.5 17.0±3.8 3.3±0.6 12±3 7.5±1.2 13.7±2.8 E 28-50 4.4±0.7 35.7±16.1 58.7±15.4 13.6±2.8 2.4±0.3 5.6±0.8 12.2±2.9 16.9±2.4 3.2±0.5 8±1 7.6±1.0 14.1±2.4 B 50-70 4.5±1.0 32.3±13.6 62.3±5.8 12.7±1.6 2.3±0.5 5.0±0.6 10.5±1.5 15.9±1.6 3.2±0.4 7±1 5.9±0.5 13.9±1.5
1979). Alp and Fep were extracted using a high pH (pH=10)
sodium pyrophosphate solution (Van Reeuwijk, 1995). Easily available mineral bound Alox and Feox were extracted
with an acid ammonium oxalate H2C2O4 /(NH4)2C2O4
solution (McKeague and Day, 1966). Fe and Al in the extracts were determined by ICP-AES.
House standard water samples with matrix similar to the actual samples were analysed along with the actual samples to account for possible errors and drift in the instrument. On the ICP-AES, the standard sample was run for every 7th sample and for every 30th sample on the AAS. Standard calibration samples from NIVA (an ISO-accredited chemical laboratory at the Norwegian Institute for Water Research in Oslo, Norway) for Ca2+, Mg2+, Na+, K+ and Al3+ determination
were also analysed on both ICP-AES and AAS. The average discrepancies for calibration samples are given in Table 2. The relative deviations of Fe3+ and Mn2+ determination
between ICP-AES and AAS were below 5%. All the results for other ions were less than one standard deviation from the mean.
In the analyses of soil samples, the intra-laboratory precision was checked by determining values of three sample replicates. The standard deviations (SD) among replicates were below 7.0%. Chemical changes, especially in NH4+
and NO3, may take place in the field and during transport
and storage (Richter and Lindberg, 1988). It took usually two to three hours to transport the samples from the catchment to the refrigerator in the laboratory. Therefore, concentrations for samples analysed immediately after sampling were compared with results for samples stored for three hours at room temperature; the NH4+ values were
about 7% lower and the NO3 values about 5.4% higher
than in samples analysed immediately. Storage in a refrigerator for three weeks resulted in values of NH4+ and
NO3 about 9.5% lower; this was as if chloroform had been
added before storage to prevent biological activity. The changes, while significant, do not distort the general picture and major conclusions. The uncertainties in the analyses were discussed by Liao et al., (1997, 1998) and by Larssen et al., 1998).
Results
PRECIPITATION CHEMISTRY
The volume-weighted pH and concentrations of major ions in the precipitation at the two catchments are listed in Table 3. At the BLT catchment, the volume-weighted pH in wet deposition for the study period was 4.54. All samples were acidic (pH<5.6). In the LKS catchment, the volume-weighted pH for the period was 4.90; 80% of the events, corresponding to about 78% of the total precipitation amount, were acidic. HAU, located closer to Changsha city centre, experienced considerably lower pH values and much higher concentrations of Ca2+ and SO
42 in both wet
deposition and bulk deposition.
The sulphate concentration in the wet deposition is much higher than the nitrate concentration both at BLT and at LKS, implying that sulphate is the dominant anion and SO2 the
major acid rain precursor. At BLT, the volume-weighted sulphate concentration in wet deposition was 174 µmolc
L1 for the study period. With an annual precipitation amount
of 1548 mm (based on average values for long-term observations in this area), the corresponding wet deposition was 4.26 gS m2yr1. At LKS, the volume-weighted sulphate
concentration was 152 µmolc L1, and the annual
precipitation amount 1378 mm (also based on long-term observations), giving a wet deposition of 3.37 gS m2yr1.
According to the IMPACTS study at the CJT site (Shao, 2002) dry deposition is important in Hunan catchments. Although difficult to quantify, for 2001 it has been estimated roughly. At the IMPACTS CJT catchment the average SO2
concentration was approximately 20 ìg SO2 m-3 (Shao,
2002). Hence, the average SO2 concentrations in the LKS
and BLT catchments are also assumed to be 20 µg SO2 m3.
The deposition velocity of sulphur dioxide from the atmosphere onto plant foliage and other solid surfaces varies according to the surface. Zhao et al. (1994) estimated the average deposition velocity to be 0.29 cm s1 in rural areas
near Chongqing. However, Larssen et al. (1998) estimated the average deposition velocity to be 0.6 cm s1 in a small
catchment near Guiyang. On the assumption that the average
Table 2. Results for calibration samples. N is number of replicates
N Na K Ca Mg Al NIVA (mg L1) 3.93 1.50 14.6 1.49 3.26 Calibration on ICP (mg L1) 7 4.10 1.55 14.6 1.46 3.66 Deviation (%) 4.3 3.3 0.0 2.0 12.3 Calibration on AAS (mg L1) 4 4.08 1.62 13.2 1.42 3.24 Deviation (%) 3.8 8.0 9.6 4.7 0.6
deposition velocity in the two catchments is 0.6 cm s1, the
dry deposition of SO2 is 1.88 gS m2yr1,, so wet and dry
deposition are about 6.1gS m2yr-1 at BLT and 5.3 gS
m2yr1 at LKS. Sulphate concentration in throughfall was
268 µmolc L1 at BLT and 314 µmmolc L1 at LKS for the
monitoring period. Assuming that annual precipitation amounts (1548 mm at BLT, 1378 mm at LKS) equal the amounts of throughfall, the S depositions were 7.8 gS m2yr1 at BLT and 6.6 gS m2yr1 at LKS respectively.
Compared with the estimates of dry + wet deposition in the catchments given above, these values are 1.7 gS m2yr1
and 1.3 gS m2yr1 higher, respectively. Throughfall amounts
may be less than the annual precipitation but internal S-cycling may also contribute. Furthermore, occult deposition (i.e. fog and dew), common in Hunan, was not measured and is not included in the dry + wet values but may well contribute to the throughfall (Zimmermann and Zimmermann, 2002).
The concentrations in precipitation were generally similar to those found in Chongqing (Zhao et al., 1994, 2001), near Guiyang (Larssen et al., 1998) and at the IMPACTS site CJT (Shao, 2002). However, the NO3- concentration in
precipitation was high (34 mmolc L1 at CJT), perhaps
because of relatively high external inputs of NO3 from the
rice field and, at BLT, from traffic on the nearby highway (Fig. 2). However, nitrification of ammonium during sampling, transport and storage may contribute. Among the cations, Ca2+ dominated, both in precipitation and
throughfall, and accounted for between 39 and 50% of the total positive charge. The ionic strength in throughfall was generally higher than that in wet deposition (Table 3) due to evapotranspiration and washing out of dry deposited ions adhering to the vegetation and of ions released from the vegetation (i.e. internal cycling). Due to neutralisation by carbonate ions in the dry deposition, the H+ concentration
in throughfall is lower than in wet deposition. Also the neutralisation in throughfall can reflect exchange between protons and other cations during foliar leaching. The sum of cations is generally slightly higher than the sum of anions. This anion deficiency (AD) may be due to the neglect of F, I, Cl and organic anions.
STREAM WATER AND SOIL WATER IN THE TWO CATCHMENTS
Concentrations of major anions and cations in stream water and soil water (only BLT) are presented in Table 3. The concentration of SO42, which is the main anion in
precipitation and throughfall, is lower in stream water and soil water than in precipitation despite substantial evapotranspiration. This implies sulphate retention,
Table 3. The pH and chemical composition of deposition and soil water (volume-weighted averages) in the catchments and at HAU. Sites Sample types No. of pH Ca 2+ Mg 2+ Na + K + NH 4 + Ali 3+ SO 4 2-NO 3 -HCO 3 -Cl -Σ cations Σ anions A D samples (µ mol c L -1) % B LT wet deposition 54 4.58± 0.85 96 ±9 20± 1 1 1±1 18 ±1 78 ±1 8 / 174± 16 47± 14 / / 249± 36 219±3 0 11 bulk deposition 54 4.72± 0.80 108± 16 24± 2 16 ±2 24 ±2 71 ±1 8 / 161± 13 62± 18 / / 261± 43 223±3 1 16 Throughfall 24 5.80± 0.60 161± 15 55± 4 1 1±1 92 ±6 70 ±1 4 / 260± 20 79 ±3 2 / / 395± 36 339±5 2 15 soil water 13 4.98± 0.48 84± 7 62± 5 21 ±3 32 ±3 32 ±1 6 40± 3 100±8 11 7± 25 / 10 ±1 281± 38 227±3 3 21 stream water 12 5. 11 ±0.29 89± 5 63± 2 2 2± 1 25 ±2 21 ±9 33 ±2 90 ±5 115± 30 / 8±1 261± 22 214±3 6 20 LK S w et deposition 58 4.90± 1.24 102± 14 17± 2 23 ±2 24 ±3 71 ±1 4 / 152± 12 66± 18 / / 250± 38 218±3 0 14 bulk deposition 58 4.98± 1.10 90± 13 16± 1 21 ±3 27 ±4 47 ±1 8 / 132± 10 49± 22 / / 21 1± 41 181±3 2 16 Throughfall 58 5.10± 0.60 185± 24 140± 12 14 ±2 79 ±5 34 ±1 4 / 301± 28 88 ±2 6 / / 460± 58 389±5 4 16 stream water 12 6.88± 0.40 202± 11 180±8 132± 12 17 ±1 18 ±9 15 ±1 103 ±3 1 14 ±2 4 180±3 8 66 ±4 564± 42 463±6 9 20 H A U wet deposition 58 4.45± 0.80 127± 12 20± 3 17 ±1 14 ±1 78 ±1 4 / 221± 20 46± 8 / / 291± 46 267±2 8 9 bulk deposition 58 4.58± 0.57 11 1± 11 22± 2 19 ±2 12 ±1 61 ±1 6 / 178± 18 43± 5 / / 250± 36 222±2 3 12
/ denotes not analysed or negligible;
Σ
cations denotes the sum of cations;
Σ anions denotes the sum of anions; A D denotes anion deficiency i.e ( Σ cations -Σ anions) /( Σ cations + Σ anions) × 200
presumably by adsorption in the soils in the catchments; this sulphate delays acidification of stream water (Galloway et al., 1983; Liao et al., 1994). The nitrate concentration is higher both in stream and in soil water than in wet deposition and bulk deposition. This may be due partly to evapotranspiration and partly to nitrification of ammonium since the ammonium concentration is lower in stream water than in deposition both at BLT and LKS. High nitrate concentrations in the stream despite no clear cutting of vegetation is in contrast to results from a study in a catchment near Guiyang where Larssen et al. (1998) found the nitrate concentration to be high in soil water and very low in the stream. The nitrate concentration in precipitation was lower in the Guiyang catchment, but this is not likely to be the only reason. A possible cause is more chemical transformation in the field under hot conditions (annual average temperature 16.9°C) that increase bacterial activities and thus nitrification processes. (The annual average temperature is 11.7°C in the Guiyang catchment (http:// www.impacts.net.cn). Differences in the terrestrial systems and the streams may play a role (Bernhardt et al.,2002), but this has not been analysed.
According to Prietzel and Feger (1992) and Cronan and Grigal (1995), harmful effects are likely in North-American and European terrestrial ecosystems when the Al/(Ca+Mg) molar ratio (RCL) is higher than 1.0 in soil water. Despite
high Ali concentration (weighted average value 40 µmolc
L1, Table 2) in soil water at BLT, the R
CL is low (i.e. 0.27),
so that elevated aluminium concentration in soil water due to acid deposition is no immediate threat. However, only a very limited number of soil water samples are available and more investigations are needed.
Surface water acidification is not a major problem in China except possibly in some small first order streams (Zhao et al., 1994; Seip et al., 1999). In agreement with this, stream
water at LKS is close to neutral. However, the pH in the first order stream water at BLT is considerably lower. Clearly, more studies are needed to establish the extent of surface water acidification in the Changsha region. The high pH in the stream at LKS shows that the percolating water has been in contact with neutralising soil and/or bedrock.
SOIL CHEMISTRY IN THE TWO CATCHMENTS
The buffer capacity of the soil plays an important role in ecosystem resistance to acidification. Soil buffer capacity is related to soil acidity, soil organic substances, exchangeable cations, sulphate sorption capacity, as well as aluminium and iron mobilisation. Acid precipitation affects soil properties by increasing acidity and the mobilization of Al and Fe, and by decreasing base saturation and the rate of organic matter degradation and by changing microbiological activity (NEGTAP, 2001).
Some major soil properties (pH, SOM, CECe, base
saturation (BS), aluminium saturation (AlS) and Al and Fe pools) for ten forest soil profiles (four horizons from each) collected from the two Hunan catchments are given in Figs. 3 and 4 and Table 1. The soil pH values in water ranged from 3.94 to 5.19 and BS varied from 6.9 to 51.8%. In general, pH increases with depth and is lower at BLT than at LKS, especially in the O-horizon (Fig. 3). This is in agreement with the higher AlS and lower BS at BLT than at LKS (Table 1). As commonly found, SOM is highest in the topsoil and generally higher in the more acid BLT than in LKS. The CECe is more variable in the more organic rich
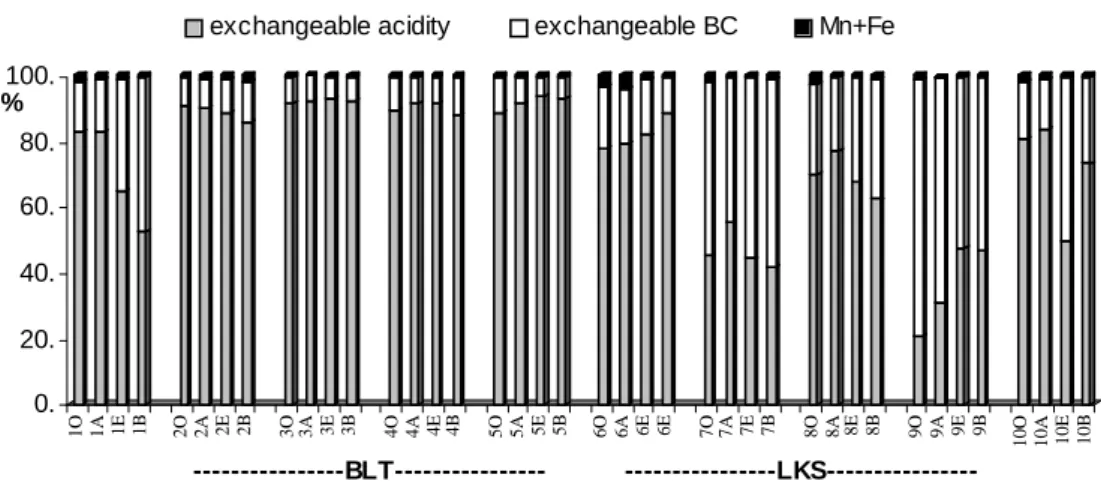
BLT than at LKS (Table 1). Generally, exchangeable acidity is higher at BLT than at LKS (Fig.4). This is in agreement with the higher pH at LKS than at BLT (Fig.3).
Aluminium and iron are the most abundant metallic elements (e.g. Al2O3, 15.9%; FeO, 9.1%) in the continental
0. 20. 40. 60. 80. 100. % 1O 1A 1E 1B 2O 2A 2E 2B 3O 3A 3E 3B 4O 4A 4E 4B 5O 5A 5E 5B 6O 6A 6E 6E 7O 7A 7E 7B 8O 8A 8E 8B 9O 9A 9E 9B
10O 10A 10E 10B
---BLT---
---LKS---exchangeable acidity exchangeable BC Mn+Fe
Fig. 4. The composition of the exchangeable cations in soils (The sum of Al3+ and H+ gives exchangeable acidity; the sum of Ca2+, Mg 2+, K+ and Na+ gives exchangeable BC)
crust (Taylor and McLennan, 1985). They occur in soils in various operationally defined forms. In addition to those mentioned earlier, there are crystalline forms, but these were not determined in this study. Aluminium and iron in these pools are less available although weathering processes in soils and bedrock may make elements from these pools available in the future.
Al- and Fe-pools are larger (except for Feox) in the more
acid BLT soils than at LKS (Table 1). The spatial variations in sizes of the Al-pools and Fe-pools are considerable in the two catchments and the ratios Alp/Alox and Fep/Feox are
very different at the two sites.
Generally one would expect the easily available mineral bound Al and Fe pools (Alox & Feox) to be larger than the
amount of Al and Fe strongly bound to organic matter (Alp
& Fep), i.e. Alp/Alox and Fep/Feox less than unity, because
the former comprises both organically bound and amorphous Al (Fe). However, an Alp/Alox ratio greater than unity may
be found at sites with highly weathered soils as seen for BLT. The different ratios between BLT and LKS are due to much larger Alp and Fep values at BLT (the values correlate
well with SOM) while Alox and Feox are more similar at the
two sites. Liao et al. (1998) found ratios above one in soils from Chongqing (at Nanshan), Guiyang suburbs and in Hunan (at Huitang). Furthermore, Merino et al. (1994) reported that Alp exceeded Alox in some soils in Spain.
Alex ranges from 1.46 cmolc kg-1 in a subsoil horizon to
6.90 cmolc kg-1 in an organic soil horizon. Alc is between
2.0 and 4.5 times Alex, while Alp is between 1.8 and 5.5 times
Alc. The sizes of the Al-pools in the soils in the two
catchments are in the same range as in the acidic forest soils in Chongqing and Guiyang (Liao et al., 1997) and in acidic forest soils in Europe and North America (Koptsik and Mukhina, 1995; Koptsik and Koptsik, 1995; Koptsik and
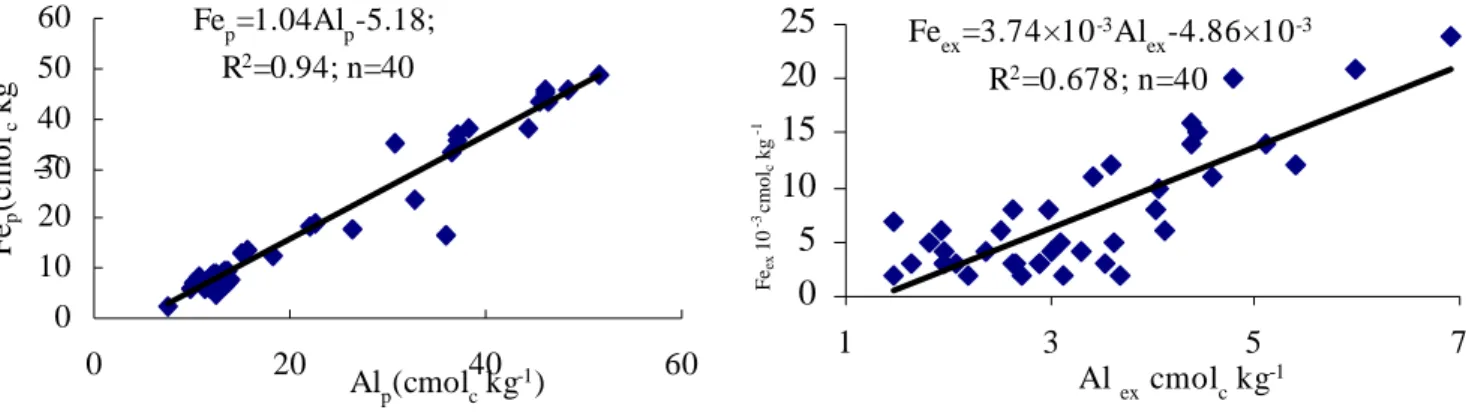
Silaeva, 1996; Matzner and Prenzel, 1992; Dahlgren and Walker, 1993; Berggren and Mulder, 1995). The concentration of exchangeable Fe is low, which may limit the availability of this important plant nutrient (Wang et al., 1989). However, Fe in less available pools is abundant. Because there are significant correlations between Fe-pools and Al-pools (Fig. 5), it seems likely that a large release of available nutritional Fe will be accompanied by a high release of toxic Al.
Discussion
ASSESSMENT OF PRESENT SOIL STATUS AND POTENTIAL FUTURE SOIL ACIDIFICATION FOR THE TWO SMALL CATCHMENTS
Soil acid status and potential acidification may be assessed by pH, CECe, BS and exchangeable aluminium. Table 4 lists
the soil acidity classification based on these parameters as suggested in SwEPA (2000). The classification applies to soil samples taken from the top horizon in mature forest soil.
Fig. 5. Relationships between Fep and Alp and between Feex and Alex. Both correlations are significant with p<0.001.
Fep=1.04Alp-5.18; R2=0.94; n=40 0 10 20 30 40 50 60 0 20 40 60 Alp(cmolc kg-1) Fe p (cmol c kg -1) Feex=3.74×10⁻³Al ex-4.86×10 -3 R2=0.678; n=40
0
5
10
15
20
25
1 3 5 7 Al ex cmolc kg-1 Fe ex 10 -3 cm olc kg -1Table 4. Soil acididity of present soil status and potential future
soil acidification for the two small catchements
Class Acidity pHH2O Effective base Exchangeable
saturation (%) aluminim (cmolc kg1) 12 Low >5.5 >50 <0.9 3 Moderate 4.45.5 1050 0.93 4 High 4.04.4 610 33.6 5 Very high <4.0 <6 >3.6
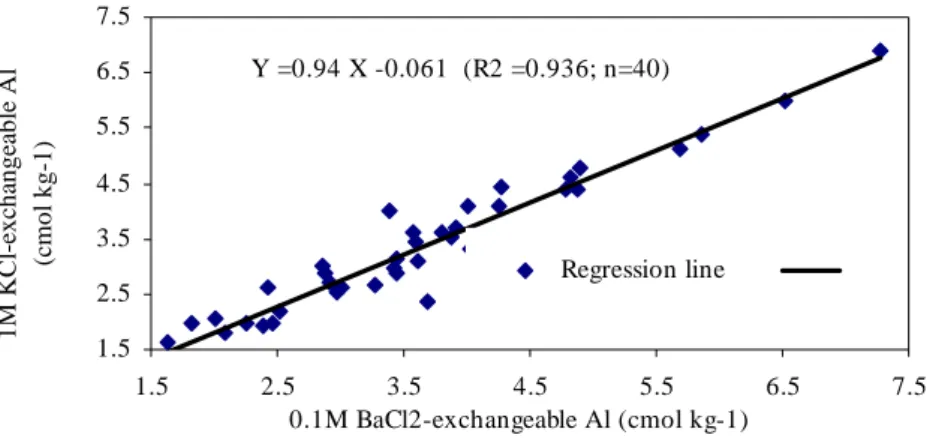
The soil is assigned to the acidity class indicated by its pH value if at least one of the other two parameters falls into the same class. If two other parameters fall into a higher or lower class, the classification is adjusted one step up or down, accordingly. A possible problem in applying the scheme is that 1M KCl extraction was recommended to determine the exchangeable aluminium (Lu, 1999), while 0.1M BaCl2 extraction was used in this study as requested
in the IMPACTS project manual (Vogt et al., 2001). Therefore, values obtained with the two methods were compared (see Fig. 6). Although the exchangeable aluminium is higher when extracted with 1M KCl rather than with 0.1 M BaCl2, the difference is small and does not
affect the classification.
The relevant parameters and soil acidity classification are
listed in Table 5. Exchangeable Al was calculated by averaging exchangeable Al values for the topsoils from all sampling plots. The soil at BLT is thereby classified as having high acidity (class 4), while LKS is considered to be moderately acid (class 3).
The SwEPA scheme does not include all relevant factors and it may be useful to supplement it with the sensitivity scheme proposed by Tao and Feng (2000), who suggested that the relative sensitivity be determined by identifying a limited number of variables such as bedrock lithology, soil type, land cover and moisture profit and loss. These variables are merged into a small number of categories to which weights are assigned. Combining the four factors and their weights, five relative sensitivity classes (01, least; 2, slightly; 3, medium; 4, high; 56, most) were given by Tao
Table 6. Factors and their weights in the sensitivity scheme proposed by Tao and Feng (2000). Factors (weights) BLT (weights) LKS (weights)
Rock Type (1) Granite (1) Shale (0) Soil type (1) Red earth (1) Red earth (1) Land cover (2) Coniferous forest (1) Coniferous forest (1) Moisture profit and loss (2) 300-600 mm yr-1 (0.5) 300-600 mm yr-1 (0.5) Moisture profit and loss was calculated as precipitation minus potential evapotranspiration.
Table 5. The relevant parameters and soil acidity classification
Catchments pHH2O Effective Exchangeable Class
base saturation (%) aluminium (cmolc kg-1)
BLT 4.2 10.0 5.34 4 LKS 4.5 34.8 2.90 3 Y =0.94 X -0.061 (R2 =0.936; n=40) 1.5 2.5 3.5 4.5 5.5 6.5 7.5 1.5 2.5 3.5 4.5 5.5 6.5 7.5 0.1M BaCl2-exchangeable Al (cmol kg-1) 1 M K C l-ex ch an g eab le A l (c mol kg-1) Regression line
Fig. 6. Comparison of exchangeable aluminium extracted by 1M KCl and by 0.1M BaCl2
and Feng (2000). The relevant factors and their weights in the two Hunan catchments are listed in Table 6. BLT is in the most sensitive class with weight 5, while LKS is highly sensitive (weight 4). This is in general agreement with the results of the SwEPA (2000) scheme (Table 5).
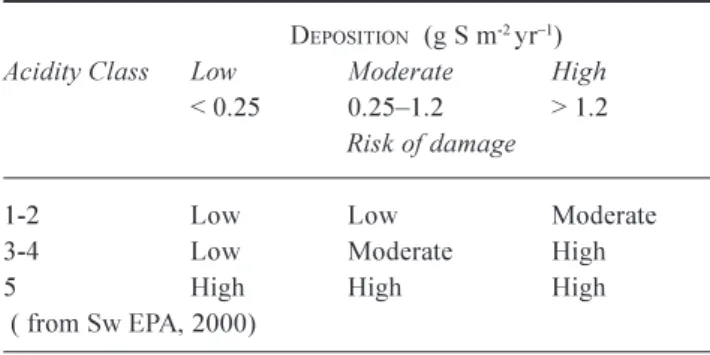
SwEPA (2000) also gives the risk of future damage due to acidifcation at various deposition levels for the soil classes (Table 7)
The annual S-deposition has been estimated as 56 gS m2yr1 in the BLT and LKS catchments, i.e. much
more than 1.2 gS m2yr1. Considering that the soils are in
acidity class 4 and 3, respectively, long-term risk of damage from soil water acidification is high according to this scheme. However, a number of factors complicate the picture. The high deposition of calcium mitigating soil acidification may be the most important. A better indication of potential future acidification may be obtained by including N-compounds and subtract metal base cations in the deposition. Neglecting dry deposition, which is very uncertain, we calculate ([SO42-] + [NO3-] + [NH4+]) ([Ca2+]
+ [Mg2+] + [Na+] + [K+]) in precipitation. Using wet
deposition data (Table 3) the difference amounts to 154 µmolcL1 for BLT and 123 mmolcL1 for LKS,
corresponding to depositions of about 240 µmolcm-2 and
170 µmolcm2, respectively. If the weathering is less than
this, acidification is likely to occur in the long-term. This assumes that ammonium is nitrified and that all nitrate is leached which leads to an overestimation. However, in view of the high nitrate concentrations in streamwater, the approximation seems acceptable. Further, it ignores sulphate retention while the observations indicate significant retention which also contributes to exaggerating acidification before the retention becomes negligible. On the other hand, the calcium deposition may be related in part to anthropogenic emissions; these may be reduced in future so that more acidification than predicted would result. Notwithstanding the high sensitivity and large S-deposition, damage to vegetation has yet to be reported in the two small catchments.
Conclusions
Sulphur deposition in Hunan Province is high, about 56 gS m2yr1 at the two sites studied. The deposition of
oxidized and reduced nitrogen is also considerable but is probably less than the S-deposition. However, in soil and stream water, the nitrate concentrations are actually higher than the sulphate concentrations on an equivalent basis so N-deposition may play an important role in acidification. Some sulphate is adsorbed in the soils; this may have delayed and is still delaying acidification. So far, no clear signs of damage to vegetation have been documented. However, based on soil pH, base saturation and exchangeable aluminium, there is a risk of ecosystem damage due to acidification particularly in the BLT catchment if the deposition is not reduced. The Ca-deposition in the catchment is high and it seems likely that a considerable contribution is from made sources. A reduction in man-made Ca emission in the future may increase acidification, which would make the situation more serious (Larssen et al., 2001). Other studies have shown that this applies to large areas in southern China. The stream in one of the studied catchments is neutral while average pH in the stream in the other catchment is about 5. The extent of water acidification in Hunan is not known but other studies have indicated that water acidification is not a serious problem in China. However, further studies, necessary to quantify the potential damage, include investigations in small catchments as described here, regional mapping of sensitive soils and waters, and modelling studies.
Despite its limitations, this study corroborates the need for reductions in sulphur emissions. The goal of a 10% nation wide reduction and a 20% reduction in two controlling zone from 2000 to 2005 (SEPA, 2002) is a good start but further reductions are probably needed.
Acknowledgements
This work is financially supported in part by the Chinese Ministry of Education Comprehensive study of acid deposition and soil acidification in a small catchment near Changsha (2000 65-HN005). The authors thank Mr. Liu Peng, Ms. Huang Yunxiang, Mr. Zhang Yong and Mr. Zeng Min for collecting and analysing field samples. Dr Thorjorn Larssen is thanked for fruitful discussions and for his valuable comments on the manuscript.
References
Amann, M., 2001. Emission inventories, emission control options and control strategies: An overview of recent developments.
Water Air Soil Pollut., 130, 4350. Table 7. Long-term risk of damage from soil acidification
DEPOSITION (g S m-2yr1)
Acidity Class Low Moderate High
< 0.25 0.251.2 > 1.2 Risk of damage
1-2 Low Low Moderate 3-4 Low Moderate High
5 High High High
APHA (American Public Health Association), AWWA, WPCF, 1985. Standard Methods for the Examination of Water and
Wastewater, Annual Book of ASTM Standards 16th ed.
Washington, DC, USA.
Barnes, R.B., 1975. The determination of specific forms of aluminium in natural water. Chem. Geol. 15, 177199. Berggren, D. and Mulder, J., 1995. The role of organic matter in
controlling aluminium solubility in acidic mineral soil horizons.
Geochem. Acta, 59, 41674180.
Bernhardt, E .S., Hall, R.O. and Likens, G.E., 2002. Whole-system Estimates of Nitrification and Nitrate Uptake in Streams of the Hubbard Brook Experimental Forest. Ecosystems, 5, 419430. Chen Ming, Tan Jianan and Sun Fuchen, 1993. Research on the mechanisms of NO3- and SO42- adsorption in red soil in southern
Hunan. Environ. Chem. (in Chinese), 12, 252257.
Chen Ming, Tan Jianan and Sun Fuchen., 1995. Reseach on the mechanisms of sulfate adsorption in quaternary red soil in southern Hunan. Environ.l Chem. (in Chinese), 14, 129133. Christophersen, N., Seip, H.M. and Wright, R.F., 1982. A model
for streamwater chemistry at Birkenes, Norway. Water Resour.
Res., 18, 977996.
Cronan, C.S. and Grigal, D.F., 1995. Use of Calcium/Aluminum Ratios as Indicators of Stress in Forest Ecosystems. J. Environ.
Qual., 24, 209226.
Dahlgren, R.A. and Walker, W.J., 1993. Aluminum release rates from selected spodosol BS horizons effect of pH and solid state aluminum pools. Geochim. Cosmochim. Acta, 57, 5766. Dambrine, E., Probst, A., Viville, D, Biron, P., Paces, T., Novak, M., Buzek. and Cerny, J., 2000. Spatial variability and long term trends in mass balance of N and S in central European forested catchments. In: Ecological Studies; Carbon and
Nitrogen cycling in European Forested Ecosystems, E.D.
Schulze (Ed.), Springer, Dordrecht, Chap. 19, 405418. Department of Chemistry Columbus State University, 2000.
Precipitation Titrations Mohr Method of Chloride Determination, Quantitative Analysis Lab Manual. Chemistry
2315 (http://patellab.slu.edu/user/sbuckner/homepage)
Driscoll, C.T., 1984. A procedure for the fractionation of aqueous aluminum in dilute acidic waters. Int. J. Environ. Chem., 16, 267283.
Driscoll, C.T., Otton, J.K. and Iverfeldt, Å., 1994. In : SCOPE 51, Biogeochemistry of Small Catchments - A Tool for Environmental Research, B. Moldan and J. Cerny, (Eds.) Chapter3:Atmospheric Chemical Input to Small Catchments . Chapter13: Trace Metals Speciation and Cycling. http:// www.icsu-scope.org
Duan Lei, Hao Jiming, Xie Shaodong, Zhou Zhongping and Ye Xuemei., 2002. Determining weathering rates of soils in China.
Geoderma, 110, 205225.
Galloway, J.N., Norton, S.A. and Church, M.R., 1983. Freshwater acidification from atmospheric deposition of sulfuric acid: A conceptual model. Environ. Sci. Technol., 17, 541545. GB 7479-87, 1989. Water qualityDetermination of ammonium
Nesslers reagent colorimetric method. Analysis and monitoring methods for water and wastewater (3rd ed.). Chinese
Environmental Sciences Publishing HouseÿBeijing, China (in Chinese),
Gran, G., 1950. Determination of the equivalence point in potentiometric titration. Acta Chem. Scan., 4, 559577. Gran, G., 1952. Determination of the equivalence point in
potentiometric titration. Part II. Analyst, 77, 661.
Hao, J., Duan, L. and Xie, S., 1999. Mapping the relative sensitivity of soils to acid deposition in China. Environ. Sci. (in Chinese), 15.
Hendershot, W.H. and Duquette, M., 1986. A simple barium chloride method for determining cation exchange capacity and exchangeable cations. Soil Sci. Soc. Amer. J., 50, 605608. IMPACTS, 2003. Integrated Monitoring Program on Acidification
of Chinese Terrestrial Systems. http://www.impacts.net.cn/ ISO, 1994. Soil quality - Determination of pH. International
standard, ISO10390, 5pp.
Jou, A.S.R. and Kamprath, E.J., 1979. Copper chloride as an extractant for estimating the potentially reactive aluminium pool in acid soils. Soil Sci. Soc. Amer. J., 43, 3538.
Koptsik, G. and Mukhina, I., 1995. Effects of acid deposition on acidity and exchangeable cations in Podzols of the Kola Peninsula. Water Air SoilPollut., 85, 12091214.
Koptsik, G. and Koptsik, S., 1995. Critical loads of acid deposition for forest ecosystems in the Kola Peninsula. Water Air Soil
Pollut., 85, 25532558.
Koptsik, G.N. and Silaeva, E.D., 1996. Buffering capacity of forest litters to acid atmospheric precipitation, Eurasian Soil Sci., 28, 124136.
Kuylenstierna, J.C.I., Rodhe, H., Cinderby, S. and Hicks, K., 2001. Acidification in developing countries; Ecosystem sensitivity and the critical load approach on a global scale. Ambio, 30, 2028. Larssen, T., Xiong, J., Vogt, R.D., Seip, H. M., Liao, B. and Zhao, D., 1998. Studies of soils, soil water and stream water at a small catchment near Guiyang, China. Water Air Soil Pollut., 101, 137162.
Larssen, T., Seip, H.M., Carmichael, G.R. and Schnoor, J.L., 2001. The importance of calcium deposition in assessing impacts of acid deposition in China. Water Air Soil Pollut., 130, 1635 1640.
Li, W. and Gao, J., 2002. Acid deposition and integrated zoning control in China. Environ. Manage., 30, 169182.
Liao, B. and Li, C., 1989. A study on the buffering mechanism of soils. Environ. Sci. (in Chinese), 10, 3034.
Liao, B., Larssen, T., Seip, H.M. and Vogt, R.D., 1994. Anion adsorption and aluminum release from Chinese soils treated with different concentrations of (NH4)2SO4 and NH4NO3. J. Ecol. Chem., 3, 281301.
Liao, B., Seip, H.M.and Larssen, T., 1997. Response of two Chinese forest soils to acidic input: leaching experiment.
Geoderma, 75, 5373.
Liao, B., Larssen, T. and Seip, H.M., 1998. Response of five Chinese forest soils to acidic input: batch experiment.
Geoderma, 86, 295316.
Likens, G.E., Driscoll, C.T., Buso, D.C.,Mitchell, M.J., Lovett, G.M., Bailey, S.W.,. Siccama, T.G., Reiners, W. A. and Alewell, C., 2002. The biogeochemistry of sulfur at Hubbard Brook.
Biogeochemistry 60, 235316.
Lu, R., 1999. Analyses methods of soil and agricultural chemical. Agricultural Sciences Publishing House, Beijing, China (in Chinese)
Matzner, E. and Prenzel, J., 1992. Acid deposition in the German Solling area: effects on soil solution chemistry and Al mobilization. Water Air Soil Pollut., 61, 221234.
McKeague, J.A. and Day, J.H., 1966. Dithionite- and oxalate-extractable Fe and Al as aids in differentiating various classes of soil. Can. J. Soil Sci., 46, 1322.
Merino, A., Alvarez, E. and Garcia-Rodeja, E., 1994. Response of some soils of Galicia (NW Spain) to H2SO4 acidification. Water Air Soil Pollut., 74, 89101.
Neal, C., Smith, C.J., Walls, J., Billingham, P., Hill, S. and Neal, M., 1990, Hydrochemical variations in Hafren forest stream waters, Mid Wales. J. Hydrol., 116, 186200.
NEGTAP (The National Expert Group on Transboundary Air Pollution), 2001. Transboundary Air Pollution: Acidification,
Eutrophication and Ground-Level Ozone in the UK. The UK
NEGTAP report 2001, Chapter 5: effects on soils. (www.emep.int/assessment). 98110.
Nilsson, S.I., Why is Lake Gårdsjon acid? An evaluation of processes contributing to soil and water acidification. Ecol. Bull. (Stockholm), 37, 311318..
Prietzel, J. and Feger, K.H., 1992. Dynamics of aqueous aluminium species in podzol affected by experimental MgSO4 and
(NH4)2SO4 treatments. Water Air Soil Pollut.. 65, 153173.
Probst, A., Dambrine, E., Viville, D. and Pritz, B., 1990. Influence of acid atmospheric inputs on surface water chemistry and mineral fluxes in a declining spruce stand within a small granite catchment (Vosges Massif, France). J. Hydrol., 116, 101124. Richter, D.D. and Lindberg, S.E., 1988. Incident precipitation and forest canopy throughfall: Analyses of sampling methods. J.
Environ. Qual., 17, 619622.
Rodhe, H., Grennfelt, P., Wisniewski, J., Agren, C., Bengtsson, G., Johansson,K., Kauppi, P., Kucera, V., Rasmussen, L., Rosseland., B., Schotte, L. and Selldén, G., 1995. Acid Reign 95conference summary statement. Water Air Soil Pollut.,
85, 114.
Schecher, W. and Driscoll, C.T., 1987. An evaluation of uncertainty associated with aluminum equilibrium calculations. Water
Resour. Res., 23, 525535.
Seip, H.M., Aagaard, P., Angell, V., Eilertsen, O., Larssen, T., Lydersen, E., Mulder, J., Muniz, I.P., Semb, A., Tang, D., Vogt, R.D., Xiao, J., Xiong, J., Zhao, D. and Kong, G., 1999. Acidification in China: Assessment based on studies at forested sites from Chongqing to Guangzhou. Ambio,28, 522528. SEPA, 2000.Report on the state of environment in China (SoE
China 000), State Environmental Protection Administration.
(http://www.zhb.gov.cn) Atmospheric Environment. p1 SEPA, 2001, Information of Environment (in Chinese), 2001.5.28,
146(9), State Environmental Protection Administration. SEPA, 2002, The National tenth five-year Plan for Environmental
Protection, State Environmental Protection Administration,
Beijing, 5pp.
Shao, M., 2002. Acid deposition from IMPACT sites; chemistry
and variation. Presentation at IMPACTS Mid-term Conference,
Beijing, Nov. 2002. http://www.impacts.net.cn/
Skoog, Holler and Neiman, 1998. Principles of Instrumental
Analysis 5th Edition. Harcourt Brace and Co., Orlando, USA .
Chapters 7, 13 and 14
Stoddard, J.L., 1991. Trends in Catskill stream water quality Evidence from historical data : Water Resour. Res. 27, 2855 2864.
SwEPA, 2000. Acidification of forest land. Swedish Environmental Protection Agency (http://www.internat.environ.se)
Taylor, S.R. and McLennan, S.M., 1985. The Continental Crust:
Its Composition and Evolution Blackwell Scientific
Publications. Geoscience. Blackwell, Oxford, UK. 312 pp. Tao Fulu and Feng Zongwei., 2000, Terrstrial ecosystem sensitivity
to acid deposition in South China. Water Air Soil Pollut., 118, 231243
Van Reeuwijk, L.P., (Ed.), 1995. Procedures for Soil Analysis (3rd
edn.). ISRIC, Wageningen, The Netherlands, 12-1-8.
Vogt, R.D., Mortensen, T., Mulder, J., Solberg, S. and Aas, W., 2001. Cai Jia Tang (CJT) monitoring site, Hunan province.
Catchment Manual, IMPACTS project: Integrated Monitoring Program on Acidification of Chinese Terrestrial Systems. NIVA,
Postboks 173, Kjelsås 0411 Oslo, Norway. 29pp. (http// www.waterquality.crc.org.au/nom/Vogt.doc)
Wang, Y.G., Sheng, P.L. and Yuan, D.W., 1989.,Effects of Simulated Acid Rain on Leaching And Availability of Soil Metal Ions. Environ. Sci. (in Chinese), 9, 22-26.
West, A.J., Findlay, S.E.G., Burns, D.A., Weathers, K.C. and Lovett, G.M., 2001. Catchment-scale variation in the nitrate concentrations of groundwater seeps in the Catskill Mountains, New York, USA. Water Air Soil Pollut., 132, 389400. Williams, M.W., Yang, D., Liu, F., Turk, J. and Melack, J.M.,
1995. Controls on the major ion chemistry of the Urümqi river, Tian Shan, P. R. China. J. Hydrol. 172, 209229.
Zhao, D., Seip, H. M., Zhao, D.W. and Zhang, D., 1994, Pattern and cause of acidic deposition in the Chongqing region, Sichuan province, China. Water Air Soil Pollut., 77, 2748.
Zhao, D., Larssen, T., Zhang, D., Gao, S., Vogt, R.D., Seip, H.M. and Lund, O.J., 2001. Acid deposition and acidification of soil and water in the Tie Shan Ping area, Chongqing, China. Water
Air Soil Pollut., 130, 17331738.
Zimmermann, L. and Zimmermann, F., 2002, Fog deposition to Norway spruce stands at high-elevation sites in the Eastern Erzgebirge (Germany). J. Hydrol. 256, 166175.