1
E-Commerce Based Closed-Loop Supply Chain for Plastic Recycling By
Saikat Banerjee
Bachelor of Technology (B. Tech), Computer Science & Engineering West Bengal University of Technology (2010)
SUBMITTED TO THE PROGRAM IN SUPPLY CHAIN MANAGEMENT IN PARTIAL FULFILLMENT OF THE REQUIREMENTS FOR THE DEGREE OF
MASTER OF ENGINEERING IN SUPPLY CHAIN MANAGEMENT AT THE
MASSACHUSETTS INSTITUTE OF TECHNOLOGY (MIT) MAY 2020
© 2020 Saikat Banerjee. All Rights Reserved
The author hereby grants to MIT permission to reproduce and to distribute publicly paper and electronic copies of this thesis document in whole or in part in any medium now known or
hereafter created.
Signature of Author: ____________________________________________________________ Department of Supply Chain Management
May 2020
Certified by: ___________________________________________________________________ Dr. Eva Maria Ponce Cueto Executive Director, MITx MicroMaster’s in Supply Chain Management Director, Omnichannel Distribution Strategies
Certified by: ___________________________________________________________________ Ms. Suzanne Greene Program Manager, MIT Sustainable Supply Chains
Accepted by: __________________________________________________________________ Dr. Yossi Sheffi Director, Center for Transportation and Logistics Elisha Gray II Professor of Engineering Systems Professor, Civil and Environmental Engineering
2
3
E-Commerce Based Closed-Loop Supply Chain for Plastic Recycling By
Saikat Banerjee
Submitted to The Program in Supply Chain Management on May 8, 2020 in Partial Fulfillment of the
Requirements for the Degree of Master of Engineering in Supply Chain Management
ABSTRACT
The world is facing a grave plastic waste problem. It is not new that we hear about oceanic death and morbid landfills. Only 8% of all the plastic produced is recycled in the US. This grotesque situation has been worsened by the Chinese ban of plastic waste imports from the developed western nations as of 2018. In this research we assess the feasibility of a novel approach to using existing e-commerce reverse logistics channels to take back post-consumer plastic. We use product sales data to estimate the post-consumer plastic volume. We then, design a mixed integer linear programming (MILP) based optimization model to assess different take-back routes and calculate various operational costs. In addition to the optimization model we determine the feasibility of this process by considering cost offsets such as price of virgin plastics. After that, we conduct a scenario-based sensitivity analysis to understand systemic cost and overall profit. We used the results of these analyses to formulate the strategic recommendations for companies interested in promoting or implementing e-commerce-based recycling programs. Finally, we assess the greenhouse gas emissions and corresponding externality costs through this process and perform a qualitative assessment of the stakeholder networks vital to making such a system operational. In conclusion, our results suggest that in certain scenarios it is economically feasible to facilitate a take-back process for post-consumer plastic using existing e-commerce-based reverse logistics channels while maintaining minimal additional emissions in the process.
Thesis Advisor: Dr. Eva Maria Ponce Cueto
Title: Executive Director, MITx MicroMasters in Supply Chain Management Director, OmniChannel Distribution Strategies
Thesis Co-Advisor: Ms. Suzanne Greene
4
5
Acknowledgments
First and foremost, I would like to thank my thesis advisors, Dr. Eva Ponce and Ms. Suzanne Greene, for their unwavering support, patience, and guidance. This thesis has been possible largely due to the time and resources they have invested in this work. Suzanne once told me, “I am pushing you to be the best”. I have always remembered that, and hope she feels the same after reading this paper. Eva has been my sounding board for my mathematical thought-process throughout this research endeavor. I would always be grateful to Eva and Suzanne. Thank you!
I am grateful to Dr. Tugba Efendigil for working with me to streamline the data collection process with respect to the location data and data related to the various systemic costs. Tugba has been a mentor and a friend throughout the process.
Thanks to my thesis committee members, Dr. Chris Caplice, Dr. Jarrod Goentzel, Dr. Josue Velazquez Martinez, and Dr. Maria Jesus Saenz, for their periodic feedback and suggestions to improve the output of my research.
In addition, I would like to thank Pamela Siska and Toby Gooley for reviewing the manuscript and providing valuable feedback. In Fall ’19, Pamela helped me articulate my thoughts better while I was composing the Introduction, Problem Statement and Literature Review sections of this paper. In Spring ’20, I benefited from the detail-oriented nature of Toby while reviewing this entire document. I am so grateful that I had an opportunity to work with Toby, without whom, the reader would be deprived of the pleasure, I would assume she would get from reading this paper.
Also, thanks to Justin Snow and Robert Cummings for all the administrative help during the program.
I would like to thank my parents, my father, Mr. Samir Kumar Banerjee, who introduced me to Mathematics and encouraged me to take up challenges, making sure, I landed on softer ground if I failed; and my mother, Mrs. Runu Banerjee, who once told me, “If you do something,
do it well, else don’t do it”. I will always remember that. Thank you for being a support system
that I could constantly count on.
Finally, I would like to thank my wife, Ahana Roy Choudhury Banerjee for always being a patient listener and an active compass from the initial ideation of this research to its completion, constantly supporting me in all ways possible. This work would not have been possible without her kindness and intellectual largess.
6
7
Table of Contents
Table of Contents ... 7 List of Figures ... 8 List of Tables ... 9 1. Introduction ... 102. Problem Setting and Objectives ... 15
3. Literature Review ... 17
3.1 Policies on Plastics ... 18
3.2 Consumer Response to Plastic Recycling and Take-Back Programs ... 21
3.3 Recycling and the Potential Use of Collecting Post-Consumer Plastic ... 21
3.4 Use of Reverse Logistics in Take-Back for Recycling ... 23
3.5 Use of E-Commerce in the Take-Back Process ... 24
3.6 Aspects of Cost in the Take-Back Mechanisms ... 26
3.7 Conclusion of Literature Review ... 27
4. Methodology ... 29
4.1 Data Collection ... 29
4.2 Data Cleaning and Preparation ... 31
4.3 Initial Data Analysis ... 33
4.4 Problem Formulation Using A Network Design Approach ... 35
4.5 Cost Analysis ... 38
4.6 Scenario-Based Sensitivity Analysis ... 40
4.7 Recommendations ... 41
5. Results ... 43
5.1 Initial Data Analysis ... 43
5.2 Optimized Routes and Corresponding Distances ... 45
5.3 Margin and Cost Analysis based on Demand ... 47
5.4 Scenario-based Sensitivity Analysis ... 49
6. Discussion ... 63
6.1 Sensitivity Parameter-Based Analysis of the Results ... 63
6.2 Stakeholder Incentive Analysis ... 65
6.3 Recommendation ... 69
6.4 Contribution ... 70
7. Conclusion ... 71
References ... 73
Appendix ... 78
A. Amount of Plastic Generated by County ... 78
B. County ID Mapping ... 81
C. MRF ID Mapping ... 82
D. Amazon Warehouse ID Mapping ... 83
E. Cost, Price and Margin Calculation ... 84
8
List of Figures
Figure 1. Distribution of primary plastic production in different industries ... 11
Figure 2. Spread of plastic waste production in different industries ... 12
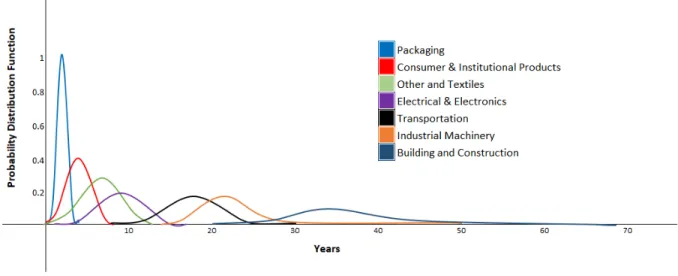
Figure 3. Probability distribution of product lifetime across industries ... 13
Figure 4. Classic reverse logistics flow adapted from ... 25
Figure 5. Volume of plastic sold by CPG companies in all of US by plastic classes ... 33
Figure 6. Per capita income for New England states relative to per capita income in the US ... 34
Figure 7. Population ratio of New England states relative to US population ... 34
Figure 8. Total plastics sold through CPG products in New England states ... 34
Figure 9 Plastic sold by plastic classes in New England states ... 34
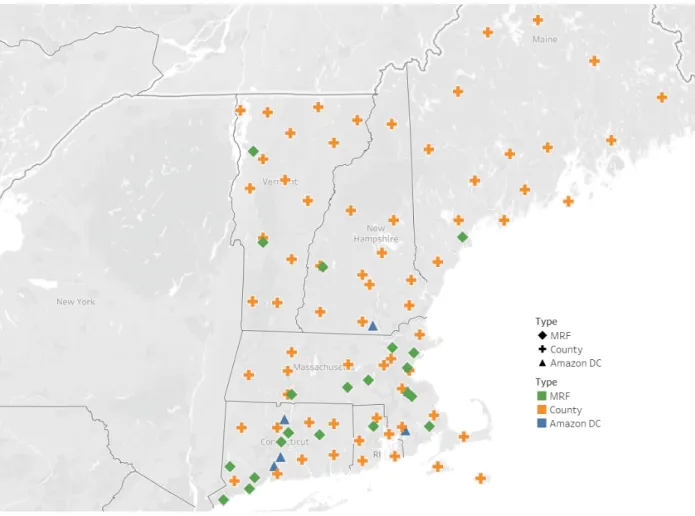
Figure 10. Lat-Long plot of County centroids, Amazon Warehouses and MRFs in the New England ... 35
9
List of Tables
Table 5.1.1 Overall weight of plastics by annual sales in CPG Industry ... 43
Table 5.1.2 Per capita income by New England states ... 44
Table 5.1.3 Population ratio of New England states ... 44
Table 5.1.4 Plastic sold by plastic type by county in New England (in Metric Tons) …... 45
Table 5.2.1 Distance Matrix …………... 46
Table 5.3.1 Aggregated cost and price calculation for all the counties by plastic classes ... 48
Table 5.4.0 Parameters for sensitivity-analysis... 49
Table 5.4.1 Base case scenario for sensitivity analysis... 50
Table 5.4.2 Lower transportation cost scenario for sensitivity analysis... 51
Table 5.4.3 Larger service area within a county ... 52
Table 5.4.4 Partnering to share logistics cost ... 53
Table 5.4.5 Impact of capacity of vehicle ... 54
Table 5.4.6.1 Impact of percentage of the vehicle capacity used in Type 1 vehicle ... 55
Table 5.4.6.2 Impact of percentage of the vehicle capacity used in Type 1 vehicle ... 56
Table 5.4.7.1 Impact of percentage of the vehicle capacity used in Type 2 vehicle ... 57
Table 5.4.7.2 Impact of percentage of the vehicle capacity used in Type 2 vehicle ... 58
Table 5.4.8.1 Emissions in Type 1 vehicle ... 60
Table 5.4.8.2 Emissions in Type 2 vehicle ... 60
Table 5.4.9 Impact of customer incentives ... 62
Appendix A Amount of Plastic Generated by County ... 78
Appendix B County ID Mapping ... 81
Appendix C MRF ID Mapping ... 82
Appendix D Amazon Warehouse ID Mapping ... 83
Appendix E Cost, Price, and Margin Calculation ... 84
10
1. Introduction
Plastic waste is one of the primary global challenges facing humanity and our environment in the 21st century, creating intense inspection from consumers and industry into the life cycle of non-biodegradable plastic (Verma, Vinoda, Papireddy, & Gowda, 2016), (Narancic & O’Connor, 2019), (Chow, So, Cheung, & Yeung, 2017). The mismanagement of plastic waste is polluting the oceans, and this proliferation, if not checked, will add to the massive waste problem currently threatening the world (Jambeck et al., 2015), (Verma et al., 2016); (Tammemagi, 1999). In 2017, 35.3 million tons of plastic was generated in the US, out of which 2.9 million tons were recycled, 5.6 million tons were incinerated, and 26.8 million tons, a staggering 75.8%, were landfilled, (US EPA, n.d.). The incineration of the plastic impacts air quality, which further threatens the environment and poses a significant threat to human beings unless it is managed in a controlled environment, as in some of the Nordic countries (Fråne, Stenmarck, Gíslason, Lyng, & Løkke, 2014) and the UK (Jeswani & Azapagic, 2016). To decipher the magnitude of plastics being introduced into the environment and the oceans, we need to understand the lifecycle of plastics through processes such as, production, distribution, and waste management. Because of plastics’ persistence in the environment, we must consider not only last year’s production of plastic, but also all plastic production over time, and its infusion into the environment.
Plastics can be broken down into two categories: fiber and non-fiber plastics. The primary polymers that make up non-fiber plastics are Polyethylene (PE) (36% of global plastic production), Polypropylene (PP) (21%), and Polyvinyl Chloride (PVC) (12%), followed by, in smaller proportions, Polyethylene Terephthalate (PET), Polyurethane (PUR), and Polystyrene (PS) (<10% each). Approximately 70% of all of fiber plastic production can be attributed to Polyester, most of which is PET. These seven groups together amount to 92% of all plastics produced. Approximately
11
42% of all non-fiber plastics have been used for packaging, which is predominantly composed of PE, PP, and PET (Geyer, Jambeck, & Law, 2017). Packaging plastics accounts for 40% of all plastic produced, which is a staggering number and it is continuing to grow (Narancic & O’Connor, 2019).
Plastic production information helps us to understand the generation of plastic waste. Figure 1 shows the plastic used by different industries between 1950 and 2015. The packaging industry used the highest share of plastics and showed the biggest growth in production over time.
Figure 1. Distribution of primary plastic production in different industries. Adapted from (Geyer et al.,
2017)
Figure 2 takes this a step further, showing the amount of plastic waste that has been generated by the same industries. The packaging industry dominates the plastic consumption market and thus the waste generation.
0 50 100 150 200 250 300 350 400 1950 1955 1960 1965 1970 1975 1980 1985 1990 1995 2000 2005 2010 2015 Mi lli on U S To ns
Plastic Production by Industry over Time
Packaging Building and Construction
Transportation Electrical / Electronic Consumer and Institutional Products Other
12
Figure 2. Spread of plastic waste production in different industries. Adapted from (Geyer et al., 2017)
A lifetime can be attributed to plastic packaging like the lifetime assigned to any products which are in use; Figure 3 shows distributions across industries in terms of product lifetimes. Ranging from toothbrushes to soap bottles, the plastics used in packaging have a particularly short lifetime, often less than one year due to the quick consumption period, coupled with the recurring nature of these products. These quick consumption times can be contrasted with plastics used in the construction, automotive or information technology industry, where the consumption period or lifetime can be in the range of years or decades. This dynamic has led plastics produced for packaging in consumer-packaged goods (CPG) to particularly contribute to the proliferation of global plastic waste.
0 50 100 150 200 250 300 350 400 1950 1955 1960 1965 1970 1975 1980 1985 1990 1995 2000 2005 2010 2015
Plastic Waste Generation by Industy
Packaging Building and Construction
Transportation Electrical / Electronic Consumer and Institutional Products Other
13
Figure 3. Probability distribution of product lifetime across industries (Geyer et al., 2017)
Therefore, there is a need to recycle or reuse the plastics in packaging and reduce the production of new plastics globally (Hopewell, Dvorak, & Kosior, 2009). In response to this crisis, many companies have started to evaluate new strategies to reduce plastic packaging waste, such as including more post-consumer plastic in their product packaging, for example, the Alliance to End Plastic Waste formed to start formalizing a solution to this global problem, and a sum of US $1.5 billion has been pledged by the members of this consortium towards fighting the plastic waste problem (“Alliance To End Plastic Waste,” n.d.).
One way to do fight the plastic problem is to improve the take-back of waste packaging in order to reuse it in new packaging. Current recycling systems are broken in the US and there are no effective mechanisms to take back plastic (Katz, 2019). Since China’s ban on taking plastic waste from the US, municipalities are facing an even larger problem as to how to get rid of the plastic waste that is produced in the form of municipal solid waste (MSW). A detailed 2020 study suggests that only a certain percentage of plastics is being recycled depending on the type of plastic, namely PET, high density polyethylene (HDPE) and PP (only 53%). The US doesn’t have adequate capability to recycle other types of plastics (John Hocevar, 2020).
14
Based on this literature review, we can say that most post-consumer plastics in packaging are of types PET and PP, and that we need an efficient mechanism to take them back for recycling. To effectively improve the take-back of post-consumer plastic packaging waste, there is a need to understand and model a closed-loop supply chain.
This thesis considers one mechanism that could contribute to this vision: a reverse flow of plastic packaging waste using existing e-commerce distribution channels. By building a model based on industry data and other predictable and measurable parameters, we were able to test the feasibility, efficiency, and cost-effectiveness of this system.
This thesis is structured into seven chapters, beginning with this introduction. In Chapter 2, we present the problem statement and objectives. Chapter 3 provides an extensive review of literature relevant to the proposed problem setting and methodology. Chapter 4 explains the methodology adopted in detail, including formulation of the network design model, and understanding the systemic cost equation. In Chapter 5, we outline the results from initial data analysis, the optimization model implementation and the cost analysis, and the scenario-based sensitivity analysis based on the results. In Chapter 6, we discuss the results from the scenario-based sensitivity analysis, a qualitative study of stakeholder initiatives, provide recommendations and explain the contributions. Finally, in Chapter 7, we conclude this thesis, discussing the assumptions and touching upon the road ahead.
15
2. Problem Setting and Objectives
The primary goal of this research is to design a model to facilitate an e-commerce-based reverse logistics channel approach to formulate a take-back of post-consumer plastic and thereby assess the feasibility of the same from economic, social and environmental points of view. When we order something online (say an Amazon order), in general, we expect the order to be delivered to our doorstep. In the door delivery process, the delivery van could, instead of leaving empty-handed after dropping the order, pick up post-consumer plastic and place it in a segregated section in the van, effectively initiating a reverse logistics process to a material recovery facility (MRF) directly or intermediary storage. This process can be made possible by any third-party logistics provider.
The objective is to first identify the different parameters in the system, such as, various costs, the volume of post-consumer plastic, and the price of different types of virgin plastic. The object is also to identify various actors of the system. We start by analyzing the volume, value and geographic distribution of the plastic sold by the CPG company. In terms of problem setting, we consider the US plastic sales data and focus primarily on distribution within the New England region, in states: Connecticut, Maine, Massachusetts, Rhode Island, New Hampshire, and Vermont. We study the costs in several tranches of operation. We perform this analysis using the sales data of products by a major CPG corporation as a case study, augmented by geographic locations and distance data of warehouses of prominent e-commerce providers and MRFs utilizing Google Maps API.
Then the objective of this research is to develop a network design model to assess the flow of the plastic take-back from a county to an MRF using a direct path or using a consolidation
16
network, utilizing a warehouse (or distribution center) as a consolidator. Based on this model, we assess the overall cost that the company facilitating this process might incur.
The next objective is to propose a cost equation to assess the feasibility of the optimization model from the economic and environmental points of view. We assess the economic feasibility based on cost equation and determine the profit margin based on the analysis per county for the New England region. Then we assess the feasibility from the environmental point of view, by studying the CO2 emissions as a result of this process and the cost of externalities by estimating the cost using standard carbon tax estimates.
Finally, our objective is to consider the stakeholder ecosystem required for this model to work. We identify the relevant stakeholders in the system and how each of the stakeholders could be incentivized both from economic and social responsibility points of view.
17
3. Literature Review
This chapter aims to provide background information and review the existing literature surrounding this project. This review includes:
(1) Policy directives pertaining to recycled plastic usage: Take-back policies for waste and hazardous materials like electronics differ around the world, and we examine the relevant policies that are in place for items like plastics that could impact the implementation of an e-commerce take back system. We look for examples where recycling is mandated by the governments, attempting to draw parallels for plastic packaging. We assess how similar policies can be designed for the plastic recycling regulations and how companies could implement those models.
(2) The intricacies of customer behavior towards the use of plastic and recycling of plastic packaging in CPGs: We ascertain that the customer is indeed concerned about the plastic pollution. We use this consumer concern to evaluate the likelihood for consumers to participate in the take-back process and assess the need to incentivize the consumer to return the post-use plastic packaging to the retailer or the manufacturer.
(3) Potential uses of post-consumer plastics: We assess the recycling potential of plastic packaging by categorizing the various types of plastics based on their potential recyclability. We understand the potential uses to identify economic opportunities through the reuse, recycle and remanufacturing methods, we discuss in Section 3.3.
(4) Existing reverse logistics mechanisms for products in other industries: We understand how the take-back process through reverse logistics works for products in other industries like the textile and electronics industries. Studying the existing reverse logistics mechanisms used for recycling in recyclable substances would enable us to draw similarities in processes.
18
(5) Uses of the e-commerce reverse logistics channels for take-back: We study the feasibility that e-commerce can be used to take-back plastic. This study of the existing e-commerce reverse logistics channels helps us understand, how the existing flow of post-consumer products or consumer returns can be fused with the post-consumer plastic take-back. We, also, verify that this system has not been tried thus far and this is identified as the gap in the existing literature.
(6) The different types of costs: We focus on the different types of costs involved in the several mechanisms affecting the take-back flow. As a last step, we assess the cost of the operations of the take-back and the purchase cost of virgin and recycled plastics and how this makes the whole process economically feasible. This assessment of different costs helps us formulate the profit margin of the facilitating entity that enables the process recommended in this paper.
3.1 Policies on Plastics
There are several directives in place for several hazardous products spanning different industries. End-of-life electronic products can result in hazardous e-waste, and hence there are numerous directives for take-back of the products by the manufacturers. For the purpose of this thesis, we draw parallels from the policy directives around e-waste take-back and look for similar policy directives or the potential for such directives for plastics in the United States.
3.1.1 EU Directives on Electronic Items Take-Back
The EU has strong laws for the take-back of the end-of-life post-consumer electronic item, and it is the producer’s responsibility to arrange to collect the items. This is known as the Extended Producer Responsibility (EPR), and the boundaries of the same have been debated. These laws have forced the companies to primarily think about four different strategies: (1) forming a take-back network; (2) rethinking product design; (3) setting up a closed-loop supply chain; and (4) adopting new technologies and business models. EU models generally stipulate what producers
19
must spend on the take-back of the products based on the market share of the producer. A good model of this can be found among companies like Hewlett-Packard (HP Inc.), Sony Corporation, Braun GmbH, and Electrolux AB. Apart from the cost incurred by the take-back of end-of-life products from the customer, the costs for recycling are also borne by the producers based on the market share of the producer. A further discussion stems from the context of implementation of EPR. These laws do not encourage product innovation, which in turn reduces the need for recycling. A study has suggested that producers pay for a share of the take-back based on the percentage of their products which require take-back and recycling. This would encourage a long-term focus on product innovation so that the need for the take-back is minimized (Atasu & Van Wassenhove, 2011).
3.1.2 US Directives on Electronic Waste
Federal laws for take-back of electronic waste do not exist in the US; however, 22 out of the 50 states have passed e-waste bills that mandate producer responsibility (Atasu & Van Wassenhove, 2011). Some states in the US have implemented EPR-type regulations. In the US few states that have mandated EPR for batteries, such as New Hampshire’s ban on disposal and incineration of batteries (New Hampshire Code of Administrative Rules, 2017). EPR helps shift the costs from the municipality to the producer, while at the same time enabling value extraction if possible from the end of life.
3.1.3 EU Directive on Plastic
The EU effectively banned single-use plastic (Brussels 2019) in 2019 due to the ubiquitous nature of the single-use plastic and its proliferation by short-term usage which causes pollution. The EU member states have sparingly adopted this directive and are forming implementation and enforcement strategies to combat the single-use plastic.
20
3.1.3.1 The EU directive is a step towards establishing a circular economy where the design and production of plastics and plastic products fully respect reuse, repair and recycling needs and more sustainable materials are developed and promoted. There are highly negative impacts in terms of environmental, health and economic aspects from the use of certain plastics. The environmental impact of toxins can cause health problems both in animals and humans (Verma et al., 2016). Cancer incidents near MSW incinerators are also important factors to consider while planning to mitigate plastic waste by burning (Elliott et al., 1996). Such negative impacts require the setting up of a specific legal infrastructure to effectively mitigate these negative impacts (General Secretariat of the European Parliament and of the Council, 2019).
3.1.3.2 The existence of policies that promote circular mechanisms to facilitate take-back of toxic and hazardous products both directly and indirectly are in effect in the EU. The policy triages effective non-toxic multi-use products, as opposed to single-use products, to reduce waste generation and thereby mitigate pollution through waste. (General Secretariat of the European Parliament and of the Council, 2019)
3.1.4 US Directives on Plastic Usage
No such federal laws exist so far in the US, but there is a strong inclination to ban single-use plastic products like straws and plastic bags. For example, Boston has started the single-use of reusable plastic bags and customers have been charged at least 5 cents for a reusable plastic bag (Phillips, 2018). There are proposed federal policies like “Save Our Seas Act 2.0”, which aims at improving response to marine plastic and also contribute at an international level to control the advent of new plastic into the oceans. At the time of this writing, this act has passed through the final stages of the Senate committee on Commerce, Science and Transportation (Whitehouse, 2019). At the time of writing this paper, another policy, “Break Free From Plastic Pollution Act”
21
has been placed in the Congress, and is yet to be approved. This policy establishes the following guidelines: (1) minimum reuse, recycling, and composting percentages of products, and (2) increasing the content of recycling material in new product manufacturing. This act would also encourage producers to put easy to read labels and also if the product is reusable, recyclable or compostable (Udall, 2020).
3.2 Consumer Response to Plastic Recycling and Take-Back Programs
The consumer is more willing to pay (WTP) towards plastic recycling costs than they are for aluminum, glass and cardboard cartons. The customers’ WTP is assessed through the embedded recycling cost in the product. However, consumers living in “bottle-return states” do not express a higher WTP towards recycling costs. This is because of the expectation of bottle return in the “bottle-return states” makes the inherent higher prices evident in the price for the initial product purchase (Klaiman, Ortega, & Garnache, 2016). Environmentally friendly products can have a positive impact on consumer choices, and green packaging drives consumer behavior sufficiently to attract environmentally responsible customers to purchase greener products (Rokka & Uusitalo, 2008). This customer behavior leads to the following: that consumers would think positively about recycling of plastic and would participate in the take-back of the plastic packaging of CPG products.
3.3 Recycling and the Potential Use of Collecting Post-Consumer Plastic
We discuss the potential use of post-consumer plastic and outlines the benefits of recycling from the circular economy standpoint.
3.3.1 Drivers of Sustainable Plastic Solid Waste Recycling
At the household level the driver of recycling MSW is primarily to reduce the creation of waste that doesn’t decompose (Tonglet, Phillips, & Bates, 2004). At a psychological level,
22
minimizing waste creation is more powerful to adhere to for the consumer than a local government mandated requirement to recycle, and thus programs geared towards exciting monetary opportunities to reduce waste pushes households to recycle more and also create less waste (Tonglet et al., 2004). Consumers usually need to be educated to see the MSW as a resource with an economic value attached to it, however in the US the benefits of recycling have long been promoted.
3.3.2 Economic and Environmental Motivation for Fossil Fuels
As virgin plastic is typically created from fossil fuels, recycled plastic can reduce the manufacture of virgin plastic, thus saving petroleum, natural gas, and other byproducts. Also, environmental protection through reduction of plastic manufacturing triggers consumer sentiments and awareness towards being sensible about plastic use and plastic recycling. Moreover, both consumer and producer responsibility rules and regulations have also been identified as drivers of solid waste management systems from the economic, social and environmental aspects (Mwanza & Mbohwa, 2017). As an economic driver the take-back plastic can be recycled and reused in remanufacturing processes, reducing raw material costs in the process. On the environmental side, regulation on plastic waste collection involves large-scale social endeavor directed towards an environmental cause, as societies come together to facilitate recycling and be an active participant in the process. Similarly, as an environmental driver, the regulations protect the environment (and society) from the toxins released by plastic waste when landfilled or incinerated.
3.3.3 Future Use of Post-Consumer Plastic
A theoretical study suggests that any product take-back can have multiple benefits for the manufacturers, such as (1) a source of inexpensive components and materials; and (2) avoidance of disposal and incineration costs to be incurred by the producer based on EPR policies discussed
23
in Section 3.1.2; and (3) a buy-back opportunity for manufacturers to sell new products, such as polyester-based clothing material that is very popular for athletics and other sports. New products could also entail substituting recycled plastic in products originally made from virgin plastics. Thus, the study bolsters our assumption that there will be a monetary value associated with product recovery by the producer. (Thierry, Salomon, van Nunen, & van Wassenhove, 1995)
3.4 Use of Reverse Logistics in Take-Back for Recycling
After the discussion on plastic take-back and its benefits in prior sections, we now study where reverse logistics has been used for returns and take-back of products. We look at textile and battery back as examples to draw parallels and similarities to our model of the plastic take-back.
3.4.1 Similarities of Post-Consumer Plastic Take-Back for Recycling with Textile Take-Back
Processes that are like those in a proposal to use reverse logistics of textile (Bukhari, Carrasco-Gallego, & Ponce-Cueto, 2018) can be understood, and expanded, for plastics. The way each type of plastic is collected from the end consumer determines how complex the system might be designed. Expanding upon a general consolidation-based network design, we can understand how e-commerce (and other reverse logistics channels) can be used to take back the plastic to a sorting location. Furthermore, the use of upcoming artificial intelligence (AI) based computer vision technologies like AutoSort, which uses robotics to sort between visibly different substances (Hahladakis & Iacovidou, 2018). This can be used to sort different types of plastics, for example, this technology can be used to segregate bottles (PET) and caps (PP). This process further helps the recycling processes, as the process to recycle PET is different from PP.
24
Process similarities of post-consumer plastic take-back for recycling with battery take-back is studied in this paper. This research uses a mixed-integer linear programming (MILP) based network design model from the consumer location to a sorting center and then to a recycling plant can be assessed as one of the potential mechanisms for post-consumer plastic take-back. This can be understood as a mechanism that drives e-commerce-based reverse logistics, where a return is picked up from an end-consumer, consolidated at a warehouse or a distribution center and then sent to the manufacturer (Ponce-Cueto & González-Manteca, 2012). We can leverage a similar model while designing the take-back of post-consumer plastic for recycling.
3.5 Use of E-Commerce in the Take-Back Process
In this section, we study e-commerce, primarily from the reverse logistics standpoint. We understand customer returns and the process of e-commerce take-back to facilitate returns. There are several models, such as a consumer-based return aggregator (e.g., Amazon Hub Locker), direct pickup (e.g., UPS pick-up) from consumer locations, and consumers sending the product back through common logistics providers (e.g., FedEx, UPS, US Mail and others).
3.5.1 E-Commerce Returns
E-commerce reverse logistics channels has been used to facilitate the customer returns process primarily. However, it has also been used to support the following: (1) competitive advantage – efficient handling of returns of the products in the e-retail space can generate large cost savings; (2) product reuse – effective use of reverse logistics for the return of the product facilitates reuse. This enables value extraction from the product, by direct reuse or by generating value by disintegrating the parts when the returned product is put through the remanufacturing process; and, (3) environmental impact – adhering to the EPR in the EU to reduce the volume of waste (Kokkinaki, Dekker, de Koster, Pappis, & Verbeke, 2002).
25 3.5.2 Process of the E-Commerce Take-Back
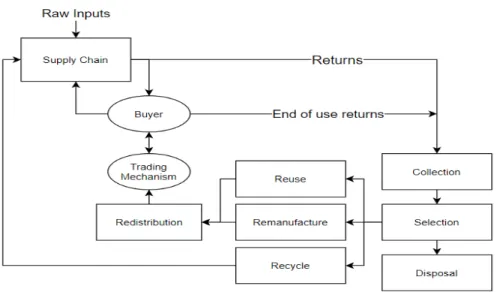
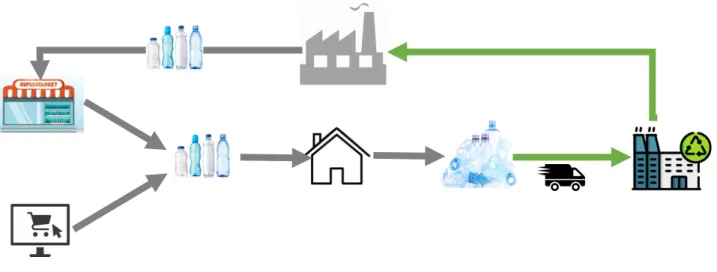
To understand the e-commerce-based take-back process it is important to understand the material flow of the product in such a system, as Figure 4 shows.
Figure 4. Classic reverse logistics flow adapted from (Kokkinaki, Dekker, De Koster, Pappis, & Verbeke, 2002) The supply chain of the product flow is important to understand to understand the reverse flow of the products. The forward flow starts after initial product manufacturing. The product flows from the factory to warehouses or distribution centers, where it is stored to be further shipped to stores or directly to customers (in case of e-commerce). Finally, the product reaches the customer through retail or e-commerce channels. The reverse logistics process starts when the customer initiates a return on a used or unused product. The product is either picked up from the customer location or the customer drops the product off at a drop-off location. The product is then carried to a consolidation center, usually a warehouse or a distribution center. The product undergoes inspection through a sorting and selection process. Then, after sorting and selection, it is determined which of the returned products will be reused, recycled or remanufactured, or which products will be disposed of. Based on this decision the products move to redistribution after the
26
completion of the aforementioned processes (Kokkinaki et al., 2002) (Govindan, Palaniappan, Zhu, & Kannan, 2012).
3.6 Aspects of Cost in the Take-Back Mechanisms
Finally, in this section of the literature review, we study the costs of operations. The costs of operations signify the various component costs to enable a take-back process using reverse logistics channels. We also understand the various other costs in terms of recycling processes, and operational costs in the MRFs.
3.6.1 Cost of Reverse Logistics Modes to Decide Optimal Take-Back Channels
To utilize the reverse logistics channels to facilitate take-back it is important to understand the cost in each of the reverse collection channels. Every step of the supply chain incurs cost. Focusing primarily on the reverse logistics supply chain the costs can be summarized as pickup cost, transportation cost (primary leg, middle-mile and last-mile), sorting and handling costs at the warehouse, storage cost, and other miscellaneous costs such as IT, human resources, etc. The optimal reverse logistics route is typically selected based on the minimum total cost incurred in that route as compared with the total cost incurred in all other routes. Studies show that, in the case of products manufactured by Apple Inc., HP Inc., and The Eastman Kodak Company, the choice of the optimal reverse logistics channel strongly depends on the cost of the channel, type of the product, and the volume of units sold. Because of the economy of scale, the take-back through the retailer is more cost-effective; however, in the case of fragmented dissemination of products and brands, a manufacturer take-back is more cost-effective (Atasu, Toktay, & Van Wassenhove, 2013). Even though we can pull similarities from this outcome we cannot comment on whether
27
the same pattern will be applicable in case of the plastic product take-back; more research is needed to better understand this dynamic for plastic (Klausner & Hendrickson, 2000).
3.6.2 Cost of Recycling
There has been limited research regarding the cost of recycling processes in the US. The cost of recycling is dependent on several variables, such as collection techniques, frequency of collection, equipment used, and the type of material that is collected for recycling (Hegberg, Hallenbeck, & Brenniman, 1993). This study also showed approximate costs of collection of different types of plastic per household per year and the breakdown of the recycling rates. However, this research is dated, from 1993, and thus, the cost figures mentioned in the study would not be relevant in the current scenario and the cost of recycling would be needed to be considered from recycling plants’ current price quotations.
3.7 Conclusion of Literature Review
In the literature review, we found that there are no federal policies for plastics in the US, however, the general household is more attuned to this global problem and shows more empathy towards plastic recycling and willing to pay more for plastic packaging in lieu of recycling costs. We studied the potential of the plastic take-back and we discovered several opportunities that post-consumer plastic can uncover. We found that take-back policies for different products have worked out well in the past using reverse logistics channels. We also, found that studies have been conducted to understand several implications of product take-back, some stipulated by laws, others to generate value from the post-consumer product. In the case of plastic, post-consumer plastic can be a viable option for value generation for companies that facilitate the take-back process.
28
The literature review presented in this section shows that the literature and research on using e-commerce models for plastic take-back is scarce. The gap in the literature is that the assessment of using e-commerce channels for the take-back of post-consumer plastics generated from CPG products has not been done. This gap has been identified in the literature review done in this research. This research, thus, aims to shed light on the feasibility of such a model using the e-commerce based reverse logistics channels.
29
4. Methodology
In the literature review we identified the gap in the literature regarding the use of e-commerce channels to facilitate the take-back of plastic from consumer locations back to MRFs. We also studied how a reverse logistics network has been used to facilitate the take-back of similar waste generating products.
In this section we define the methodology and the steps we took in conducting this research. This section can be broken down into seven actions: (1) Data collection; (2) Data preparation; (3) Initial data analysis (4) Problem formulation using a network design approach; (5) Cost analysis (6) Scenario based sensitivity analysis, and (7) Recommendations.
4.1 Data Collection
In this step we collected data from several sources regarding the following 10 topics:
(1) CPG product sales information – This gave us the total plastic waste generation by the CPG company in a year through the number of products sold via and the weight of each plastic type in tons;
(2) CPG product market share information – This product-specific market share information helps us to estimate the overall US market for that product, making it useful for calculating the total weight of plastic generated by the overall CPG industry by plastic type in tons;
Data Collection Data Cleaning & Prep-aration Initial Data Analysis Problem Form-ulation & Network Design Cost Analysis Scenario based Feasibility Analysis Recom-mend Strategy
30
(3) Census information regarding population ratio per county – This data point allows us to estimate the population ratio of every county on the US; and based on this information it will be easy to estimate the consumption per county. [Data source: Census.gov];
(4) Census information regarding per-capita income per county – This data point allows us to skew the plastic consumption information further to understand the actual consumption per county more closely. This data point is applied over the population ratio metric to come up with the final plastic waste numbers for every county. [Data source: Census.gov];
(5) County centroid points – County centroid points are latitude-longitude (Lat-Long) values that generate a central point in the county based on data provided by Google Maps API. This data is used to estimate the transportation miles for the local distances within the county. Data source: Google Maps;
(6) MRF locations across the US – This data gives us the Lat-Long values for all the MRFs which were further used to calculate the linehaul distances. [Data source: (“Residential MRFs - The Recycling Partnership”)];
(7) Amazon warehouse locations across the US – This data point also, helps us to calculate linehaul distances between county centroids and MRFs. We have used Amazon as a case study here due to the number of warehouses in the US and because Amazon is among the most prominent e-commerce actors in the US. [Data source: (“Locations of Amazon Fulfillment Centers in USA - Forest Shipping,” n.d.) ];
(8) Operational cost information – Operational cost information takes into consideration different costs that incur in different tranches of the operations. This cost information can be broken down into several other data points such as (a) Cost of Transportation (US $/mile), (b) Cost of Storage
31
(US $/lbs.), (c) Cost per Stop (US $), (d) Cost of Recycling (US $/ton), (e) Cost of Emissions (US $/ton-CO2). All these costs are relevant to understand the different scenarios and overall benefit of using the take-back process for post-consumer plastic;
(9) Vehicle information – This data point specifically points towards understanding the various types of vehicles, for example small e-commerce delivery vans with a capacity of 3,500 lbs. and long-haul trucks with a capacity of 720,000 lbs.; and,
(10) Emission information – In this data point we estimate the total grams of greenhouse gases, using the standard unit of CO2-equivalents (CO2e),generated by different types of vehicles using the accounting methodology and average industry data for US specified within Global Logistics Emissions Council Framework. In our research we primarily focus on small vans (vehicle Type 1) and large trucks (vehicle Type 2) and consider both the weight of plastics transported and the distance traveled.
This step enables us to move to the Data Cleaning and Preparation phase, which will make the data ready for analysis.
4.2 Data Cleaning and Preparation
After data collection, we prepared the data by performing the following steps:
(1) Data cleaning – We eliminated missing data from the collected datasets, nameless from the sales information and census information;
(2) Unit normalization – We performed unit normalization across our entire datasets to curtail disparities between data collected through different channels. For example, we changed all the weight values to US tons and smaller units to pounds similarly, we changed all the distances to miles. Furthermore, we normalized all the dependent variables that depend on the weight and
32
distance values. For example, we changed the Cost of storage from $ per kg to $ per pound and the Cost of Transportation from $ per km to $ per mile;
(3) Calculating overall US sales of CPG products – As discussed in Section 4.1 (Data Collection) we calculated the overall US sales of the products sold by the CPG company by dividing the CPG Company sales with their market share. This number gives us the total weight of plastic in the products sold by the entire CPG industry. This also enables us to cluster the weight as derived from sales based on plastic type to get the tonnage generated by specific plastic classes;
(4) Normalization on Sales Data – As discussed in the Section 4.1 we performed a normalization operation on the overall US CPG sales data by plastic class by multiplying the tonnage with population ratio and the income skew. The income skew was calculated by taking a weighted average of county-specific per-capita income over the per-capita income of all of US;
(5) Preparing Distance Data – From the Lat-Long values collected for county centroids, Amazon warehouses, and MRFs as discussed in Section 4.1 we calculated the actual distances by using the Distance Matrix API provided in the Google Maps API suite. We wrote software code to invoke the API iteratively to get a Cartesian product of distances against all the Lat-Long values, as discussed in Section 4.1;
(6) Preparing Emissions Data – we parameterized the emissions data based on the values from the data collected for two vehicle types mentioned in Section 4.1.
Upon completion of the data cleaning and preparation we could move to the initial data analysis phase.
33 4.3 Initial Data Analysis
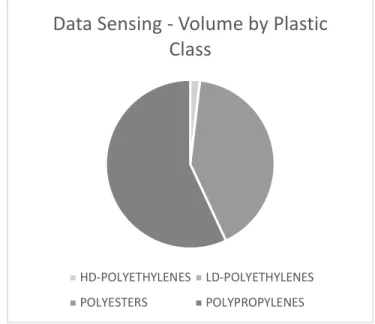
After the completion of data cleaning and preparation we performed an initial data analysis, including data sensing, to understand the different clusters in which the data is spread out. For example, we found the spread of the plastics collected over different plastic classes as shown in Figure 5.
Figure 5. Volume of plastic sold by CPG companies in all of US by plastic classes
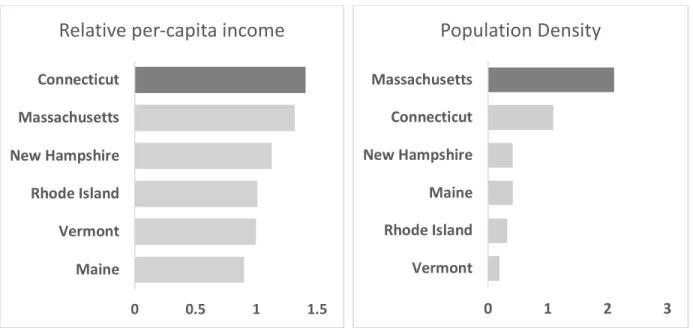
Similarly, we tried to understand the relative per-capita income and population ratio for all the states in the New England region, as shown in Figures 6 and 7.
Data Sensing - Volume by Plastic
Class
HD-POLYETHYLENES LD-POLYETHYLENES POLYESTERS POLYPROPYLENES
34
Figure 6. Per capita income for New England states relative to per capita income in the US
Figure 7. Population ratio of New England states relative to US population
We understand how the plastic weight is spread across different states in the New England area as shown in Figure 8 and investigate the plastic data through a further breakdown analysis by plastic classes as shown in Figure 9.
Figure 8. Total plastics sold through CPG products in New England states
Figure 9 Plastic sold by plastic classes in New England states 0 0.5 1 1.5 Maine Vermont Rhode Island New Hampshire Massachusetts Connecticut
Relative per-capita income
0 1 2 3 Vermont Rhode Island Maine New Hampshire Connecticut Massachusetts
Population Density
0 10000 20000 Vermont Rhode Island Maine New Hampshire Connecticut MassachusettsTotal plastics sold by tons
0 5000 10000 15000 Vermont Rhode Island Maine New Hampshire Connecticut Massachusetts
Plastic classes by weight sold
35
We also plot all the physical locations of county centroids, Amazon warehouses and MRFs on the US map based on their Lat-Long values as discussed in Sections 4.1.5, 4.16 and 4.1.7.
After the initial data we formulate our model using the network design approach, as described in Section 4.4.
4.4 Problem Formulation Using A Network Design Approach
After completing the initial data analysis, we used what we learned to formulate our model using a network design approach.
36
In this formulation we designed a network design optimization model using a mixed-integer linear programming approach to minimize the logistics cost. The logistics cost is a combination of the cost of transportation (Section 4.1.8a) and the cost per stop that the third-party provider incurs (Section 4.1.8c) while operating this model. This cost is largely defined by the transportation costs, which includes local delivery rounds, where the pickup vehicle makes a number of stops, and line-haul transport, where consolidated packages make a longer trip from the county centroids to the warehouse (Leg 1), directly from county centroids to the MRFs (direct) and warehouse to the MRF (leg 2).
This model considers
c
ij, the logistics cost calculated based on Clogistics in (7), which feeds into the optimization model formulation in (1). xij demonstrates the quantity of plastic collected,and
z
is the binary parameter which determines if the model should choose a direct path from the source (County) to the destination (MRFs) or it should choose a consolidation route through a warehouse of a third-party logistics provider or an e-commerce provider. The constraints are delineated from (2) through (6). The constraint in (2) is a binary parameter that decides whether a direct route is chosen, or a consolidation route is chosen. Constraint (3) describes the origin volume constraint, which can be explained as the volume that is considered from an origin point (county) cannot more than the post-consumer plastic generated at that point. Furthermore, (4) explains the capacity constraints on the intermediary point and the termination points of the route. Equation (5), explains the transshipment constraint which entails the number of pounds coming into a transshipment facility, leaves the facility in its entirety. Constraint (6) is a non-negativity constraint on the amount of material in flow from the source to the destination.37
"#$(&) = ) ) *+
!",
!"+
# "$% & !$%) )(1 − *)+
!',
!'+ ) )(1 − *)+
'",
'"# "$% ( '$%
( '$% & !$%
… (1)
Subject to:
* = 2
0, +
1, +
!'+ +
'"< +
!" !'+ +
'"≥ +
!", ∀ 8 ∈ $
), : ∈ $
*, ; ∈ $
+… (2)
) ,
!" - ).((/0# , ∀ ! ∈ 4% !… (3)
) ,
!" - 567(78!90& , ∀ " ∈ {4' ,4(} , <= 5=% "… (4)
) ,
!'=
!) ,
'""
, ∀ 8 ∈ $
), : ∈ $
*, ; ∈ $
+… (5)
,
!"≥ 0 … (6)
A
/>?!@9!8@= A
@BC +
D
EF
#7A+
1
2
G + A
BB2 B
D
EF
#7A+
1
2
G H
/!&CD7./+
C:
+)E√J
G … (7)
where,
J = HPCQ8RS =
FC#7&B GHC7=
F IH)… (8)
"= capacity of the vehicle
This model presents the opportunity to several sensitivity parameters to evaluate different scenarios in terms of operations cost and overall profit of each scenario. These sensitivity scenarios help us to dynamically assess several factors. For example, a region can be categorized as rural and urban habitation based on the population ratio in terms of number of households per square
38
mile. Similarly, other parameters aid the understanding of different scenarios based on geographic, social and economic likelihoods.
Sensitivity Parameters
n = number of households (collection points) Qmax = Capacity of the transportation vehicle r = radius of the area considered
D = Demand (based on company sales data, population ratio, and per-capita income of the county)
" = % capacity of the vehicle used
This formulation enables us to perform the optimization to understand, based on the location of the warehouses and MRFs, which leg of transport is the most cost effective. After the formulation of this model we to perform cost analysis for the company enabling the process of take-back.
4.5 Cost Analysis
After devising the model using a network design approach and coming up with the transportation routes, we now calculate the profit margin for the company facilitating this take-back process. In this we take the perspective of the CPG company and assume that the CPG company is facilitating this take-back process. However, this analysis will hold good for any entity that facilitates this take-back process, such as a logistics service provider or recycling company who will plan to sell the recycled plastic to plastic manufacturers.
To perform this cost analysis, we consider the following flow of actual post-consumer plastic from the consumer to the CPG company through various processes.
39
To perform the cost analysis, we have come up with a generic equation. The equation below represents a mathematical formulation, which takes into consideration the purchase price of virgin and recycled plastic. The formulation suggests a parameter a that varies between 0 and 1 and determines the component structure of the products of the CPG company. It estimates the price that the CPG company will not have to pay if they undertake this process of facilitating the take-back of plastics and thereby facilitating recycling, and then collects and uses the recycled plastic pellets to manufacture future plastic packaging.
In this equation, we also consider a total cost, which is composed of the following costs, as covered in Sections 4.1.8 and 4.4: (1) Recycling cost, (2) Logistics Cost, (3) Cost of Storage, (4) Cost of Sorting (usually included in the recycling cost), and (5) Parameterized cost of incentives.
!"
!"#$"%+ (1 − !)"
#&'(')&*− ()*+, .)/* = 1+2345 − 67(.
&%!)
40 where
,
0 < U < 1,
()*+, .)/* = .
#&'+ .
)+$",-"',+ .
,-+#.$&+ .
,+#-"%$+ .
"%'&%-"!&,where,
P
virgin = Purchase Price of virgin plasticC
env= Estimated environmental cost
P
recycled = Price of Recycled PlasticC
rec= Recycling cost
C
logistics= Total Logistics Cost
C
sorting= Sorting Cost
C
incentives = Incentives CostsC
storage = Storage CostAfter conducting the cost analysis and applying the formula to the modeled data, we then conduct a scenario-based sensitivity analysis.
4.6 Scenario-Based Sensitivity Analysis
After completing the cost analysis, we perform the sensitivity analysis based on different sensitivity parameters, as mentioned in Section 4.4. In this sensitivity analysis we change the different parameters to understand the impact on the profit margin of the entity facilitating the take-back process. For this research we do the sensitivity analysis from the perspective of the CPG company that is facilitating the process.
41
To conduct the sensitivity analysis, we use the results from the cost analysis for all the counties in the New England states, and plot them in four different graphs showing each of the following relationships: (1) margin across all the counties; (2) different types of costs across all the counties; (3) specifically logistics cost across the counties; and (4) emission cost vs. margin across all the counties.
Based on this analysis we can understand which scenarios work well from an economic perspective and how the choice of distance and vehicle affect the greenhouse gases emitted from the transportation required by this process. The effect of emissions is further analyzed based on the cost to the company using a carbon price ($ per ton-CO2). The results from the sensitivity analysis is detailed in Section 5.4.
In our analysis, however, we do not subtract the emissions cost from the margin. We show it separately as this can be further acted upon using various other measures, such as carbon offsets and the cost of investment in an electric fleet.
After conducting the sensitivity analysis, we are poised to make recommendations to the company facilitating this take-back process.
4.7 Recommendations
After performing the sensitivity analysis, we make recommendations to the entity sponsoring this take-back process based on what parameters to choose to maximize economic benefit while minimizing emissions and ensuring greater plastic collection. The plastic collection, however, is dependent on customer responsibility, which can be further assessed using “pay or punish” model. A deeper understanding of incentives can help in assessing if there is a relationship between collection percentage and stakeholder incentives.
42
We used this methodology (Section 4) to conduct our studies and calculations and reached the results discussed in the next section.
43
5. Results
After discussing the methodology for this research, we now discuss the results that were obtained by conducting the analysis on the data collected. These results and sensitivity analysis present the outcome of running the optimization-based network design model and the cost analysis defined in the chapter 4, Methodology.
These results are broken down into initial data clustering based on product types and contents, and geographic distribution of locations in terms of counties, Amazon warehouses, and material recovery facilities (MRFs). The results also demonstrate optimized route distances, the cost structures and the profit margin as described in the Methodology section.
5.1 Initial Data Analysis
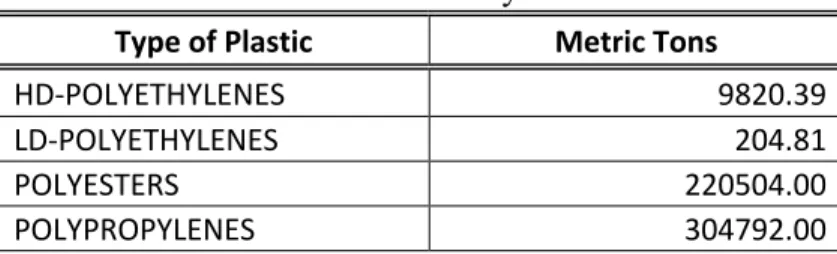
Upon executing the methodology as mentioned in Chapter 4, we find several interesting insights from the initial data analysis as described in Section 4.3. We first found the weights of different types of plastics as described in Table 5.1.1.
Table 5.1.1 Overall weight of plastics by annual sales in CPG Industry
Type of Plastic Metric Tons
HD-POLYETHYLENES 9820.39
LD-POLYETHYLENES 204.81
POLYESTERS 220504.00
POLYPROPYLENES 304792.00
We see that polyesters (the majority of which is PET) and polypropylenes dominate the post-consumer plastic space.
44
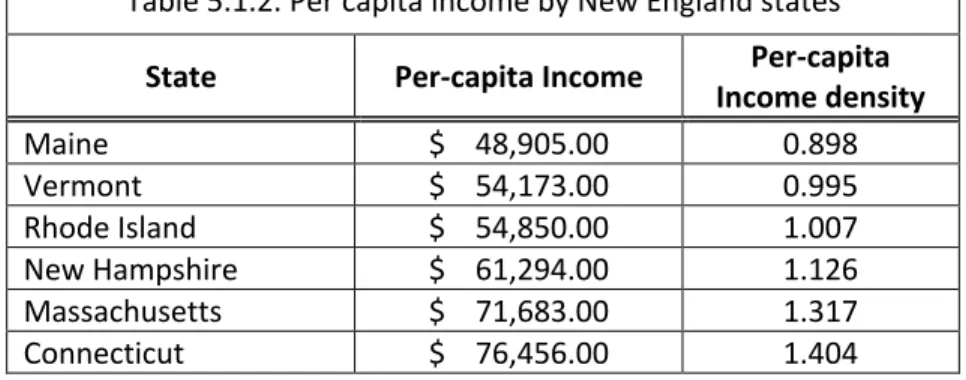
Next, we understand the relative per capita income among the New England states and see that Connecticut has the highest relative per-capita income, followed by Massachusetts, and then by New Hampshire, Rhode Island, Vermont and Maine. Table 5.1.2 demonstrates this.
Table 5.1.2. Per capita income by New England states
State Per-capita Income Income density Per-capita
Maine $ 48,905.00 0.898 Vermont $ 54,173.00 0.995 Rhode Island $ 54,850.00 1.007 New Hampshire $ 61,294.00 1.126 Massachusetts $ 71,683.00 1.317 Connecticut $ 76,456.00 1.404
Similarly, we see that the population ratio of Massachusetts is the highest followed by Connecticut and then by New Hampshire, Maine, Rhode Island and Vermont. This is demonstrated in Table 5.1.3
Table 5.1.3. Population ratio of New England states
State Population ratio
Vermont 0.19 Rhode Island 0.32 Maine 0.41 New Hampshire 0.41 Connecticut 1.09 Massachusetts 2.11
After finding the population ratio and the relative per-capita income density, we can then calculate the normalizing parameter which, when multiplied with the sales values, can give a near estimate of the weight of products sold in specific counties. A snapshot of the data is provided in Table 5.1.4, where we show the state, the counties, and the normalized weights of the plastics of different types. The full table can be seen in Appendix A.
45
Table 5.1.4 Detailed distribution of plastic sold by plastic type by county in New England (in Metric Tons)
States and Counties Total Plastic PET PP HDPE LDPE
Connecticut 10519.91 4333.25 5989.65 192.99 4.025
Fairfield County 4384.79 1806.13 2496.54 80.44 1.68
Hartford County 2229.71 918.44 1269.51 40.90 0.85
Litchfield County 453.05 186.62 257.95 8.31 0.17
Middlesex County 430.22 177.21 244.95 7.89 0.16
New Haven County 1871.09 770.72 1065.33 34.32 0.72
New London County 608.89 250.81 346.68 11.17 0.23
Tolland County 329.07 135.55 187.36 6.04 0.13 Windham County 213.02 87.75 121.29 3.91 0.08 Maine 2520.87 1038.37 1435.29 46.25 0.96 Androscoggin County 172.21 70.93 98.05 3.16 0.066 Aroostook County 106.58 43.90 60.68 1.96 0.04 Cumberland County 706.90 291.18 402.48 12.97 0.27 Franklin County 44.39 18.28 25.27 0.81 0.02 Hancock County 108.18 44.56 61.60 1.98 0.04
After data preparation we run the network optimization model, and the results of which are mentioned in the next section.
5.2 Optimized Routes and Corresponding Distances
After the initial data analysis and data preparation we ran the optimization to get the routes from every county to the MRF. This process was executed in detail as described in Section 4.4.
To run the model, we assumed that the facilities in the model, e.g., the Amazon warehouses and the MRFs, have infinite capacity. Thus, the facilities selected by the model to form a route were primarily chosen based on the minimum distance as the transportation cost and the cost to stop (as described in Section 4.1.8) were negligible for the local distances within the service radius in the county.
Furthermore, we saw that all the distances selected are direct distances (shortest feasible distance) due to the distance minimization (as described in Section 4.1.8). To normalize this, we
46
break down the consolidation distance in Leg 1 and Leg 2 and capture the consolidation route if the Leg 2 distance is less than the direct distance. This logic signifies that if the CPG company were to employ a 3PL provider, it will only do so if the Leg 2 distance is shorter than the direct distance. In this case the transportation cost incurred in the Leg 1 distance is an additional cost the CPG company is willing to incur due to the benefits of consolidation, which results in overall cost reduction.
In Table 5.2.1 we show the selected distances for the counties, some of which are direct and the remaining are through a consolidation network. The Table 5.2.1 shows county IDs, MRF IDs, and Amazon Warehouse IDs, which are identifiers to represent a county, an MRF and an Amazon warehouse, respectively, and this has been utilized for easy of multi-functional data analysis. The full description of these Ids, can be found in Appendices B, C and D. Table 5.2.1 shows a snapshot of the data. The entire table can be seen in Appendix F.
Table 5.2.1 Distances in Miles between County and MRF (on left) and Distances between County and MRF Through Amazon Warehouse (right)
CTY_ID MRF_ID Miles
Final for Cost Total Distance (including
Leg 1) CTY_ID AMZ_ID MRF_ID Miles
CTY_CT_1 MRF_CT_4 12.14 12.14 12.14 CTY_CT_1 AMZ_4 MRF_CT_3 59.21
CTY_CT_2 MRF_CT_8 14.63 13.19 25.04 CTY_CT_2 AMZ_5 MRF_CT_7 25.04
CTY_CT_3 MRF_CT_4 34.15 13.91 57.59 CTY_CT_3 AMZ_3 MRF_CT_5 57.59
CTY_CT_4 MRF_CT_5 24.15 13.91 35.21 CTY_CT_4 AMZ_3 MRF_CT_5 35.21
CTY_CT_5 MRF_CT_3 22.08 21.26 30.95 CTY_CT_5 AMZ_4 MRF_CT_3 30.95
CTY_CT_6 MRF_CT_6 20.02 13.19 64.56 CTY_CT_6 AMZ_5 MRF_CT_7 64.56
CTY_CT_7 MRF_CT_6 12.45 12.45 12.45 CTY_CT_7 AMZ_5 MRF_CT_7 37.09
CTY_CT_8 MRF_CT_6 16.26 13.19 58.65 CTY_CT_8 AMZ_5 MRF_CT_7 58.65
CTY_MA_1 MRF_MA_1 33.35 27.58 90.65 CTY_MA_1 AMZ_2 MRF_MA_2 90.65
47
This table clearly shows the route choices made and the final distances to be used in the total systemic cost calculation, results of which we discuss in Section 5.3.
5.3 Margin and Cost Analysis based on Demand
After finding the optimal distances from every county to the closest MRF, we further calculated the different components of the cost: the transportation cost, the stop cost, the overall logistics cost, recycling cost, and the incentive cost (with the value of incentives as zero dollars to begin with). We also calculate the price based on the weight of the post-consumer plastic for every plastic class. This is important to understand what the CPG company would have spent to manufacture the product packaging using virgin plastic. This finally brings us to calculating the profit margin, which is calculated by subtracting the different costs from the price of the virgin plastic.
48
Table 5.3.1 shows a snapshot of the whole calculation that was performed. The full table can be found in Appendix E.
This analysis shows the different costs and the margins for each individual county based on the calculated price of virgin plastic and the summation of all the costs included here. Furthermore, we also estimate the emissions based on the number of trips and weight carried per trip and through different vehicle type. We then calculate the emissions cost based on global average price of mandated carbon taxes (The World Bank, 2020). We now perform a sensitivity analysis to understand the aggregated behavior of this system.