Publisher’s version / Version de l'éditeur:
Vous avez des questions? Nous pouvons vous aider. Pour communiquer directement avec un auteur, consultez la première page de la revue dans laquelle son article a été publié afin de trouver ses coordonnées. Si vous n’arrivez pas à les repérer, communiquez avec nous à [email protected].
Questions? Contact the NRC Publications Archive team at
[email protected]. If you wish to email the authors directly, please see the first page of the publication for their contact information.
https://publications-cnrc.canada.ca/fra/droits
L’accès à ce site Web et l’utilisation de son contenu sont assujettis aux conditions présentées dans le site LISEZ CES CONDITIONS ATTENTIVEMENT AVANT D’UTILISER CE SITE WEB.
Physical Review. B, Condensed Matter and Materials Physics, 78, 23, 2008
READ THESE TERMS AND CONDITIONS CAREFULLY BEFORE USING THIS WEBSITE. https://nrc-publications.canada.ca/eng/copyright
NRC Publications Archive Record / Notice des Archives des publications du CNRC :
https://nrc-publications.canada.ca/eng/view/object/?id=118d2cfd-7857-4278-b9f1-e904804bad07
https://publications-cnrc.canada.ca/fra/voir/objet/?id=118d2cfd-7857-4278-b9f1-e904804bad07
NRC Publications Archive
Archives des publications du CNRC
This publication could be one of several versions: author’s original, accepted manuscript or the publisher’s version. / La version de cette publication peut être l’une des suivantes : la version prépublication de l’auteur, la version acceptée du manuscrit ou la version de l’éditeur.
For the publisher’s version, please access the DOI link below./ Pour consulter la version de l’éditeur, utilisez le lien DOI ci-dessous.
https://doi.org/10.1103/PhysRevB.78.235313
Access and use of this website and the material on it are subject to the Terms and Conditions set forth at
Single-exciton energy shell structure in InAs/GaAs quantum dots
Awirothananon, S.; Raymond, S.; Studenikin, S.; Vachon, M.; Render, W.;
Sachrajda, A.; Wu, X.; Babinski, A.; Potemski, M.; Fafard, S.; Cheng, S.J.;
Korkusinski, M.; Hawrylak, P.
Single-exciton energy shell structure in InAs/GaAs quantum dots
S. Awirothananon,1 S. Raymond,2S. Studenikin,2M. Vachon,1,2W. Render,2A. Sachrajda,2 X. Wu,2A. Babinski,3
M. Potemski,4S. Fafard,1S. J. Cheng,5M. Korkusinski,2 and P. Hawrylak2
1Department of Physics, University of Ottawa, Ottawa, Ontario, Canada K1N 6N5
2Institute for Microstructural Sciences, National Research Council of Canada, Ottawa, Ontario, Canada K1A 0R6 3Institute of Experimental Physics, Warsaw University, Hoza 69, 00-681 Warsaw, Poland
4Grenoble High Magnetic Field Laboratory, CNRS, BP 166, 38042 Grenoble Cedex 9, France 5Department of Electrophysics, National Chiao Tung University, Hsinchu, 30050 Taiwan, Republic of China
共Received 31 July 2008; published 22 December 2008兲
The energy shell structure of a single exciton confined in a self-assembled quantum dot共QD兲, including excited states, is studied in a regime where the direct Coulomb attraction energy is comparable to the kinetic energy of the carriers. This is achieved via magnetophotoluminescence excitation spectroscopy experiments, where a magnetic field applied perpendicular to the plane of the QD is used to reveal the angular-momentum content of energy shells. The absorption spectrum of the QDs is modeled, and comparison with experiment allows us to relate the observed transitions to interband QD bound-state transitions. The blueshift of the absorption peaks compared to the emission peaks is then interpreted in terms of many-body interactions, and we show that for a highly symmetric situation, the observed energy difference gives a direct measurement of the extra exchange energy gained upon addition of an extra exciton in the QD.
DOI:10.1103/PhysRevB.78.235313 PACS number共s兲: 78.55.Cr, 78.67.Hc, 73.21.La, 75.75.⫹a
I. INTRODUCTION
Quantum dot 共QD兲 systems have established themselves as prime candidates for implementing many applications. For some applications, such as lasers,1superluminescent diodes,2
and semiconductor optical amplifiers,3 the device operation
is likely to make direct use of the QD excited states. For other applications, such as single-photon source,4 optical
quantum gate,5and spin memory,6 the QD contains at most
two excitons at a time and only the ground state 共GS兲 is directly involved. However, it has been shown that the pres-ence of excited states, through configuration mixing, will influence the energy shell structure of all bound states, in-cluding the ground state.7Simply put, maximizing the
appli-cation potential of QD systems requires understanding and modeling their energy shell structure, including the excited states, as precisely as possible.
Magnetoluminescence experiments are a technique of choice to probe QD excited-state energy shell structure, where applying an external magnetic field reveals the rel-evant energy shell structure by progressively lifting degen-eracies and shifting the transitions associated with different angular-momentum channels as the field is increased. For example, in a series of recent experiments, it was shown that the energy shell structure of an interacting ensemble of car-riers confined in QDs is that of Fock-Darwin 共FD兲 states.8
This was demonstrated for electron droplets using transport and resonant tunneling spectroscopy,9,10 electron-hole 共e-h兲
droplets 共or excitonic droplets兲 using optical spectroscopy, and more precisely magnetophotoluminescence 共MPL兲.11–13
In the latter case, the relevant quasiparticle is a charge-neutral exciton, or more precisely a QD exciton. Adding many such QD excitons in a QD creates an excitonic droplet, i.e., an ensemble of interacting electron-hole pairs confined in a particular QD. Due to fast relaxation of the droplet into its ground state共GS兲 configuration,14one must fill the
lower-energy shells before the excited-state emission can be ob-served. As a result, many relevant carrier-carrier interactions
must be included to describe the system, such as Coulomb repulsion, Coulomb attraction, and exchange and correla-tions. This is a rather complex problem, and it is therefore desirable to perform experiments which probe the single-exciton energy shell structure of the QD bound states. Such data could be used as a stepping stone to validate theoretical models, and also the information thus gained would be di-rectly relevant to certain applications.
This can be achieved via absorption experiments where resonant optical excitation creates excitons one by one in an excited state of an empty QD. However, in view of the small absorption cross section of QDs, such experiments are not straightforward to implement, especially in high-magnetic-field apparatus where space is very limited. Moreover, most MPL experiments published in the literature deal with QD ensembles, and it is desirable to limit the effects of inhomo-geneous broadening. In photoluminescence 共PL兲 excitation 共PLE兲 spectroscopy, one sets the detection energy over a nar-row range within the GS transition and uses resonant optical excitation to create excitons one by one in an excited state of an empty QD.15,16 By sweeping the excitation energy, one can trace variations in the GS signal and reconstruct the equivalent of an absorption spectrum. Moreover, by selecting a subset of the QD ensemble when using a narrow detection range, one reduces the effects of inhomogeneous broadening. Very few magnetophotoluminescence excitation 共MPLE兲 studies can be found in the literature.17–21Only one was
per-formed on a sample with well-resolved excited-state emis-sion but that study observed only the p-shell absorption, and it was limited to 14 T.17
Here, we present MPLE results up to 28 T, where p- and
d-shell absorption as well as a number of weaker “indirect” transitions are observed. Experimental spectra are compared to detailed theoretical modeling, and all the transitions ob-served in the spectra are reproduced by our model, including their magnetic-field dependence, which allows their unam-biguous assignment. Thus, a detailed description of the single-excitonic energy shell structure in self-assembled
quantum dots is obtained. Finally, a blueshift of the PLE peaks as compared to the PL peaks is shown to give an estimate of the magnitude of exchange energies for excitonic droplets bound in QDs.
II. EXPERIMENT
The original wafer consists of a single layer of InAs QDs grown by molecular-beam epitaxy on n-doped GaAs sub-strate in the Stranski-Krastanow growth mode. After deposi-tion of a GaAs buffer, 1.9 ML of InAs was deposited at 515 ° C, followed by an in situ anneal of 60 s, and an In-flush procedure applied after deposition of 5.0 nm of GaAs.22
The sample was terminated with the growth of a 100 nm GaAs cap. Figure 1 presents a typical plan-view scanning transmission electron microscope 共STEM兲 image of the QD layer where it can be seen that a sparse ensemble of ran-domly positioned QDs is obtained. Averaging over many ar-eas similar to that presented on Fig.1, we obtain a QD den-sity of 5.0⫻ 109 cm−2, with an average lateral diameter of 20 nm. From growth conditions, the QD height is estimated to lie in the range of⬃3 – 3.5 nm.
After growth, the wafer was cleaved into 5 ⫻ 5 mm2
pieces before rapid thermal annealing共RTA兲 was performed. Our piece of interest was annealed for 30 s at a temperature of 825 ° C using a GaAs proximity cap to stabilize the sample surface. The RTA procedure blueshifts the QD emis-sion and decreases the shell energy spacing as well as the inhomogeneous broadening. These effects are beneficial for MPLE experiments, where the blueshift sets the signal in the tunability range of our excitation source, the reduced energy spacing facilitates the observation of transition crossings at lower magnetic fields, and the reduced inhomogeneous broadening helps improve the precision of the results.23
The sample was mounted on a probe at the tip of an insertion rod, which allowed the sample to be lowered into a cylindrical liquid-helium cryostat, which itself could be in-serted into the bore of a suitable magnet, thus allowing the
sample to be subjected to high magnetic fields while being kept at liquid-helium temperature 共4.2 K兲. Three different experimental configurations were used to effect the measure-ments. The first two configurations made use of an 18 T Oxford superconductive magnet. For MPL measurements, a single 50-m-core-diameter multimode optical fiber was used. The as-cleaved fiber was placed just above the sample surface, with the fiber oriented along the surface normal. The 532 nm line obtained from a Nd: YVO4 laser was used to
excite the sample surface, while the ensuing infrared signal from the QDs was collected via the same fiber and coupled to the entrance slits of a double-grating monochromator with a resolution of ⬃1 meV. The output optical signal of the spectrometer was detected via a liquid-nitrogen-cooled Ge detector, and the resulting signal was recorded using standard lock-in techniques. For MPLE measurements, a dual fiber probe arrangement was used where the wavelength tunable output of a Ti:Sapphire laser was coupled into the launch fiber which was tilted with respect to the sample surface normal, while the resulting QD signal was collected via a second fiber oriented parallel to the sample normal. This ar-rangement was used to minimize the laser back reflection into the collection fiber. Signal recording was achieved as described above for the MPL.
The third configuration was used to effect MPLE mea-surements up to 28 T. In this case, a resistive magnet at the Grenoble High Magnetic Field Laboratory was used to pro-vide the high magnetic fields. A dual fiber probe arrangement similar to that of the 18 T MPLE was used, and the excitation was again provided by a Ti:sapphire laser. However, the sig-nal detection was performed using a 1m double grating spec-trometer with extremely high stray light rejection, which en-abled the detection to be performed via a liquid-nitrogen-cooled charge coupled device array, thus enabling us to perform parallel detection at many wavelengths.
III. RESULTS
Figure 2 shows the state-filling spectroscopy of the QD ensemble where the emission intensity of higher-energy excited-state transitions increases with excitation power. In
FIG. 1. Zone axis共001兲 bright field plan-view STEM image of an as-grown piece of the QD sample used in this study. The QD areal density obtained is 5 ⫾ 1 ⫻ 109 cm−2, while the QD diameter
is⬃20 nm.
FIG. 2. Power dependence of the QD ensemble photolumines-cence revealing emission from s, p, d, and f shells. The emission intensity of higher-energy shells increases with excitation power.
AWIROTHANANON et al. PHYSICAL REVIEW B 78, 235313共2008兲
total four QD peaks are resolved, which we ascribe to s-, p-,
d-, and f-shell transitions in the QDs.12At the highest
exci-tation power, a weak signal from the wetting layer 共WL兲 is also observed at ⬃1.425 eV. It is important to note the broadening and redshift of the s-shell emission energy as the excitation intensity increases from 1.245 to 1.235 eV when going from 5 to 56 mW excitation. The other transitions also show this type of redshift with increasing power, although the effect is less pronounced. Below 5 mW of excitation power, the shape of the spectrum remains the same, and therefore 1.245 eV is the average emission energy of the single-exciton line for our sample.
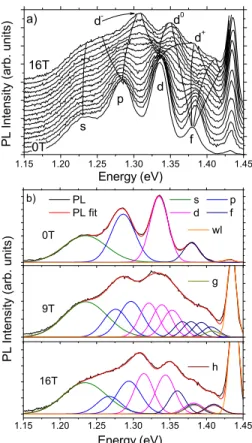
The interpretation of the different transitions observed in the PL spectra is confirmed by MPL. Figure3共a兲shows the evolution of the high excitation emission spectrum when subjected to a perpendicular magnetic field 共Faraday con-figuration兲. One observes the typical PL line splitting and crossing pattern of self-assembled QDs with increasing mag-netic field. Neglecting spin effects which are masked by the inhomogeneous broadening, the s-shell has a degeneracy of 1 共L = 0兲, the p-shell a degeneracy of 2 共L = + 1 , −1兲, the d-shell a degeneracy of 3 共L = −2 , 0 , + 2兲, and so on. Accordingly, the s-shell, with only one angular-momentum channel 共L
= 0兲, undergoes a small diamagnetic shift toward higher en-ergies, while excited-state emission lines undergo a Zeeman-type splitting according to their angular-momentum degeneracy.12,24 The p-shell splits into two lines, one for
each of its angular-momentum channels, Le= −1 and Le= + 1, which shifts toward lower and higher energies, respec-tively. The d-shell splits into three lines and so on. The solid lines are a guide to the eyes indicating the approximate evo-lution of the different transition lines.
Figure3共b兲presents an example of multi-Gaussian fits to illustrate the evolution of the different transitions and how it relates to the measured PL spectrum. At 0 T, each transition is fitted with a single Gaussian peak to obtain the best pos-sible match to the corresponding PL spectrum. Each of these lines can be viewed as the result of the superposition of one transition peak for each angular-momentum channel within the shell. Applying a magnetic field results in these peaks moving in different directions in energy, thus causing changes in the overall PL spectrum. For example, at 9 T the peaks related to each angular-momentum channel have started to separate, causing mostly a broadening of the ob-served transitions. This broadening is more pronounced for higher-energy shells since the higher angular momentum of the states in these shells results in larger shifts due to stron-ger interaction with the magnetic field. Note also that in or-der to keep consistent peak intensities for the f-shell transi-tions, we had to add an extra peak near the WL emission. This is consistent with an energy level, called “g,” peeling off from the WL continuum and becoming bound into the QD as the field is increased, a phenomenon which was ob-served in previous work.12 Increasing the magnetic field re-sults in further splitting until for a specific magnetic field another set of degeneracies is obtained, giving rise to a new set of well-resolved peaks. For example, in Fig.3共a兲at 16 T the symbols d− 共Le= −2兲, d0 共Le= 0兲, and d+ 共Le= + 2兲 indi-cate the three transition peaks involving one of the three
d-shell angular-momentum states. The corresponding fit is shown in Fig. 3共b兲 where the p+ and d− peaks are close enough in energy to produce a single well-resolved peak, and the same is true for the d0and f−peaks. At the same time, d+,
f−, and g form another energy shell, and also f+ and h 共a
newly confined transition兲.
We estimate that, for the case shown in Fig.3共a兲, the QDs are filled with an average of 14 excitons, corresponding to filled s, p, and d shells and partly filled f-shell. The B-field evolution observed in Fig. 3共a兲 therefore describes the en-ergy shell structure of an excitonic droplet confined in a QD with associated many-body interactions. A realistic quantita-tive description of the results requires intensive theoretical modeling, involving atomistic modeling of bound states, blended with many-body theory. This is not presented here, and the lines shown on top of the MPL experiment in Fig.
3共a兲are guides to the eyes only. The energy shell structure of a single exciton is easier to describe theoretically, and there-fore it would be desirable to obtain this type of data as a stepping stone in our understanding of QD bound states. Moreover, such data could be compared with data obtained for excitonic droplets and obtain information on the magni-tude of many-body interactions.
To observe the single-exciton energy shell structure, one can perform an absorption experiment where excitons are
FIG. 3. 共Color online兲 共a兲 Magnetophotoluminescence of the QD ensemble for an excitation power of 56 mW. The lines are a guide to the eyes showing the approximate position of the different angular-momentum channel transitions as the magnetic field in-creases. At 16 T, a set of resolved peaks appears which indicates that other degeneracies are obtained involving, among others, the d−, d0and d+branches.共b兲 Example of multi-Gaussian fit showing
how transitions with different angular momenta evolve with mag-netic field to produce the observed spectrum.
absorbed in the QDs one at a time, in either the GS or ex-cited states, and the absorption spectrum is monitored as a function of magnetic field. The difficulty resides in the very small absorption cross section of the QDs and the inhomo-geneous broadening. The first difficulty means that if one uses a broadband source to illuminate the sample and com-pare the transmitted spectrum with the incident source spec-trum, the differences will be minute and difficult to resolve. This difficulty can be overcome with proper experimental schemes,25but to implement those in current
high-magnetic-field apparatus appears impractical. The second difficulty means that it can be difficult to resolve the different transi-tions in the spectrum. This can be overcome if one selects a set of QDs with similar energies. Performing PLE spectros-copy incorporates these two elements; i.e., PLE is an absorp-tion experiment in which, after a relaxaabsorp-tion process, one monitors the emission over a narrow energy band in the
s-shell to obtain signal. The trade-off is that one must take into account the different possible relaxation mechanisms within the QD in the analysis. These include different relax-ation pathways from excited states to ground state, as well as radiative recombination from an excited state and nonradia-tive recombination.
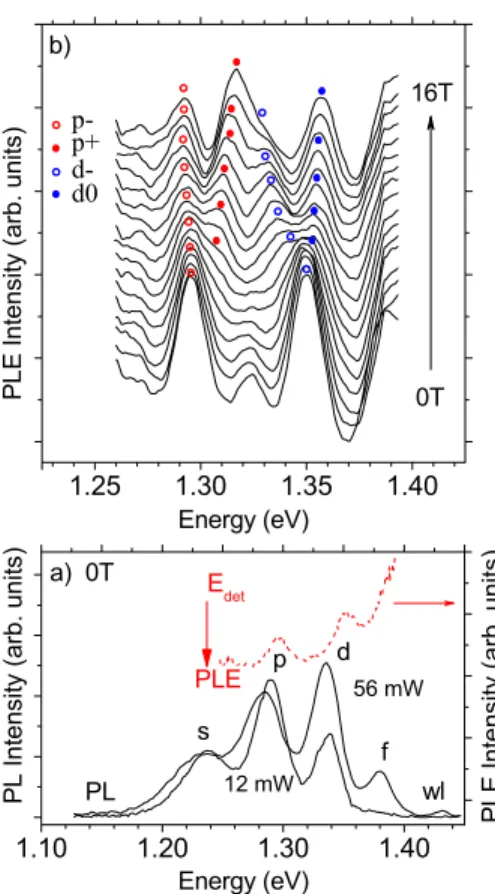
Figure4共a兲shows a comparison between PL共black solid curves兲 and PLE 共red dashed curve兲 spectra obtained at zero
field. The detection energy for the PLE experiments was fixed at 1.238 eV, which is just below the average single-exciton line transition energy.26Despite that, the most promi-nent PLE peaks, presumably corresponding to p- and d-shell absorptions, appear at higher energy than the p- and d-shell emission peaks. This may seem surprising for low-temperature measurements on zero-dimensional structures with high confinement energy. For quantum well 共QW兲 structures, a significant Stokes shift is often interpreted as originating from material nonuniformity where in PL experi-ments carriers tend to diffuse toward regions of lower band gap, causing the PL emission to be redshifted when com-pared with PLE.27 In our case, carrier transfer between QDs
via tunneling or thermal excitation or diffusion process could in principle produce a similar effect. However, it has been shown using time-resolved spectroscopy that such carrier transfer does not happen at low temperatures for samples with QD densities below 1 ⫻ 1010 cm−2.28 Moreover, in samples with strong lateral coupling, the spectral features broaden considerably toward higher energies as the excita-tion intensity is increased.29 This is not observed in Fig. 2.
On the contrary the PL lines in our sample broaden toward lower energies. Other authors have observed QD electron to WL hole state transitions in their PLE spectra,16 in which
case one certainly expects to observe an offset between the PL and PLE peaks. However, in our case the observed en-ergy spacing between the p- and d-shell transitions is greater than that observed in the PL, whereas for QD to WL transi-tions that spacing should be smaller i.e., the spacing between the p- and d-shell QD electron states only. Others have in-voked phonon-assisted absorption mechanisms, but in our case the energy offset between the PL and PLE peaks is on the order of 10–20 meV, while the energy spacing between the main PLE peaks is 56 meV. Neither of these corresponds to LO phonon energies of the materials in our sample. The interpretation of the observed PLE peaks is rather consistent with the interpretation of Hawrylak et al.7 who performed single-dot PLE on similar types of QDs and attributed ob-served resonances to interband transitions between p- and
d-shell QD bound states.
The nature of the transitions observed is confirmed by magneto-PLE experiments. Figure 4共b兲 shows the corre-sponding experimental results, where in order to enhance the contrast of the different QD transitions, the second derivative of the raw data is presented. Looking at the 0 T PLE spec-trum, four spectral regions of interest are identified. First, a weak doublet is observed with peak energies of 1.268 and 1.272 eV, 30–34 meV above the detection energy. This is consistent with phonon-assisted absorption in the GS of the QDs. These transitions are very weak compared to the other ones observed in our spectrum, confirming that the latter are unlikely to be related to phonon-assisted transitions. The sec-ond peak region is that located around 1.295 eV. The blue-shift of this absorption peak with respect to the p-shell emis-sion may suggest that it has a different origin. However, with increasing magnetic fields, this peak shifts toward lower en-ergies 共position indicated by open red circles兲 and progres-sively loses its oscillator strength. Around 5–6 T, a shoulder starts appearing on the high-energy side. This shoulder pro-gressively increases in intensity and shifts toward higher
en-FIG. 4. 共Color online兲 共a兲 Comparison of PL and PLE spectra obtained at 0 T, where the red vertical arrow indicates the PLE detection energy.共b兲 Evolution of the PLE spectrum with magnetic field. Open共full兲 circles are guide-for-the-eye symbols to illustrate the evolution of transition energies for negative共zero or positive兲 angular-momentum states. The detection energy is set at 1.238 eV for all PLE spectra presented, as indicated by the arrow.
AWIROTHANANON et al. PHYSICAL REVIEW B 78, 235313共2008兲
ergies 共position indicated by filled red circles兲 as the inten-sity of the field increases. This progressive splitting is consistent with the behavior of p−and p+transitions, and we therefore attribute this peak to p-shell absorption. The third peak located at 1.324 eV shows no shift with magnetic field and disappears around 8 T. The fourth peak at 1.350 eV is tentatively attributed to d-shell absorption. One can see a clear twofold splitting with the d−component shifting toward lower energies 共open blue circles兲 and the d0
component slowly shifting toward higher energies 共filled blue circles兲. According to the energy shell structure of a cylindrically symmetric QD, the d-shell absorption should split into three different components, which is not observed here. On the other hand, at 16 T the PL shows an emission peak at 1.383 eV which is the result of the crossing of the d+branch with
the lower f and g branches. The three-way splitting of the
d-shell was also observed clearly in other MPL experiments.12,13
More insight on the evolution of the d+ branch was
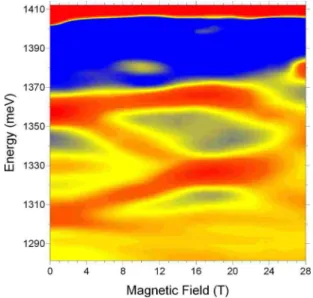
ob-tained from another MPLE experiment, this time setting the detection signal at 1.245 eV, and Fig.5 presents the surface plot of the second derivative of the data. The main features of Fig.4共b兲are reproduced: a weak signal at low energies, a
p-shell peak共1.297 eV兲 with two-way splitting, a nonshifting peak共1.330 eV兲 which disappears around 8 T, and a d-shell peak 共1.363 eV兲. The features are shifted toward higher en-ergies since the detection energy is higher and a different set of dots is probed. The main difference in Fig. 5 is that the surface plot shows indication of a three-way splitting of the d shell. In fact, one can clearly see a branch shifting toward lower energies, another branch slowly shifting toward higher energies, and the third branch is revealed when it crosses with the f−−branch at 10 T and produces a peak at 1.380 eV.
A second crossing occurs at 17 T, 1.400 eV when the d+
branch crosses with the lower g-shell branch. So, it appears
that the oscillator strength of the d+branch is lower than that of the d−and d0branches, and it is therefore more difficult to observe it above the background in the experiment.
IV. DISCUSSION
The intensity of the dot signal in PLE spectroscopy de-pends on the probability of absorption of the incident photon, the probability of electron-hole pair relaxation to the emit-ting s shell, and the probability of radiative recombination from there.30Through the first probability, the PLE intensity
is thus related to the absorption spectrum of the QD transi-tions. The results in Fig.2show that for low enough excita-tion power, only GS emission is observed, thus confirming that relaxation to the GS occurs on a shorter time scale than excited-state radiative recombination. Moreover, for coher-ently strained self-assembled QD samples with direct band gap, nonradiative recombination can be neglected at low car-rier densities, and therefore in the present case the PLE spec-trum is in fact proportional to the absorption specspec-trum of the subset of QDs selected by the detection window.
To gain more insight in the observations, the results are compared to exact diagonalization calculations of the QD absorption spectrum.31The one-exciton Hamiltonian reads
H=
兺
i Eieci+ci+兺
i Eihhi+hi−兺
ijkl Vijkle-hci+h+jhkcl, 共1兲 where c+, c, h+, and h are the creation-annihilation operatorsfor electrons and holes, respectively, Eeand Ehare the elec-tron and hole kinetic energy, and Ve-h is the electron-hole
Coulomb potential. The indices i, j, k, and l run over all QD confined states. Using Fock-Darwin states as a basis, we build the one-exciton configurations including the five lowest FD energy shells. We then build the Hamiltonian matrix re-lated to Eq. 共1兲 with off-diagonal elements describing the coupling between the different single-particle configurations and diagonalize it. The eigenstates and eigenenergies are de-noted by兩X ; i典 and Ei, respectively. The absorption spectrum is then obtained from Fermi’s golden rule
A共兲 =
兺
f 兩具X; f兩P+兩vac典兩2␦共ប − Ef兲, 共2a兲 where P+=兺
i, ci+hi+− 共2b兲 is the polarization operator which generates electron-hole pairs with opposite spins.Figure 6 shows the results of the calculation where the size of the circles is proportional to the absorption 共oscilla-tor兲 strength and the center of the circles indicate the transi-tion energy. Note that only relative energies should be con-sidered, as the parameters were not adjusted to fit the absolute emission energies. At zero fields, one observes three main transitions: the s-, p-, and d-shell-derived transitions at 35, 100, and 165 meV, respectively. The s-shell transition simply undergoes a small diamagnetic shift as the field is increased, with no splitting or changes in oscillator strength.
FIG. 5. 共Color online兲 Surface plot of the magneto-PLE with detection energy of 1.245 eV. In order of increasing intensity, the emission is represented by blue, yellow, orange, and red. The pe-ph
and de-dh transitions are observed at 1305 and 1358 meV,
The next transition is the p-shell transition at ⬃100 meV. The calculation predicts a progressive redshift of this transi-tion along with decreasing oscillator strength as the field increases. At the same time, a second transition progressively emerges on the high-energy side, with increasing blueshift and oscillator strength as the field increases. This evolution is in excellent agreement with what is observed experimentally. The d-shell transition is predicted to be the strongest one at zero field, and again the main peak is predicted to undergo a redshift along with a decrease in oscillator strength as the field increases. The d0 and d+ branches progressively
in-crease their oscillator strength as the field inin-creases, where the difficulty to resolve the d+branch in PLE measurements
is explained by its smallest oscillator strength at low fields. To understand the origin of this weak oscillator strength for the upper branches, it is useful to think in terms of Jacobi coordinates.7In such coordinates, the d-shell is composed of
one coherent bright state and two dark states. With increasing magnetic field the bright state shifts to lower energies while it loses oscillator strength due to admixture with dark states. By the same token, dark states slowly increase their oscilla-tor strength and start shifting toward higher energies. By the time the d+transition should have picked up enough oscilla-tor strength to be visible, it has shifted to higher energies where it is superimposed on a strong absorption background from the wetting layer, meaning that this state progressively becomes unbound which decreases its oscillator strength. Hence, one can resolve the d+branch in Fig.5only when it crosses with the lowest f and g branches to create a stronger “combined” transition.
By comparing the calculation results with the data of Figs.
4共b兲and5, we also obtain clues as to the origin of the weaker transitions observed in the PLE experiments. We find that the weak PLE signal at low energies 关⬃1.27 eV in Fig. 4共b兲兴 may result from a transition between an electron in the s shell and a hole in a d-shell zero-angular-momentum state. This may be superimposed on peaks originating from a three-particle absorption process in which an electron-hole pair is created in the QD GS at the same time as a phonon is created in the lattice. Approximately midway between the energy of the p- and d-shell transitions, another weak
reso-nance is observed due to p-electron to f-hole transitions. There are in fact two such transitions: one from the p+to f+ and one from p−to f−branches, and consequently these
tran-sitions will split with increasing fields according to a pattern close to the p-shell splitting. This explains the PLE signal at 1.324 eV关Fig.4共b兲兴 and 1.330 eV 共Fig.5兲, with the feature almost disappearing in the background as the transitions are split by the field. However, a faint trace shifting toward higher energies of the p+-f+transition seem to be present in
Fig. 5, with a crossing with the d− branch obtained around 9–10 T, as predicted by theory.
The close correspondence of the experimental results with the theoretical calculations leads us to conclude that all of the observed transitions in our PLE spectrum can be attrib-uted to transitions between QD bound states. Knowing this, the origin of the blueshift of the absorption peaks with re-spect to corresponding emission peaks is attributed to extra Coulomb interaction and exchange and correlation energies of the excitonic droplet probed in PL as opposed to the single QD exciton probed in PLE. This is the same interpretation put forward by Warbuton et al.32who explained the shift of
the absorption peaks in their experiments on charged QDs as originating from Coulomb interactions.
As an example, let us consider the case of Fig.4共a兲where the 12 mW PL d-shell emission energy is compared to the PLE d-shell absorption at zero field. The PL spectrum in that case has filled s- and p-shells and a less than half filled
d-shell, as can be inferred by comparison with the PL taken at an excitation of 56 mW. Therefore, we estimate that the QD is filled with eight QD excitons on average. The d-shell PL emission energy is then given by
8= Etot 8X,GS
− Etot 7X,GS
, 共3兲
where8is the energy necessary to add or remove the eighth
QD exciton from the QD droplet and Etot
nX,GS
refers to the total energy of an n-exciton droplet confined in a QD in its ground-state configuration. For an 8X and a 7X QD-exciton droplet, the total energy can be written as
Etot8X,GS= Etot 6X,GS + 2K1X,d− 2Vdirect 1X,d − 2Vexch 1X,d-6XGS − Vcorr 2X,d singlet , 共4a兲 Etot 7X,GS = Etot 6X,GS + K1X,d− V direct 1X,d − Vexch 1X,d-6XGS − Vcorr 1X,d , 共4b兲 where K1X,d is the kinetic energy of one exciton in the d shell, Vdirect
1X,d
is the direct Coulomb attraction energy of an exciton in the d-shell, Vexch
1X,d-6XGS
is the exchange energy of an extra exciton in the d-shell with a core of six excitons in its ground-state configuration, Vcorr
1X,d
is the correlation energy of a single exciton populating a d shell, and Vcorr
2X,d singlet
is the correlation energy of a biexciton populating a d shell in its singlet configuration 共we find numerically that this is the ground-state configuration for an 8X droplet兲. Note that the configuration of the filled core shells is considered “frozen” in the calculation of the correlation energies since d-shell excitons can easily be rearranged to produce same-energy configurations, which is not possible for core-shell excitons. In Eq. 共4兲 we have assumed the electron-electron 共e-e兲 and
FIG. 6. Calculated absorption spectrum of quantum dot states in magnetic field. The calculations were performed using electron and hole masses and confinement energies of 0.05m0and 0.25m0and
49.5 and 9.9 meV, respectively. The size of the circles is propor-tional to the oscillator strength.
AWIROTHANANON et al. PHYSICAL REVIEW B 78, 235313共2008兲
hole-hole共h-h兲 repulsion energies to be equal to the e-h at-traction, an approximation which we expect to be reasonable for a flat disk QD. The resulting photon energy is given by
8= K1X,d− Vdirect 1X,d − Vexch 1X,d-6XGS −共Vcorr 2X,d singlet − Vcorr 1X,d 兲. 共5兲 Similarly, we can calculate the energy of a photon ab-sorbed in the d-shell of an empty dot as follows:
EPLEd,1X= K1X,d− Vdirect 1X,d
− Vcorr 1X,d
. 共6兲
Finally, the difference between the last two quantities should be equal to the blueshift of the PLE d-shell with respect to the PL d-shell,
⌬EPLE-PL= Vexch 1X,d-6XGS + Vcorr 2X,d singlet − 2Vcorr 1X,d ⬇ Vexch 1X,d-6XGS . 共7兲 In the expression on the right-hand side of Eq. 共7兲, the correlation energy of a QD biexciton on the d-shell is set to be approximately equal to twice the correlation energy of a single QD exciton on the d-shell. This is justified by our numerical calculations which show that Vcorr2X,d singlet
⬇ 2.005Vcorr 1X,d
. Thus, the blueshift of the PLE d-shell absorp-tion with respect to the d-shell emission can be interpreted as a measure of the difference in total exchange energy in the excitonic droplet when an exciton is added in the d-shell. Comparing the peak positions of the respective d-shells in Fig.4共a兲, we find Vexch
1X,d-6XGS⬇ 10 meV. Note that this
under-estimates the real value since the correct comparison should be made when the PLE detection energy is set as the peak of the single-exciton s-shell emission. In the case of Fig. 4共a兲, the PLE detection energy was set below the s-shell peak by about 7 meV, and therefore the relevant blueshift is larger than the value quoted above. Moreover, the above discussion neglects charge fluctuations which occur in PL experiments. A time-average population of eight excitons means that the QD population fluctuates between six and ten excitons most of the time, and also the net charge will oscillate between positive and negative. Although this will cause added uncer-tainty, the deviations from the mean peak position due to these fluctuations will sometimes be positive and sometimes negative, thus causing extra broadening but more or less pre-serving the same peak position. In the end, the magnitude of the exchange energy obtained is in the range one would ex-pect from a theoretical standpoint, which supports the
attri-bution of the observed offset between corresponding PL and PLE transitions to many-body effects.
V. SUMMARY
We have performed magnetoabsorption共MPLE兲 spectros-copy of self-assembled quantum dot ensemble and have been able to establish that observed resonances originate from QD bound-state transitions; in particular, two stronger transitions are attributed to pe-ph and de-dh. Due to the selective nature of the PLE experiment, the inhomogeneous broadening is reduced as compared to PL experiments, and this allowed us to resolve some weaker transitions as well, such as se-dhand
pe-fh. A theoretical model based on exact diagonalization showed good agreement with experiment, as it reproduced the transitions observed in the experiment as well as their relative strength. Moreover, the model correctly predicts the evolution of the different transitions with magnetic field, in-cluding their energy shift and change in oscillator strength, thus giving us a high level of confidence in the correctness of the model and our interpretation of the experimental results. Taking advantage of this knowledge, we interpret the blue-shift of the PLE resonances with respect to corresponding PL resonances as a manifestation of many-body effects. We have shown that for the case of the d-shell PL emission, the en-ergy difference between the PL and the absorption 共PLE兲 peaks for the case of a QD filled with eight excitons gives a direct measure of the increase in exchange energy when one adds the eighth exciton in a QD already filled with seven excitons. We obtain a lower bound value of 10 meV for the type of QDs in our sample.
ACKNOWLEDGMENTS
The authors would like to acknowledge the help of M. Guy Parent for TEM sample preparation. S.A. would like to acknowledge the Institute for the Promotion of Teaching Sci-ence and Technology 共IPST Thailand兲 for its support. A.B. would like to acknowledge the support of the EC Grant No. MTKD-CT-2005-029671. M.V. would like to acknowledge NSERC for its support. S.J.C. acknowledges the National Science Council of Taiwan for financial support under Con-tract No. NSC-93-2112-M-009-020 and the Institute for Mi-crostructural Sciences for hospitality. M.P. would like to ac-knowledge EC Grant No. RITA-CT-2003-505474 and NRC 共Canada兲-CNRS 共France兲 CRP.
1M. Sugawara, N. Hatori, M. Ishida, H. Ebe, Y. Arakawa, T.
Akiyama, K. Otsubo, T. Yamamoto, and Y. Nakata, J. Phys. D
38, 2126共2005兲.
2S. K. Ray, T. L. Choi, K. M. Groom, H. Y. Liu, M. Hopkinson,
and R. A. Hogg, IEEE Photon. Technol. Lett. 19, 109共2007兲.
3T. Akiyama, M. Ekawa, M. Sugawara, K. Kawaguchi, H. Sudo,
A. Kuramata, H. Ebe, and Y. Arakawa, IEEE Photon. Technol. Lett. 17, 1614共2005兲.
4Z. Yuan, B. E. Kardynal, R. M. Stevenson, A. J. Shields, C. J.
Lobo, K. Cooper, N. S. Beattie, D. A. Ritchie, and M. Pepper, Science 295, 102共2002兲.
5X. Li, Y. Wu, D. Steel, D. Gammon, T. H. Stievater, D. S.
Katzer, D. Park, C. Piermarocchi, and L. J. Sham, Science 301, 809共2003兲.
6M. Kroutvar, Y. Ducommun, D. Heiss, M. Bichler, D. Schuh, G.
Abstreiter, and J. J. Finley, Nature共London兲 432, 81 共2004兲.
7P. Hawrylak, G. A. Narvaez, M. Bayer, and A. Forchel, Phys.
8V. Fock, Z. Phys. 47, 446 共1928兲; C. G. Darwin, Proc.
Cam-bridge Philos. Soc. 27, 86共1931兲.
9T. Fujisawa, D. G. Austing, Y. Tokura, Y. Hirayama, and S.
Tarucha, Nature共London兲 419, 278 共2002兲; C. Gould, P. Hawry-lak, A. S. Sachrajda, Y. Feng, and Z. Wasilewski, Physica B
256-258, 141共1998兲.
10H. Drexler, D. Leonard, W. Hansen, J. P. Kotthaus, and P. M.
Petroff, Phys. Rev. Lett. 73, 2252共1994兲.
11S. Raymond, P. Hawrylak, C. Gould, S. Fafard, A. Sachrajda, M.
Potemski, A. Wojs, S. Charbonneau, D. Leonard, P. M. Petroff, and J. L. Merz, Solid State Commun. 101, 883 共1997兲; P. P. Paskov, P. O. Holtz, B. Monemar, J. M. Garcia, W. V. Schoen-feld, and P. M. Petroff, Phys. Rev. B 62, 7344 共2000兲; R. Rinaldi, P. V. Giugno, R. Cingolani, H. Lipsanen, M. Sopanen, J. Tulkki, and J. Ahopelto, Phys. Rev. Lett. 77, 342 共1996兲; S. Ménard et al., J. Vac. Sci. Technol. B 20, 1501共2002兲.
12S. Raymond, S. Studenikin, A. Sachrajda, Z. Wasilewski, S. J.
Cheng, W. Sheng, P. Hawrylak, A. Babinski, M. Potemski, G. Ortner, and M. Bayer, Phys. Rev. Lett. 92, 187402共2004兲.
13A. Babinski, M. Potemski, S. Raymond, J. Lapointe, and Z. R.
Wasilewski, Phys. Rev. B 74, 155301共2006兲.
14Even for resonant excitation and low excitation powers, D.
Mor-ris et al. found that the Mor-rise time of the GS PL is 35 ps or shorter; see D. Morris, N. Perret, and S. Fafard, Appl. Phys. Lett. 75, 3593共1999兲.
15M. Notomi, T. Furuta, H. Kamada, J. Temmyo, and T.
Tama-mura, Phys. Rev. B 53, 15743共1996兲.
16S. Fafard, D. Leonard, J. L. Merz, and P. M. Petroff, Appl. Phys.
Lett. 65, 1388共1994兲; R. Oulton, J. J. Finley, A. I. Tartakovskii, D. J. Mowbray, M. S. Skolnick, M. Hopkinson, A. Vasanelli, R. Ferreira, and G. Bastard, Phys. Rev. B 68, 235301共2003兲.
17L. R. Wilson, D. J. Mowbray, M. S. Skolnick, M. Morifuji, M. J.
Steer, I. A. Larkin, and M. Hopkinson, Phys. Rev. B 57, R2073 共1998兲.
18A. Babinski, S. Awirothananon, S. Raymond, S. Studenikin, P.
Hawrylak, S.-J. Cheng, W. Sheng, Z. Wasilewski, M. Potemski, and A. Sachrajda, Physica E共Amsterdam兲 22, 603 共2004兲.
19Y. Toda and Y. Arakawa, IEEE J. Sel. Top. Quantum Electron. 6,
528共2000兲.
20S. Kuroda, N. Ihto, Y. Terai, K. Takita, T. Okuno, M. Nomura,
and Y. Masumoto, J. Alloys Compd. 371, 31共2004兲.
21A. Zrenner, F. Findeis, M. Baier, M. Bichler and G. Abstreiter,
Physica B: Condens. Matter 298, 239共2001兲.
22Z. R. Wasilewski, S. Fafard, and J. P. McCaffrey, J. Cryst.
Growth 201-202, 1131共1999兲.
23S. Fafard and C. Nì. Allen, Appl. Phys. Lett. 75, 2374共1999兲. 24A. Wojs, P. Hawrylak, S. Fafard, and L. Jacak, Phys. Rev. B 54,
5604共1996兲; A. Wojs and P. Hawrylak, ibid. 53, 10841 共1996兲.
25C. S. Dürr, R. J. Warbuton, K. Karrai, J. P. Kotthaus, G.
Medeiros-Ribeiro, and P. M. Petroff, Physica E共Amsterdam兲 2, 23共1998兲.
26We have independently measured the s-shell diamagnetic shift to
be 2 meV over the range of magnetic fields investigated. For-mally, the detection energy should have been changed at every magnetic field to account for this effect. In view of the small magnitude of this shift compared to p- and d-shell shifts, this was neglected in the experiment and the detection energy was kept constant. This produces a small error on the slope of the shifts observed in Fig. 4共b兲 where transitions should shift +2 meV/ T faster than observed. This does not affect results at 0 T.
27A. Polimeni, A. Patanè, M. Grassi Alessi, M. Capizzi, F.
Mar-telli, A. Bosacchi, and S. Franchi, Phys. Rev. B 54, 16389 共1996兲.
28K. L. Silverman, R. P. Mirin, and S. T. Cundiff, Phys. Rev. B 70,
205310共2004兲.
29S. Lan, K. Akahane, H.-Z. Song, Y. Okada, M. Kawabe, T.
Nish-imura, and O. Wada, Phys. Rev. B 61共24兲, 16847 共2000兲.
30P. Yu and M. Cardona, Fundamentals of Semiconductors
共Springer, Berlin, 1999兲, p. 357.
31P. Hawrylak, Phys. Rev. B 60, 5597共1999兲.
32R. J. Warburton, C. S. Dürr, K. Karrai, J. P. Kotthaus, G.
Medeiros-Ribeiro, and P. M. Petroff, Phys. Rev. Lett. 79, 5282 共1997兲.
AWIROTHANANON et al. PHYSICAL REVIEW B 78, 235313共2008兲