HAL Id: hal-00317631
https://hal.archives-ouvertes.fr/hal-00317631
Submitted on 23 Sep 2004
HAL is a multi-disciplinary open access
archive for the deposit and dissemination of
sci-entific research documents, whether they are
pub-lished or not. The documents may come from
teaching and research institutions in France or
abroad, or from public or private research centers.
L’archive ouverte pluridisciplinaire HAL, est
destinée au dépôt et à la diffusion de documents
scientifiques de niveau recherche, publiés ou non,
émanant des établissements d’enseignement et de
recherche français ou étrangers, des laboratoires
publics ou privés.
Multistation digisonde observations of equatorial spread
F in South America
B. W. Reinisch, M. Abdu, I. Batista, G. S. Sales, G. Khmyrov, T. A. Bullett,
J. Chau, V. Rios
To cite this version:
B. W. Reinisch, M. Abdu, I. Batista, G. S. Sales, G. Khmyrov, et al.. Multistation digisonde
observa-tions of equatorial spread F in South America. Annales Geophysicae, European Geosciences Union,
2004, 22 (9), pp.3145-3153. �hal-00317631�
Annales Geophysicae (2004) 22: 3145–3153 SRef-ID: 1432-0576/ag/2004-22-3145 © European Geosciences Union 2004
Annales
Geophysicae
Multistation digisonde observations of equatorial spread F in South
America
B. W. Reinisch1, M. Abdu2, I. Batista2, G. S. Sales1, G. Khmyrov1, T. A. Bullett3, J. Chau4, and V. Rios5
1University of Massachusetts Lowell, 600 Suffolk St., Lowell MA 01854, USA
2Instituto Nacional de Pesquisas Espaciais, Ave dos Astronautas 1758 C.P. 515 12202-970 Sao Jose dos Campos, SP, Brazil 3Air Force Research Laboratory, 29 Randolph Road, Hanscom AFB, MA 01731, USA
4Jicamarca Radio Observatory, Instituto Geof´ısico del Per´u, Apartado 13-0207, Lima 13, Peru 5University of Tucuman, Av. Independencia 1800, (4000) San Miguel de Tucuman, Argentina
Received: 8 December 2003 – Revised: 23 April 2004 – Accepted: 18 May 2004 – Published: 23 September 2004
Part of Special Issue “Equatorial and low latitude aeronomy”
Abstract. Directional ionogram and F -region drift obser-vations were conducted at seven digisonde stations in South America during the COPEX campaign from October to De-cember 2002. Five stations in Brazil, one in Argentina, and one in Peru, monitored the ionosphere across the continent to study the onset and development of F -region density deple-tions that cause equatorial spread F (ESF). New ionosonde techniques quantitatively describe the prereversal uplifting of the F layer at the magnetic equator and the eastward motion of the depletions over the stations. Three of the Brazilian stations were located along a field line with a 350-km apex over the equator to investigate the relation of the occurrence of ESF and the presence of sporadic layers at the two E-region intersections of the field line. No simple correlation was found.
Key words. Ionosphere (equatorial ionosphere; ionospheric irregularities; instruments and techniques)
1 Introduction
To fully understand the processes that control the onset of equatorial spread F it is helpful to investigate time develop-ment and spatial distribution of this F -region phenomenon. In support of the Brazilian COPEX campaign (Abdu et al., 2003), digisondes collecting ionogram and F -region drift data at seven sites in South America (Fig. 1). The sites are located within about ±15◦ magnetic latitude and cover
about 30◦ in longitude. The ionosondes typically recorded
one multi-directional ionograms and a number of drift mea-surements every 5 min during the COPEX campaign period from October to December 2002. Three ionosondes were
Correspondence to: B. W. Reinisch
(Bodo Reinisch@uml.edu)
installed along a magnetic meridian with one sounder close to the magnetic equator (Cachimbo, 0.4◦N magnetic), and the two other sounders (Boa Vista, 12.9◦N; Campo Grande, −10.6◦N magnetic) close to the intersections with the E-region of the 350-km field line over Cachimbo (Fig. 2). The objective was to study the influence that sporadic E-layers at the field line footprints may have on the formation of ESF at Cachimbo. Major characteristics of ESF in the South Amer-ican longitude sector, and especially over Brazil, have been studied during the last two decades (see, for example, Abdu et al., 1998; Batista et al., 1990).
2 Discussion
2.1 Signatures of low-latitude spread F in ionograms
The term “spread F ” was coined to give a visual descrip-tion of the broadened echo traces seen on ionograms at certain times (Fig. 3). The equatorial spread F (ESF) is usually associated with depletions in F -region densities, as shown by incoherent scatter radar (ISR) measurements at Ji-camarca, Peru (e.g. Woodman and La Hoz, 1976; Ander-son and Mendillo, 1983 and references therein). Sales et al. (1996) have used retracing to establish that the spread traces on equatorial region ionograms are the result of off-vertical echoes that return from field-aligned irregularities in the depleted region, as identified by 630 nm all-sky images. Modern ionosondes operate essentially as radar systems, i.e. they measure radar distances and angles of arrival of the re-ceived echoes (Reinisch, 1996). In contrast to a conventional radar system, the ionosonde transmits a wide radio beam that illuminates a large area of several hundred km in diameter in the F -region, resulting in echoes returning from many direc-tions in the presence of irregularities. With the introduction of Doppler interferometry to ionospheric sounding (Bibl and
3146 B. W. Reinisch et al.: Multistation digisonde observations
7 Figure 1. Location of the seven digisondes in South America
Fig. 1. Location of the seven digisondes in South America.
8
Figure 2. The Brazilian COPEX stations at the equator (Cachimbo) and the conjugates stations
at Boa Vista and Campo Grande.
B. W. Reinisch et al.: Multistation digisonde observations 3147
9
Frequency (MHz)
Figure 3. Multi-directional ionogram at Cachimbo for November 22 at 1920 LT showing echo
traces from the west, east, and overhead, with an overlay of the vertical electron density (plasma
frequency profile.
Hei
ght
(km
)
Fig. 3. Multi-directional ionogram at Cachimbo for 22 November at 19:20 LT showing echo traces from the west, east, and overhead, with an overlay of the vertical electron density (plasma frequency) profile.
Reinisch, 1978), it has become possible to identify the source regions of the spread echoes. The DPS digisondes use four small spaced antennas for signal reception arranged in a tri-angle with one antenna at the center. The signals from each antenna are Fourier analyzed to identify echoes with different Doppler frequencies.
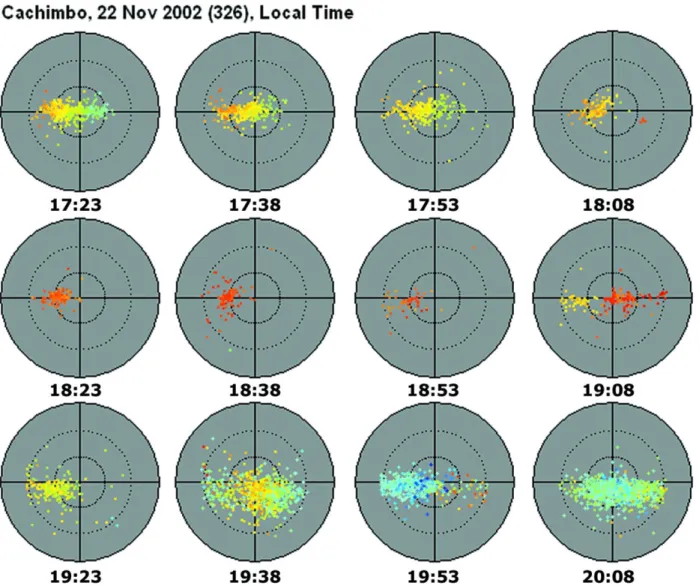
Interferometry for each Doppler component then deter-mines the source locations of the echoes, as illustrated by the high-resolution skymap in Fig. 4 observed at 19:13 LT, just a few minutes before the ionogram in Fig. 3 was recorded. The skymap, in geomagnetic coordinates, shows the locations of the F -region reflection points for frequencies between 3.8 and 5.3 MHz from within a cone of 30◦ around zenith; the colors indicate the Doppler shifts from −2 Hz (red) to +2 Hz (blue). The reflection points are distributed in the east-west direction, with Doppler frequencies of −0.4 Hz in the west to −2.0 Hz in the east. This Doppler frequency distribution suggests an upward and eastward drift velocity. The skymap measurements were repeated every 5 min to investigate the changing structure in the F -region and to determine the drift velocity components as a function of time. Figure 5 shows a subset of skymaps on 22 November 2002 for Cachimbo, spaced by 15 min, starting at 17:23 LT. Each skymap is the result of a 20-s measurement at 4 frequencies between 3 and 5 MHz. The F -layer becomes tilted by about 5◦around 18:00 LT when the terminator moves over the station, and most reflection points are in the west.
10 Figure 4. Cachimbo skymap for November 22 at 1913 LT showing echoes from the west with
Doppler frequencies of –0.4 Hz, and from the east with Doppler frequencies of –2.0 Hz. The skymap displays zenith angles from 0 to 30°.
Fig. 4. Cachimbo skymap for 22 November at 19:13 LT showing echoes from the west with Doppler frequencies of −0.5 Hz, and from the east with Doppler frequencies of −2.0 Hz. The skymap displays zenith angles from 0 to 20◦.
3148 B. W. Reinisch et al.: Multistation digisonde observations
11
Figure 5. Skymaps for Cachimbo on November 22 from 1723 LT to 2008 LT, showing the
effect of the terminator passing at ~1800 LT.
Fig. 5. Skymaps for Cachimbo on 22 November from 17:23 LT to 20:08 LT, showing the effect of the terminator passing at ∼18:00 LT.
12 Figure 6. Seven digitally synthesized beams for ionograms measurements.
Fig. 6. Seven digitally synthesized beams for ionograms measure-ments.
For the ionogram display, the DPS synthesizes 7 beams pointing vertical and into six azimuthal directions at a se-lected fixed zenith angle, typically 20◦ (Fig. 6). At each
sounding frequency, the 7 digital beams are calculated for each range (height bin), resulting in an ensemble of 7 ordi-nary (O) polarization ionograms and 7 extraordiordi-nary polar-ization (X) ionograms. From the Fourier spectrum at each range, only the maximum spectral component is selected and the beam direction with the maximum synthesized amplitude is assigned to the range bin in the ionogram. The Cachimbo ionogram in Fig. 3 uses different colors to indicate the di-rections from which the echoes are arriving, clearly showing the composite nature of the equatorial spread F ionograms, with F -region echoes arriving mainly from the west, east, and overhead in agreement with the skymap in Fig. 4. The overhead trace (O echoes red, X echoes green) is used to calculate the vertical electron density profile up to hmF 2, superimposed on the ionogram as plasma frequency versus height (Huang and Reinisch, 2001). The topside part of the
B. W. Reinisch et al.: Multistation digisonde observations 3149
13
Figure 7. Directograms for Cachimbo and Jicamarca on November 22 show the distances to the
depletions observed in the ionograms.
Fig. 7. Directograms for Cachimbo and Jicamarca on 22 November show the distances to the depletions observed in the ionograms.
profile is derived by using the measured scale height at the F2 peak and assuming a matching α-Chapman density distri-bution (Reinisch and Huang, 2001).
2.2 ESF development
The ionograms usually sees an approaching depletion in the west about 30 to 60 min before it arrives overhead, depending on the eastward drift velocity. Measuring the radar ranges to the vertical and oblique echoes and the direction from which the echoes arrive, it is possible to calculate the approximate horizontal distances to the depletions and plot them as a func-tion of time in a “directogram”. The directogram shows the distance to the depletions in the west and east, and sup-presses the vertical echoes. Figure 7 shows the directograms for 22 November at Jicamarca and Cachimbo. As expected, Cachimbo sees the development of depletions one hour be-fore Jicamarca detects any. These disturbances persist for about 9 h at both locations, although at a reduced level at Cachimbo from 03:00 to 05:00 UT. Eastward displacement of the ESF depletions with its irregularity is clearly seen over Cachimbo, with the displacement velocity decreasing towards post midnight hours (LT=UT−3 h). Over Jicamarca such displacement velocity is not clearly defined . This be-havior might suggest the existence of a longitudinal variation
in the irregularity dynamics. It should be investigated if this longitudinal difference is the result of the moderate intensity magnetic disturbance (with 6Kip=31) that characterized this
night.
We studied the occurrence of ESF at the three equatorial locations, Jicamarca in the west, Cachimbo, and Sao Luis in the east. Figure 8 shows the automatically generated display of observed range spread QF in km for a) October and b) November 2002. The ionogram cadence was 5 min at Jica-marca and Cachimbo, and 15 min at Sao Luis. A solid line underneath the data indicates that the sounder was operating. The averaged daily Kpvalues in the bottom panel do not
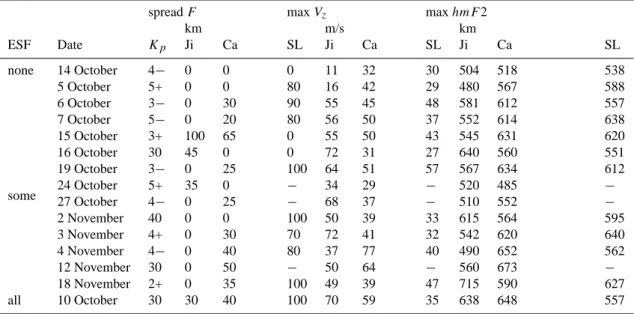
re-veal any apparent correlation with the ESF activity. On most of the 61 days, ESF occurrence is the same for the three sta-tions, but on 13 days, listed in the group “some” in Table 1, one or two of the sites are quiet. Only one day, 14 October (none), had quiet conditions at all three sites. For comparison Table 1 shows one example, October 10 (all), with all sites active. The table lists the observed range spread QF, the max-imum vertical drift Vzat the prereversal enhancement (Farley
et al., 1986), and the maximum F2 peak height hmF 2; the average Kpvalue is given for each of the days. High Vzand
large hmF 2 values are usually assumed to be preconditions for ESF development (Fejer et al., 1999) but our examples
3150 B. W. Reinisch et al.: Multistation digisonde observations
14
(a)
(b)
Figure 8. Automatically detected range spread at Jicamarca, Cachimbo, and Sao Luis for
a) October and b) November 2003. Underlining shows the times of digisonde operation.
Fig. 8. Automatically detected range spread at Jicamarca, Cachimbo, and Sao Luis for (a) October and (b) November 2003. Underlining shows the times of digisonde operation.B. W. Reinisch et al.: Multistation digisonde observations 3151
Table 1. Range spread, maximum vertical drift at prereversal enhancement, and the maximum F2 layer peak height for October and November 2002, grouped into all sites quiet (none), some but not all sites with ESF activity (some), and one example for all three sites active (all). A dash indicates “no data”.
spread F max Vz max hmF 2
km m/s km ESF Date Kp Ji Ca SL Ji Ca SL Ji Ca SL none 14 October 4− 0 0 0 11 32 30 504 518 538 some 5 October 5+ 0 0 80 16 42 29 480 567 588 6 October 3− 0 30 90 55 45 48 581 612 557 7 October 5− 0 20 80 56 50 37 552 614 638 15 October 3+ 100 65 0 55 50 43 545 631 620 16 October 30 45 0 0 72 31 27 640 560 551 19 October 3− 0 25 100 64 51 57 567 634 612 24 October 5+ 35 0 − 34 29 − 520 485 − 27 October 4− 0 25 − 68 37 − 510 552 − 2 November 40 0 0 100 50 39 33 615 564 595 3 November 4+ 0 30 70 72 41 32 542 620 640 4 November 4− 0 40 80 37 77 40 490 652 562 12 November 30 0 50 − 50 64 − 560 673 − 18 November 2+ 0 35 100 49 39 47 715 590 627 all 10 October 30 30 40 100 70 59 35 638 648 557
Table 2. f oEs values at Boa Vista / Campo Grande (the larger value) at the time of the prereversal enhancement on the days without ESF at Cachimbo.
Date f oEs(22:00 UT) f oEs(22:15 UT) Time of Vz, max f oEs(at time of Vz, max)
2002 MHz MHz UT MHz 5 October 2.4 2.3 22:00 2.4 14 October 4.7 7.9 22:10 7.7 16 October 3.9 2.6 22:05 2.6 24 October 3.4 3.8 21:55 2.4 2 November >1.5 4.3 22:00 >1.5
show that these conditions are not sufficient. There is no sys-tematic difference in Vzor hmF 2 at the sites with or without
ESF occurrence.
2.3 Effect of E-region conductivity
It is often speculated that the field-line integrated Pedersen conductivity is affected by sporadic E ionization at the Eregion footprints of the magnetic field line through the F -region at the equator, and that Es may short circuit the electric field necessary to lift the F2 layer preventing the Rayleigh-Taylor instability to grow. The two digisondes at Boa Vista in the north and Campo Grande in the south have monitored the Es activity during the COPEX campaign close to the E-region intersection of the magnetic field line that crosses the equator at 350 km over Cachimbo. The f oEs critical frequency distribution for 68 nights with ESF activity peaks between 2 and 3 MHz. Figure 9 gives the distribution at 22:00 UT, and Vz at Cachimbo usually reaches its
maxi-mum values between 22:00 and 22:20 UT. The larger of the
15 Figure 9. Distribution of foEs values at Boa Vista / Campo Grande at 2200 UT for ESF days at
Cachimbo
Fig. 9. Distribution of f oEs values at Boa Vista/Campo Grande at 22:00 UT for ESF days at Cachimbo.
3152 B. W. Reinisch et al.: Multistation digisonde observations
16
(a)
(b)
(c)
Figure 10. Vertical, meridional, and zonal drift velocities on November 22-23 (strong ESF) at
a) Jicamarca and b) Cachimbo, and c) on November 2-3 (no ESF) at Cachimbo.
Fig. 10. Vertical, meridional, and zonal drift velocities on 22–23 November (strong ESF) at (a) Jicamarca and (b) Cachimbo, and (c) on 2–3 November (no ESF) at Cachimbo.
B. W. Reinisch et al.: Multistation digisonde observations 3153
f oEsvalues observed at Boa Vista and Campo Grande was included in the statistics.
Table 2 summarizes the Es activity at Boa Vista and Campo Grande on the 5 quiet days at Cachimbo without ESF. Clearly the f oEs values are not any larger on these days than on the 68 disturbed days. A preliminary conclusion is that the presence or lack of sporadic E at the footprints of the mag-netic field line plays no role in inhibiting or encouraging the development of equatorial spread F at the magnetic equator.
2.4 Equatorial F -region drift
For the first time, all three components of the F -region drift were simultaneously measured by the digisondes at several equatorial sites. The velocity components are calculated from the line of site velocities (Doppler frequency shifts) of the skymap source points (Reinisch et al., 1998). Figures 10a and 10b show the vertical, and the magnetic meridional and zonal velocities on 22 November, which had strong ESF ac-tivity at Jicamarca and Cachimbo. The error bars are shown in gray. For comparison, Fig. 10c shows the velocities at Cachimbo for 2 November when neither site observed ESF. On the quiet day, Vzat Cachimbo reached a value of 40 m/s
compared to 65 m/s on 22 November, but this is not a par-ticularly small value and many days with smaller values did have ESF. The maximum Vzat Jicamarca (not shown here)
was about the same on these two days.
The horizontal components at Cachimbo show more sig-nificant differences on these two days. On 2 November just before sunset, the northward velocity reaches values above 100 m/s and westward velocities of 120 m/s, and very low eastward velocities prevailed after the prereversal enhance-ment. At this stage of our analysis we have not yet done a systematic evaluation of the horizontal plasma flow. It is likely that the gravity waves, which may be required to trig-ger the instabilities (Valladares et al., 1983) could be identi-fied with the drift measurements.
Acknowledgements. UML was in part supported by AFRL under
contract AF19628-02-C-0092.
Topical Editor M. Lester thanks two referees for their help in evaluating this paper.
References
Abdu, M. A., Sobral, J. H. A., Batista, I. S., Rios, V. H., and Med-ina, C.: Equatorial spread-F occurrence statistics in the Ameri-can longitudes: Diurnal, seasonal and solar cycle variations, Adv. Space Res., 22(6):851–854, 1998.
Abdu, M. A., Batista, I. S., Reinisch, B. W., de Souza, J. R., de Paula, E. R., Sobral, J. H. A., and Bullett, T, W.: Equa-torial Spread F and Ionization Anomaly development as diag-nosed from conjugate point observations (COPEX) in Brasil, XXIII IUGG General Assembly Sapporo, Japan, 30 June–11 July, 2003.
Anderson, D. N. and Mendillo, M.: Ionospheric conditions affect-ing the evolution of equatorial plasma depletions,. Geophys. Res. Lett., 10, 541–545, 1983.
Batista, I. S., Abdu, M. A., and Medrano, R. A.: ”Magnetic activity effects on range type spread-F and vertical plasma drift at Fort-aleza and Huancayo as studied through ionosonde measurements and theoretical modeling, Ann. Geophys., 8(5), 357–364, 1990. Bibl, K. and Reinisch, B. W.: The universal digital ionosonde,
Ra-dio Sci., 13, 519–530, 1978.
Farley, D. T, Bonelli, E., Fejer, B. G., and Larson, M. F.: The pre-reversal enhancement of the zonal electric field in the equatorial ionosphere, J. Geophys. Res. 91, 13 723–13 731, 1986.
Fejer, B. G., Scherliess, L., and De Paula, E. R.: Effects of the vertical plasma drift velocity on the generation and evolution of equatorial spread F , J. Geophys. Res. 104, 19 854–19 869, 1999. Huang, X. and Reinisch, B. W.: Vertical total electron content from
ionograms in real time, Radio Science, 36, 2, 335–342, 2001. Reinisch, B. W.: Modern Ionosondes, in Modern Ionospheric
Sci-ence, (Eds. Kohl, H., R¨uster, R., and Schlegel, K., European Geo-physical Society, 37191 Katlenburg-Lindau, Germany, 440–458, 1996.
Reinisch, B. W. and Huang, X.: Deducing Topside Profiles and To-tal Electron Content from Bottomside Ionograms, Adv. Space Res., 27, 1, 23–30, 2001.
Reinisch, B. W., Scali, J. L., and Haines, D. M.: Ionospheric drift measurements with ionosondes, Annali di Geofisica, 41, N. 5-6, 695–702, 1998.
Sales, G. S., Reinisch, B. W., Scali, J. L., Dozois, C., Bullett, T. W., Weber, E. J., and Ning, P.: Spread-F and the structure of equa-torial ionization depletions in the Southern Anomaly region, J. Geophys. Res., 101, A12, 26 819–26 827, 1996.
Valladares, C. E., Hanson, W. B., McClure, J. P., Cragin, B. L.: Bottomside sinusoidal irregularities in the equatorial F -region, J. Geophys. Res. 88, 8025–8042, 1983.
Woodman, R. F. and La Hoz, C.: Radar observations of F−region equatorial irregularities, J. Geophys,. Res., 81, 5447–5461, 1976.