HAL Id: hal-01157809
https://hal.archives-ouvertes.fr/hal-01157809
Submitted on 28 May 2015
HAL is a multi-disciplinary open access
archive for the deposit and dissemination of
sci-entific research documents, whether they are
pub-lished or not. The documents may come from
teaching and research institutions in France or
abroad, or from public or private research centers.
L’archive ouverte pluridisciplinaire HAL, est
destinée au dépôt et à la diffusion de documents
scientifiques de niveau recherche, publiés ou non,
émanant des établissements d’enseignement et de
recherche français ou étrangers, des laboratoires
publics ou privés.
Improving volcanic sulfur dioxide cloud dispersal
forecasts by progressive assimilation of satellite
observations
Marie Boichu, Lieven Clarisse, Dmitry Khvorostyanov, Cathy Clerbaux
To cite this version:
Marie Boichu, Lieven Clarisse, Dmitry Khvorostyanov, Cathy Clerbaux. Improving volcanic sulfur
dioxide cloud dispersal forecasts by progressive assimilation of satellite observations. Geophysical
Research Letters, American Geophysical Union, 2014, 41, pp.2637-2643. �10.1002/2014GL059496�.
�hal-01157809�
RESEARCH LETTER
10.1002/2014GL059496 Key Points:• Refined SO2cloud dispersal forecasts by assimilation of satellite observations • Refined estimation of source
emissions using an inverse modeling approach • Compared to standard
meth-ods, cloud SO2-rich parts are robustly forecasted Supporting Information: • Readme • Figures S1–S5 Correspondence to: M. Boichu, mboichu@lmd.ens.fr Citation: Boichu, M., L. Clarisse, D.
Khvorostyanov, and C. Clerbaux (2014), Improving volcanic sulfur dioxide cloud dispersal forecasts by progressive assimilation of satellite observations,
Geophys. Res. Lett., 41, 2637–2643,
doi:10.1002/2014GL059496.
Received 6 FEB 2014 Accepted 10 MAR 2014
Accepted article online 20 MAR 2014 Published online 11 APR 2014
Improving volcanic sulfur dioxide cloud dispersal forecasts
by progressive assimilation of satellite observations
Marie Boichu1, Lieven Clarisse2, Dmitry Khvorostyanov1, and Cathy Clerbaux2,3
1Laboratoire de Météorologie Dynamique, CNRS/INSU, École Normale Supérieure de Paris, École Polytechnique,
Université Pierre et Marie Curie, UMR 8539, IPSL, Paris, France,2Spectroscopie de l’Atmosphère, Service de Chimie
Quantique et Photophysique, Université Libre de Bruxelles, Brussels, Belgium,3Université Pierre et Marie Curie, Université
Versailles St-Quentin, CNRS/INSU, LATMOS-IPSL, UMR8190, Paris, France
Abstract
Forecasting the dispersal of volcanic clouds during an eruption is of primary importance, especially for ensuring aviation safety. As volcanic emissions are characterized by rapid variations of emission rate and height, the (generally) high level of uncertainty in the emission parameters represents a critical issue that limits the robustness of volcanic cloud dispersal forecasts. An inverse modeling scheme, combining satellite observations of the volcanic cloud with a regional chemistry-transport model, allows reconstructing this source term at high temporal resolution. We demonstrate here how a progressive assimilation of freshly acquired satellite observations, via such an inverse modeling procedure, allows for delivering robust sulfur dioxide (SO2) cloud dispersal forecasts during the eruption. This approach provides a computationally cheap estimate of the expected location and mass loading of volcanic clouds, including the identification of SO2-rich parts.1. Introduction
In the event of an eruption, volcanic products can pose significant hazards to aircrafts. Ash represents the main hazard as it causes damages ranging from engine failure, windshields abrasion, and disruption of sen-sitive avionics equipment [Prata, 2009]. Sulfur dioxide (SO2) also generates a potential danger if exposure is chronic, as sulphidation of the metals in jet turbine fans could lead to engine damage [Carn et al., 2009]. Therefore, providing robust forecasts of the atmospheric evolution of the emitted ash- and gas-rich vol-canic cloud, in terms of location and concentration, is crucial to reliably assess the extent of restricted flight airspace and thereby to ensure safe air travels [Bonadonna et al., 2012].
On one hand, on a continental scale, numerical chemistry-transport models, forced by meteorological observations, now allow for estimating with a high degree of confidence the expected trajectory within the atmospheric circulation system of any given ash/gas parcel emitted by a volcano [e.g., Haywood et al., 2010;
Heard et al., 2012]. Overall, SO2and ash are likely to follow the same trajectory if emitted at similar injection heights [e.g., Thomas and Prata, 2011]. As SO2is the most easily detected species from space, SO2is often taken as a convenient indicator of the likely presence of ash [Carn et al., 2009; Sears et al., 2013]. However, ash and SO2can be separated due to different production mechanisms at source or a distinct settling veloc-ity combined with wind shear [Schneider et al., 1999; Prata and Kerkmann, 2007]. Most importantly, volcanic ash and SO2release is characterized by rapid variations in both emission rate and height [Stohl et al., 2011;
Boichu et al., 2013]. Unfortunately, most of the active volcanoes in the world are still not or poorly monitored
so that our knowledge of these emission parameters remains limited [Marzocchi et al., 2012]. As a conse-quence, the initialization of numerical simulations of atmospheric chemistry-transport and the resulting robustness of volcanic cloud dispersal forecasts are subject to large uncertainty [Webley and Mastin, 2009;
Bonadonna et al., 2012].
When local ground observations are lacking or become practically inoperative, satellite observations of vol-canic clouds can be used to track the evolution of eruptive activity. Assuming that the swath of satellite observations allows fully capturing the volcanic cloud, various space-based methods have been proposed to estimate the SO2emission flux. The crudest approach consists in differentiating in time the SO2mass bur-dens retrieved from successive acquisitions [e.g., Krueger et al., 1996; Surono et al., 2012; Lopez et al., 2013]. Unfortunately, this approach only provides estimates of SO2fluxes averaged over 12 to 24 h at best, depend-ing on polar-orbitdepend-ing satellite revisit frequency. In order to reconstruct time series of SO2emission fluxes at
Geophysical Research Letters
10.1002/2014GL059496
higher temporal resolution, it is necessary to exploit the spatial variations of the SO2concentration within the plume. This can be achieved by integrating SO2column densities along a series of transects crossing the volcanic cloud and multiplying by wind speed [e.g., Carn and Bluth, 2003; Merucci et al., 2011; Theys et al., 2013]. However, this method has neither been developed nor has it been tested for operational purposes of volcanic cloud dispersal forecast, probably due to its heuristic nature.To establish more firmly the link between in-cloud spatial heterogeneities of SO2concentration and temporal variability of the volcanic source, an inverse modeling approach is required, whereby satellite observations of the volcanic cloud are coupled with a chemistry-transport model. As demonstrated by
Boichu et al. [2013], such an approach can effectively reconstruct retrospectively SO2flux time series with an hourly temporal resolution, without the need for a priori knowledge on the SO2flux.
Here we focus on the 2010 Eyjafjallajökull eruption to show that this inverse modeling approach provides more robust forecasts of the volcanic SO2cloud spatial extent and mass loading than regular mass-burden methods. When applied progressively to a set of satellite observations of the volcanic cloud acquired at reg-ular time intervals during the course of an eruption, the reconstruction of the source term can be updated to provide refined forecasts for the next 12–36 h.
2. Methodology
The atmospheric evolution of the volcanic cloud is described using the CHIMERE regional Eule-rian chemistry-transport model [Menut et al., 2013; Boichu et al., 2013], driven by Global Forecasting System-Weather Research and Forecasting model reanalysis meteorological fields [Skamarock et al., 2008], with a 25 km × 25 km horizontal grid (for both meteorological and chemistry-transport models) and 18 hybrid sigma-pressure vertical layers extending up to 200 hPa (∼12 km above sea level (asl)). Previous inverse modeling studies have focused on the retrieval of the emission profile with altitude, assuming a con-stant volcanic flux emitted on a short time span [Eckhardt et al., 2008; Kristiansen et al., 2010]. In our study, emission height is constrained by independent observations. SO2emissions are released along a 1 km full width at half maximum semi-Gaussian profile centered at a height of 6 km asl, in agreement with radar and web camera observations of the Eyjafjallajökull plume [Petersen et al., 2012]. As shown by Boichu et al. [2013], removal mechanisms of SO2can be neglected in the early May period of the eruption.
SO2column amount maps were retrieved from measurements of the polar-orbiting Infrared Atmospheric Sounding Interferometer (IASI) sounder, which provides global coverage twice a day (mean overpass times at 09:30 and 21:30 local time) with a pixel size of 12 km at nadir. For simplicity and in the absence of inde-pendent observations, a constant altitude of the volcanic cloud is assumed and fixed to 7 km asl, close to emission height, in the retrieval algorithm. For more details, the reader is referred to Boichu et al. [2013]. Two different emission terms are tested for initializing plume chemistry-transport modeling, consisting in time series of the SO2flux reconstructed until a chosen date t0either by the standard mass-burden method (Method 1) or by a multiple-image inversion scheme (Method 2), both procedures capitalizing on the series of satellite observations acquired until t0. Method 1 consists in differentiating the SO2burdens from two consecutive images of the volcanic cloud to evaluate a mean SO2flux, assuming negligible SO2depletion in the volcanic cloud [e.g., Surono et al., 2012; Lopez et al., 2013; Theys et al., 2013]. Method 2 is an inversion pro-cedure that uses the satellite observations in combination with the chemistry-transport model as a forward model [Boichu et al., 2013]. The inverse problem is solved by determining the time history of the SO2flux that minimizes (in the least squares sense) the misfit between observed and modeled spatial and temporal distributions of SO2within one or several images. Except for a nonnegative constraint, no a priori knowl-edge on the SO2flux is required in this inversion procedure. To tackle numerical diffusion biases, the set of pixels corresponding to a mass load below the detection threshold (null detection) is decimated by a factor 10, and a weak smoothing of the SO2flux solution is applied. Details on this inversion scheme are provided in Boichu et al. [2013].
To demonstrate how the forecast can be progressively updated and improved during the course of the erup-tion, we apply this assimilation procedure to either a single satellite image or sequentially to a set of several successive freshly acquired images, hereafter referred to as “progressive assimilation.” Given a revisit time of IASI less than or equal to ΔT = 12 h at any specific location, forecasts are consequently computed with the same periodicity. In the absence of observations constraining the emissions between t0and the forecast
time t0+ Δt, we assume that the volcano flux Φ(t) proceeds at a constant rate Φt0,𝜏equal to the mean of the reconstructed flux values over a period𝜏 preceding the last detection of the volcanic cloud in the t0image:
∀t ∈ [t0; t0+ Δt], Φ(t) = Φt0,𝜏= 1
𝜏 ∫ t0
t0−𝜏
Φ(t′)dt′ (1)
Here𝜏 has been arbitrarily set to 6 h.
So far, there is no consensus on the choice of a standard metric to quantitatively estimate the agreement between modeled and observed volcanic cloud dispersion. Here the improvement of forecasts achieved by progressive assimilation of satellite observations is assessed using the Earth Mover’s Distance (EMD) metric, which is commonly used in many applications of computer vision including image retrieval and detection of similar features [Rubner et al., 2000; Pele and Werman, 2009; Collins and Ge, 2008]. The EMD quantifies the minimal cost that must be paid to transform one distribution (here the SO2mass loading value for each pixel) into the other. Compared to the simpler root-mean-square error, the EMD is not dominated by biases induced by numerical diffusion issues, which makes it more adapted to rank the similarity between a reference image (the observation) and two candidate images (the output of two different forecasts).
3. Forecast Initialization by Mass Burden Versus Inversion-Derived Flux
After a few days of relative quiescence, early May 2010 corresponds to a phase of renewal of the explosive activity at Eyjafjallajökull volcano [Gudmundsson et al., 2012], which is accompanied by an intense degassing of SO2captured by ultraviolet and infrared satellite sensors [Thomas and Prata, 2011; Carboni et al., 2012; Rix
et al., 2012; Boichu et al., 2013]. Figure 1 illustrates the comparison of simulation maps (centered at the date t0= 7 May 12:00 UTC) and forecast maps (centered at t0+ΔT = 8 May 00:00 UTC) of the Eyjafjallajökull SO2 cloud dispersal. Forecasts are initialized using source terms obtained from Methods 1 and 2 (Figure 1d), both using the IASI observations of the Eyjafjallajökull cloud available before the date t0.
Geographical location and spatial extent of the modeled SO2cloud at t0are in overall agreement with IASI observations, whichever the method applied to determine the source term. The correct location of the modeled SO2cloud, mainly aligned toward Greenland at t0, then also extending toward Spain at t0+ΔT, indicates the robustness of the meteorological field that forces the chemistry-transport model. However, only the forecast initialized using Method 2 is able to correctly reproduce the spatial variability of the SO2 cloud concentration (Figure 1c2). In agreement with IASI observations, three local peaks of SO2are distin-guished and the volcanic cloud is split into essentially two separated parts, whereas the forecast initialized using Method 1 (Figure 1b2) misses completely the dense and elongated peak 2 and predicts a one-piece SO2cloud. The latter method also underestimates the elongation of peak 1 and the mass loading of peak 3. The reason for this poor performance is that the mass-burden method only provides an average representa-tion of the emissions, in the form of a step funcrepresenta-tion (Figure 1d, red line), which smoothes any high-frequency variation of the actual SO2flux. As a consequence, the resulting simulation and forecast cannot reproduce all of the heterogeneities of concentration within the SO2cloud and, most importantly, may miss the parts of the volcanic cloud with the richest SO2mass loadings which are correctly captured by Method 2.
4. SO
2Cloud Dispersal Forecast Improvement by Progressive Assimilation
of Satellite Observations
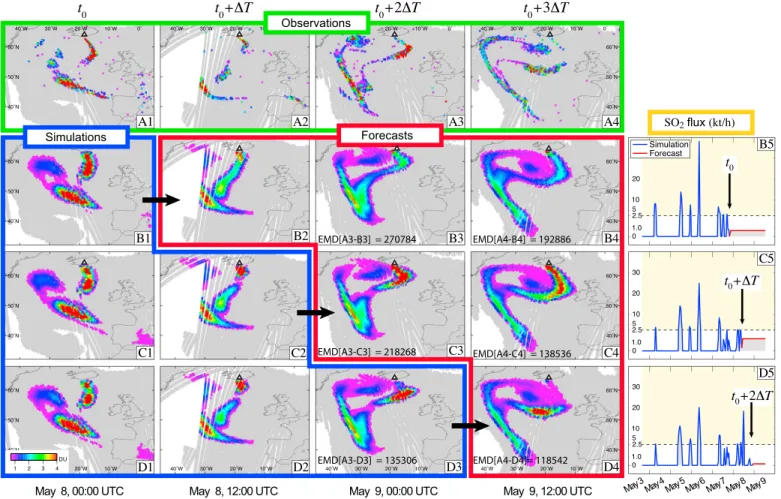
Figures 2 and S1–S5 in the supporting information demonstrate, through the study of 20 forecast cases, how the progressive assimilation of the satellite observations available during the course of an eruption provides a refined (high temporal resolution) estimate of the source term which improves the robust-ness of short-term forecasts. Considering that the first IASI satellite measurement of the Eyjafjallajökull SO2cloud is available at t0(t0= 8 May 00:00 UTC in Figure 2) and that the revisit time of IASI is anywhere less than or equal to ΔT = 12 h, we compute a series of forecasts at t0+ΔT, t0+2ΔT, and t0+3ΔT, initial-ized with the source term reconstructed from the inversion of the single t0image (Figure 2b). This latter single-image-based forecast at t0+3ΔT (Figure 2b4) is then compared with the forecasts initialized with the source term derived from a two-image (i.e., using t0and t0+ΔT images, Figure 2c4) or three-image inver-sions (i.e., using t0, t0+ΔT, and t0+2ΔT images, Figure 2d4). The comparison of these forecasts with actual
Geophysical Research Letters
10.1002/2014GL059496
Figure 1. Forecasts initialized using source terms derived either from the standard mass-burden method (Method 1) or
from the multiple-image inversion scheme (Method 2). (a) IASI satellite retrievals (Dobson unit (DU)) of the Eyjafjallajökull SO2cloud. (b1) Simulation att0(7 May 12:00 UTC) and (b2) forecast att0+ΔT(8 May 00:00 UTC) initialized by the (d) SO2 flux derived from the mass-burden method (red line). (c1) Simulation and (c2) forecast initialized by the SO2flux derived from the inversion scheme (Figure 1d, blue line). Modeled maps are collocated (in time and space) with IASI observations acquired over a 12 h window centered at the timet0ort0+ΔT. Regions in grey indicate column amounts less than 0.7 DU (detection threshold in IASI processing). Black triangle indicates Eyjafjallajökull volcano. Note the change in vertical scale in Figure 1d for flux>2.5 kt h−1.
Figure 2. Forecast improvement by progressive assimilation of SO2cloud satellite observations. (a) IASI SO2observations (green) acquired during the course of the Eyjafjallajökull eruption. Simulation (blue) or forecast (red) maps of the SO2cloud dispersal at (1) t0(8 May 00:00 UTC), (2)t0+ΔT, (3)t0+2ΔT,and (4)t0+3ΔT (ΔT= 12 h). Simulations and forecasts are initialized using SO2flux time series derived from the inversion of (b) the single t0image; (c) t0and (t0+ΔT) images; and (d) t0, (t0+ΔT), and (t0+2ΔT) images. Corresponding SO2flux time series are shown on the right (note the change in vertical scaling above 2.5 kt h−1). Earth
Mover’s Distance (EMD) between forecast and satellite retrievals at a given date are indicated. For comparison, EMD between a map filled with zero values and satellite data att0+2ΔTandt0+3ΔTare drastically higher (equal to 690,000 and 498,000, respectively).
IASI observations made at t0+3ΔT (Figure 2a4) shows that the source derived from the three-image inver-sion provides the best forecast, as illustrated by the lowest EMD value indicative of strongest similarity (Figure 2d4). This best forecast is the only one that reproduces correctly the spatial variations of SO2 con-centration in the Eyjafjallajökull cloud and, most importantly, that successfully identifies the location and extent of the densest SO2part of the volcanic cloud. This most SO2-concentrated zone is less well positioned with the sources derived from the one- or two-image inversions (Figures 2b4 and 2c4). An improvement of ∼ 40%, in terms of similarity or EMD decrease, is achieved relative to the single-image-based forecast. Following the same rationale, the source derived from the two-image inversion provides the forecast (Figure 2c3) which best matches observations at t0+2ΔT (Figure 2a3), as confirmed by an EMD value weaker by ∼ 20% relative to the single-image-based forecast (Figure 2b3). Additional time series in Figures S1–S5 illustrate the systematic improvement of forecasts (one case excepted) by assimilation of the last acquired image, which is corroborated by a consistent decrease of EMD between 5 and 43% relatively to forecasts derived from single-image inversion.
5. Discussion
The inversion procedure introduces a feedback loop between satellite observations of the volcanic cloud and the atmospheric chemistry-transport model. As demonstrated in the above analysis, this procedure leads to a significant improvement of the temporal resolution on the source term and a consequent improvement in the spatial accuracy of the SO2cloud dispersal forecasts. Furthermore, this approach is more
Geophysical Research Letters
10.1002/2014GL059496
robust than the standard mass-burden procedure, in the sense that it has a lower tendency to map errors in the observations or the modeling scheme into errors in the forecast.For instance, forecasts initialized with both mass-burden and inversion-derived source methods suffer from numerical diffusion issues that are inherent to Eulerian chemistry-transport models [Freitas et al., 2012; Boichu et al., 2013]. This results in an overestimation of the SO2dispersion that increases as the vol-canic cloud gets older and travels farther from its source (Figure 1). This modeling bias inevitably leads to an underestimation of the modeled SO2cloud mass loading and an overestimation of the SO2 spread-ing (Figure 1). Nevertheless, the image inversion procedure allows for partly counterbalancspread-ing this bias by boosting the amplitude of the reconstructed SO2flux, which therefore attenuates SO2cloud mass loading underestimation, in order to achieve a better fit to satellite retrievals.
Another advantage of the multiple-image inversion procedure is that it is robust against gaps in satellite retrievals, which often occur due to interruptions in satellite data transmission (as illustrated in Figure 2a2) or because of the presence of thick meteorological clouds absorbing infrared radiation and masking any underlying SO2. Whereas such data gaps inevitably lead to a (potentially significant) underestimation of emission rates with the mass-burden method, their impact is mitigated using the multiple-image inversion procedure which incorporates redundant observations of the same parcel of SO2at different ages, in cloudy but also in noncloudy scenes.
Emission height impacts the volcanic cloud trajectory but also SO2lifetime. When little wind shear is recorded throughout the full plume, as during the May 2010 Eyjafjallajökull eruption, SO2cloud dispersal simulations are weakly dependent on the uncertainty on emission height [Boichu et al., 2013; Flemming
and Inness, 2013]. However, in case of significant wind shear, assuming an inaccurate plume top height may
lead to dramatic errors on SO2cloud dispersal forecasts. Fortunately, in such cases, emission height can be estimated from back trajectory analysis [Eckhardt et al., 2008; Kristiansen et al., 2010; Hughes et al., 2012]. Introducing the emission altitude as an additional source parameter to reconstruct in our inverse modeling scheme would be straightforward. However, this would lead to a significant increase of the computational time for two reasons. First, a supplementary degree of freedom has to be introduced in the inversion pro-cedure, thereby increasing the number of linear equations involved in the inverse problem. Moreover, a refinement of the vertical grid spacing in the chemistry-transport model would be required to fully capture the vertical dynamics of the plume.
Applied to SO2volcanic clouds, the assimilation scheme presented here could be extended to the moni-toring of ash-rich clouds. This low-cost procedure, which strengthens feedback between observations and model, could be automated for operational application, so as to provide better-resolved forecasts of volcanic cloud dispersal.
References
Boichu, M., L. Menut, D. Khvorostyanov, L. Clarisse, C. Clerbaux, S. Turquety, and P.-F. Coheur (2013), Inverting for volcanic SO2flux at
high temporal resolution using spaceborne plume imagery and chemistry-transport modelling: The 2010 Eyjafjallajökull eruption case study, Atmosph. Chem. Phys., 13(17), 8569–8584, doi:10.5194/acp-13-8569-2013.
Bonadonna, C., A. Folch, S. Loughlin, and H. Puempel (2012), Future developments in modelling and monitoring of volcanic ash clouds: Outcomes from the first IAVCEI-WMO workshop on Ash Dispersal Forecast and Civil Aviation, Bull. Volcanol., 74, 1–10, doi:10.1007/s00445-011-0508-6.
Carboni, E., R. Grainger, J. Walker, A. Dudhia, and R. Siddans (2012), A new scheme for sulphur dioxide retrieval from IASI measurements: Application to the Eyjafjallajökull eruption of April and May 2010, Atmosph. Chem. Phys., 12(23), 11,417–11,434.
Carn, S., A. Krueger, N. Krotkov, K. Yang, and K. Evans (2009), Tracking volcanic sulfur dioxide clouds for aviation hazard mitigation, Nat.
Hazards, 51, 325–343, doi:10.1007/s11069-008-9228-4.
Carn, S. A., and G. J. S. Bluth (2003), Prodigious sulfur dioxide emissions from Nyamuragira volcano, DR Congo, Geophys. Res. Lett., 30(23), 2211, doi:10.1029/2003GL018465.
Collins, R. T., and W. Ge (2008), CSDD features: Center-Surround Distribution Distance for feature extraction and matching, in ECCV ’08
Proceedings of the 10th European Conference on Computer Vision: Part III, pp. 140–153, Springer-Verlag, Berlin, Heidelberg.
Eckhardt, S., A. J. Prata, P. Seibert, K. Stebel, and A. Stohl (2008), Estimation of the vertical profile of sulfur dioxide injection into the atmosphere by a volcanic eruption using satellite column measurements and inverse transport modeling, Atmosph. Chem. Phys., 8, 3881–3897.
Flemming, J., and A. Inness (2013), Volcanic sulfur dioxide plume forecasts based on UV satellite retrievals for the 2011 Grimsvötn and the 2010 Eyjafjallajökull eruption, J. Geophys. Res. Atmos., 118, 10,172–10,189, doi:10.1002/jgrd.50753.
Freitas, S., L. F. Rodrigues, K. M. Longo, and J. Panetta (2012), Impact of a monotonic advection scheme with low numerical diffusion on transport modeling of emissions from biomass burning, J. Adv. Model. Earth Syst., 4, M01001, doi:10.1029/2011MS000084.
Gudmundsson, M., et al. (2012), Ash generation and distribution from the April–May 2010 eruption of Eyjafjallajökull, Iceland, Sci. Rep., 2, 572, doi:10.1038/srep00572.
Acknowledgments
M. Boichu and D. Khvorostyanov grate-fully acknowledge support from the French ANR-funded CHEDAR project. IASI has been developed and built under the responsibility of the Cen-tre National d’Etudes Spatiales (CNES, France). It is flown on board the Metop satellites as part of the EUMET-SAT Polar System. The IASI L1 data are received through the EUMET-Cast near-real-time data distribution service. L. Clarisse is a postdoctoral researcher (Chargé de Recherches) with F.R.S.-FNRS. C. Clerbaux is grate-ful to CNES for scientific collaboration and financial support. The research in Belgium was funded by the F.R.S.-FNRS (M.I.S. nF.4511.08), the Belgian State Federal Office for Scientific, Technical and Cultural Affairs, and the European Space Agency (ESA-Prodex arrange-ments and the Support to Aviation Control Service (SACS2) project). The authors acknowledge the two anony-mous reviewers for their insightful reviews which helped to improve the quality of the manuscript.
The Editor thanks Larry Mastin and Peter Webley for their assistance in evaluating this paper.
Haywood, J. M., et al. (2010), Observations of the eruption of the Sarychev volcano and simulations using the HadGEM2 climate model,
J. Geophys. Res., 115, D21212, doi:10.1029/2010JD014447.
Heard, I. P. C., A. J. Manning, J. M. Haywood, C. Witham, A. Redington, A. Jones, L. Clarisse, and A. Bourassa (2012), A comparison of atmospheric dispersion model predictions with observations of SO2and sulphate aerosol from volcanic eruptions, J. Geophys. Res.,
117, D00U22, doi:10.1029/2011JD016791.
Hughes, E., L. Sparling, S. Carn, and A. Krueger (2012), Using horizontal transport characteristics to infer an emission height time series of volcanic SO2, J. Geophys. Res., 117, D18307, doi:10.1029/2012JD017957.
Kristiansen, N., et al. (2010), Remote sensing and inverse transport modeling of the Kasatochi eruption sulfur dioxide cloud, J. Geophys.
Res., 115, D00L16, doi:10.1029/2009JD013286.
Krueger, A., C. Schnetzler, and L. Walter (1996), The December 1981 eruption of Nyamuragira volcano (Zaire), and the origin of the “mystery cloud” of early 1982, J. Geophys. Res., 101(D10), 15,191–15,196.
Lopez, T., S. Carn, C. Werner, D. Fee, P. Kelly, M. Doukas, M. Pfeffer, P. Webley, C. Cahill, and D. Schneider (2013), Evaluation of Redoubt Volcano’s sulfur dioxide emissions by the Ozone Monitoring Instrument, J. Volcanol. Geoth. Res., 259, 290–307, doi:10.1016/j.jvolgeores.2012.03.002.
Marzocchi, W., C. Newhall, and G. Woo (2012), The scientific management of volcanic crises, J. Volcanol. Geoth. Res., 181–189. Menut, L., et al. (2013), Regional atmospheric composition modeling with CHIMERE, Geosci. Model Dev., 6, 981–1028,
doi:10.5194/gmd-6-981-2013.
Merucci, L., M. Burton, S. Corradini, and G. G. Salerno (2011), Reconstruction of SO2flux emission chronology from space-based measurements, J. Volcanol. Geoth. Res., 206, 80–87, doi:10.1016/j.jvolgeores.2011.07.002.
Pele, O., and M. Werman (2009), Fast and robust Earth Mover’s Distances, in IEEE 12th International Conference on Computer Vision, pp. 460–467, IEEE, Kyoto, Japan.
Petersen, G. N., H. Bjornsson, and P. Arasonl (2012), The impact of the atmosphere on the Eyjafjallajökull 2010 eruption plume, J. Geophys.
Res., 117, D00U07, doi:10.1029/2011JD016762.
Prata, A. (2009), Satellite detection of hazardous volcanic clouds and the risk to global air traffic, Nat. Hazards, 51, 303–324, doi:10.1007/s11069-008-9273-z.
Prata, A. J., and J. Kerkmann (2007), Simultaneous retrieval of volcanic ash and SO2using MSG-SEVIRI measurements, Geophys. Res. Lett.,
34, L05813, doi:10.1029/2006GL028691.
Rix, M., P. Valks, N. Hao, D. Loyola, H. Schlager, H. Huntrieser, J. Flemming, U. Koehler, U. Schumann, and A. Inness (2012), Volcanic SO2, BrO and plume height estimations using GOME-2 satellite measurements during the eruption of Eyjafjallajökull in May 2010,
J. Geophys. Res., 117, D00U19, doi:10.1029/2011JD016718.
Rubner, Y., C. Tomasi, and L. J. Guibas (2000), The Earth Mover’s Distance as a metric for image retrieval, Int. J. Comput. Vision, 40(2), 99–121.
Schneider, D. J., W. I. Rose, L. R. Coke, G. J. Bluth, I. E. Sprod, and A. J. Krueger (1999), Early evolution of a stratospheric volcanic eruption cloud as observed with TOMS and AVHRR, J. Geophys. Res., 104(D4), 4037–4050.
Sears, T., G. Thomas, E. Carboni, A. Smith, and R. Grainger (2013), SO2as a possible proxy for volcanic ash in aviation hazard avoidance,
J. Geophys. Res. Atmos., 118, 1–12, doi:10.1002/jgrd.50505.
Skamarock, J., W. Klemp, J. Dudhia, D. Gill, D. Barker, M. Duda, X. Huang, W. Wang, and J. Powers (2008), A description of the advanced research WRF version 3, Tech. Note NCAR/TN–475+ STR., Natl. Cent. for Atmos. Res., Boulder, Colo.
Stohl, A., et al. (2011), Determination of time- and height-resolved volcanic ash emissions and their use for quantitative ash dispersion modeling: The 2010 Eyjafjallajökull eruption, Atmosph. Chem. Phys., 11, 4333–4351, doi:10.5194/acp-11-4333-2011.
Surono, J. P., et al. (2012), The 2010 explosive eruption of Java’s Merapi volcano—A “100-year” event, J. Volcanol. Geoth. Res., 241-242, 121–135, doi:10.1016/j.jvolgeores.2012.06.018.
Theys, N., et al. (2013), Volcanic SO2fluxes derived from satellite data: A survey using OMI, GOME-2, IASI and MODIS, Atmos. Chem. Phys.,
13(12), 5945–5968, doi:10.5194/acp-13-5945-2013.
Thomas, H. E., and A. J. Prata (2011), Sulphur dioxide as a volcanic ash proxy during the April–May 2010 eruption of Eyjafjallajökull Volcano, Iceland, Atmos. Chem. Phys., 11, 6871–6880, doi:10.5194/acp-11-6871-2011.
Webley, P., and L. Mastin (2009), Improved prediction and tracking of volcanic ash clouds, J. Volcanol. Geoth. Res., 186, 1–9, doi:10.1016/j.jvolgeores.2008.10.022.