HAL Id: hal-00318064
https://hal.archives-ouvertes.fr/hal-00318064
Submitted on 3 Jul 2006
HAL is a multi-disciplinary open access
archive for the deposit and dissemination of
sci-entific research documents, whether they are
pub-lished or not. The documents may come from
teaching and research institutions in France or
abroad, or from public or private research centers.
L’archive ouverte pluridisciplinaire HAL, est
destinée au dépôt et à la diffusion de documents
scientifiques de niveau recherche, publiés ou non,
émanant des établissements d’enseignement et de
recherche français ou étrangers, des laboratoires
publics ou privés.
electrodynamics and bottom-type scattering layers at
the onset of equatorial spread F
D. L. Hysell, M. F. Larsen, C. M. Swenson, A. Barjatya, T. F. Wheeler, T. W.
Bullett, M. F. Sarango, R. F. Woodman, J. L. Chau, D. Sponseller
To cite this version:
D. L. Hysell, M. F. Larsen, C. M. Swenson, A. Barjatya, T. F. Wheeler, et al.. Rocket and radar
investigation of background electrodynamics and bottom-type scattering layers at the onset of
equa-torial spread F. Annales Geophysicae, European Geosciences Union, 2006, 24 (5), pp.1387-1400.
�hal-00318064�
Ann. Geophys., 24, 1387–1400, 2006 www.ann-geophys.net/24/1387/2006/ © European Geosciences Union 2006
Annales
Geophysicae
Rocket and radar investigation of background electrodynamics and
bottom-type scattering layers at the onset of equatorial spread F
D. L. Hysell1, M. F. Larsen1, C. M. Swenson3, A. Barjatya3, T. F. Wheeler4, T. W. Bullett5, M. F. Sarango6, R. F. Woodman6, J. L. Chau6, and D. Sponseller7
1Earth and Atmospheric Science, Cornell University, Ithaca, New York, USA 2Physics and Astronomy, Clemson University, Clemson, South Carolina, USA 3Electrical and Computer Engineering, Utah State University, Logan, Utah, USA
4Electrical Engineering, Pennsylvania State University, University Park, Pennsylvania, USA 5Space Vehicles Directorate, Air Force Research Laboratory, Hanscom AFB, Massachusetts, USA 6Jicamarca Radio Observatory, Instituto Geof´ısico del Per´u, Lima, Peru
7Kwajalein Range Services LLC., ALTAIR Radar, United States Army Kwajalein Atoll – Reagan Test Site, Republic of the
Marshall Islands, USA
Received: 2 August 2005 – Revised: 13 January 2006 – Accepted: 21 April 2006 – Published: 3 July 2006 Part of Special Issue “The 11th International Symposium on Equatorial Aeronomy (ISEA-11), Taipei, May 2005”
Abstract. Sounding rocket experiments were conducted dur-ing the NASA EQUIS II campaign on Kwajalein Atoll de-signed to elucidate the electrodynamics and layer structure of the postsunset equatorial F region ionosphere prior to the onset of equatorial spread F (ESF). Experiments took place on 7 and 15 August 2004, each comprised of the launch of an instrumented and two chemical release sounding rockets. The instrumented rockets measured plasma number density, vector electric fields, and other parameters to an apogee of about 450 km. The chemical release rockets deployed trails of trimethyl aluminum (TMA) which yielded wind profile measurements. The Altair radar was used to monitor coher-ent and incohercoher-ent scatter in UHF and VHF bands. Elec-tron density profiles were also measured with rocket beacons and an ionosonde. Strong plasma shear flow was evident in both experiments. Bottom-type scattering layers were ob-served mainly in the valley region, below the shear nodes, in westward-drifting plasma strata. The layers were likely pro-duced by wind-driven interchange instabilities as proposed by Kudeki and Bhattacharyya (1999). In both experiments, the layers were patchy and distributed periodically in space. Their horizontal structure was similar to that of the large-scale plasma depletions that formed later at higher altitude during ESF conditions. We argue that the bottom-type layers Correspondence to: D. L. Hysell
(dlh37@cornell.edu)
were modulated by the same large-scale waves that seeded the ESF. A scenario where the large-scale waves were them-selves produced by collisional shear instabilities is described.
Keywords. Ionosphere (Equatorial ionosphere; Ionospheric irregularities; Plasma waves and instabilities)
1 Introduction
This manuscript describes a NASA sounding rocket inves-tigation into the electrodynamics of the postsunset equato-rial F region ionosphere and the bearing this has on the thin “bottom-type” scattering layers that form there. Coherent scatter from such layers has been observed at the Jicamarca Radio Observatory in Peru for many years and generally oc-curs as a preoc-cursor to more fully developed equatorial spread F (ESF) (Woodman and La Hoz, 1976; Hysell and Burcham, 1998; Kudeki and Bhattacharyya, 1999). The layers have not been investigated with sounding rockets before and are dif-ficult to study with satellites, being typically no more than 50 km thick and residing at altitudes below 400 km and as low as 200 km during solar minimum. We study them and the environment in which they reside to understand their rela-tionship to ESF and the communications and navigation sys-tems outages that result.
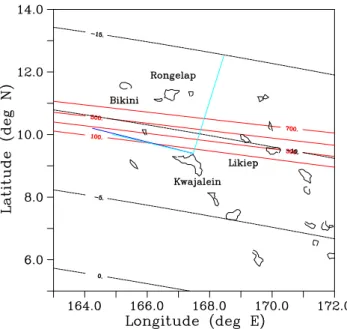
Fig. 1. Experiment geometry. The instrumented and chemical
re-lease rocket trajectories are shown, respectively, by the blue and cyan lines radiating from Roi Namur at the northern tip of Kwa-jalein Atoll. Solid red contours represent the altitude in kilometers for field aligned backscatter from the Altair radar on Roi Namur. Dashed contours indicate the geomagnetic dip angle in degrees.
The investigation was carried out in August 2004, as part of the NASA EQUIS II campaign from Kwajalein Atoll in the Marshall Islands using a combination of sounding rockets and with the support of the Altair VHF/UHF radar, which functioned both in coherent and incoherent scatter mode (Tsunoda et al., 1979; Close et al., 2002). Two sets of launches took place on separate nights from the Roi Namur range at the northern tip of the atoll. Each set consisted of an instrumented payload launched north-westward and two chemical release payloads, one launched along nearly the same azimuth as the instrumented payload, and the other launched to the northeast. The instrumented payloads mea-sured plasma density, electron temperature, electron colli-sion frequency, and electric field profiles to an altitude of about 450 km while the chemical release payloads permit-ted the measurement of neutral wind profiles at three distinct locations up to about 200 km altitude though photographing and triangulation of chemiluminiscent trimethyl aluminum (TMA) trails (Larsen and Odom, 1997). In addition, the chemical release payloads were outfitted with dual frequency beacons. In a horizontally stratified ionosphere, electron den-sity profiles can be inferred from beacon signals received on the ground (on Roi Namur) using an inversion algorithm. Figure 1 shows a plan view of the experiments.
The Air Force Research Laboratory (AFRL) Space Weather Center of Excellence also installed a Digisonde Portable Sounder (DPS-4) on Roi-Namur to support all EQ-UIS II launches. The ionosonde was operating by 30 June
2004, with modes adjusted and system performance opti-mized through the first two weeks of July. The system made ionograms every 5 min throughout the campaign, providing a general overview of ionosphere conditions, critical frequency measurements, and derived electron density profile measure-ments.
The objectives of the investigation were to 1) understand and quantify vertical shear in the horizontal plasma drift in the bottomside F region around sunset, 2) identify the mech-anism producing the bottom-type scattering layers that form in westward-drifting strata and establish their relationship to ESF, and 3) assess the influence of shear flow on the overall stability of the postsunset equatorial F region. The remain-der of the manuscript summarizes the preliminary findings of the investigation based on data from the instrumented rock-ets, the Altair radar, and the ionosonde.
2 Observations
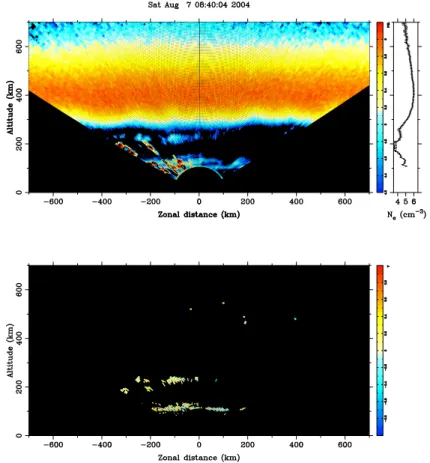
The first experiment was conducted on 7 August 2004 fol-lowing the appearance of F region coherent scatter in the Altair radar scans at about 19:30 SLT. Figure 2 shows UHF (422 MHz) radar data for a west-to-east scan lasting precisely 8 min. and ending at 08:40 UT. Note that SLT ≈ UT + 11 h on Kwajalein. Local sunset occurred at about 07:10 UT in early August, and E region sunset about 40 min later. For this scan, the radar pointing was programmed so that the main beam of the antenna was directed perpendicular to the geo-magnetic field at F region altitudes at all times. A 300 µs, 3-bit coded pulse was transmitted. The received signal was decoded, noise corrected, range corrected, and converted to electron density estimates using a calibrated system constant (Bowles et al., 1962). No further corrections are required at night when the electrons and ions are in thermal equilibrium. Peak electron densities thus calculated from Altair radar data compare well with estimates derived from the ionosonde as well as with in situ data from the sounding rockets in a com-mon volume.
Figure 2 exemplifies a number of features common to the ten nights of observations falling between 3–15 August that constituted our experiments. There is a tilt in the postsunset F region arising from the local time variation across the radar field of view that persists until about 20:00 SLT. Note that the tilt is oriented so as to be unstable to eastward wind-driven interchange instabilities (Kudeki and Bhattacharyya, 1999). In addition, large-scale waves (with a predominant wave-length of about 200 km in this case) were also frequently ob-served in the bottomside. Such waves were visible among the first of the radar scans, starting at about 18:40 SLT each evening, on every night when spread F eventually occurred.
Figure 2 also shows strong coherent backscatter from a sporadic E layer (Es) at about 105 km altitude. Spo-radic E layers occurred regularly at sunset but tended to break up and vanish as the evenings progressed. The Es
D. L. Hysell et al.: Rocket investigation of equatorial spread F 1389
Fig. 2. Altair radar perpendicular scan for 7 August 2004, 08:40 UT. Top panel: backscatter power, range corrected and scaled to electron
density on a logarithmic scale. Top right panel: electron density for beam position closest to zenith. Bottom panel: Coherent scatter Doppler velocity on a color scale spanning ± 890 m/s. In this panel, blue (red) tones denote blue shifts (red shifts).
developed here around 04:00 UT and persisted until local midnight. It became particularly intense between 06:30 UT and 09:30 UT, with blanketing Es frequencies (fbEs) some-times exceeding 6 MHz and critical frequencies (foEs) ex-ceeding 15 MHz. The presence of sporadic E severely lim-ited our ability to determine minimum F layer heights and bottomside electron density profiles from ionograms, but ac-curate foF2 estimates were still obtainable (see Fig. 3), and it was clear that the F layer was rising prior to the rocket flight. Note that strong coherent echoes are plotted in Fig. 2 us-ing a different color scale when they exceed a certain SNR threshold; this and the presence of range sidelobes due to coding tend to obscure the sporadic E layer in Fig. 2, al-though the layer is clear and distinct in scans performed earlier with finer range resolution. Those observations are plotted in Fig. 4, which shows the echoes recorded both at UHF and VHF (158 MHz) frequencies. Whereas the UHF signals are a combination of coherent and incoherent scatter, the VHF signals are purely coherent scatter. The latter are plotted here on a signal-to-noise ratio scale. The former are scaled and plotted to electron densities, which is appropriate for incoherent scatter but not for the coherent scatter, which is presumably co-located with the VHF echoes. The layer
ap-pears to be continuous but highly structured and is reminis-cent of those observed and documented by Miller and Smith (1975, 1978) at Arecibo. Layer densities increase from west to east, and double layers are evident at some azimuths. Den-sity profiles recovered from the beacons on both the chemical release rockets also indicated strong sporadic E layers during the experiment, with a double layer observed on the beacon launched to the northeast.
Finally and most relevant to this investigation, Fig. 2 shows a bottom-type scattering layer between 200–250 km altitude and mainly to the west of the radar. Layers like this appeared before other irregular features in the Altair scans and were consistently our first indication that the ionosphere was active. Coherent scatter from this layer was relatively weak — weaker than the incoherent scatter from 300 km al-titude, for example. We know that it was coherent scatter because the correlation time of the echoes was very long. The lower panel of Fig. 2 represents the Doppler shift de-rived from the 200 µs lag product computed from the radar echoes prior to decoding. Values are plotted only when the coherence exceeds a certain threshold. The bottom-type lay-ers exhibited small negative Doppler shifts, implying a com-bination of upward and westward drifts perpendicular to B,
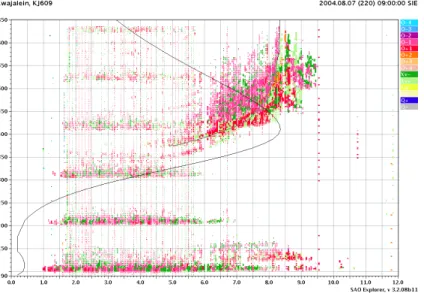
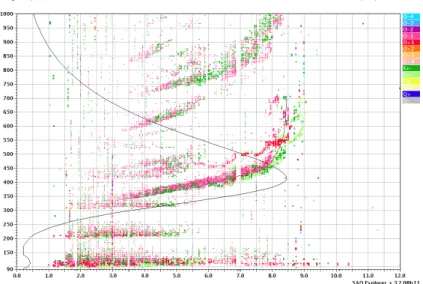
Fig. 3. Kwajalein ionogram from 7 August 2004, 09:00 UT. The vertical axis is range delay in km, and the horizontal axis is plasma frequency
in MHz. Ordinary and extraordinary mode echoes are shown in red and green. The virtual height trace and derived electron density profile are shown as black lines. Intense sporadic E layers mask the F layer below 5 MHz. The F layer peak is visible and shows signs of both range and frequency type spread developing. Multiple colors in the spread trace represent a wide range of observed Doppler shifts.
Fig. 4. Altair radar scans of the sporadic E layer in the plane perpendicular to B. The upper and lower panels show UHF data taken with an
D. L. Hysell et al.: Rocket investigation of equatorial spread F 1391
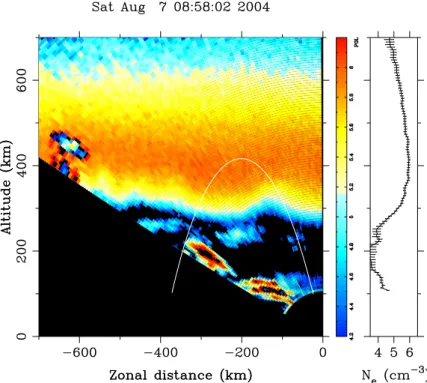
Fig. 5. Altair radar perpendicular scan for 7 August 2004, 08:58 UT. The white arc represents the location of the instrument payload, mapped
along geomagnetic field lines to the plane perpendicular to B scanned by the radar. Echoes between 150–200 km apparent altitude are due to tropospheric clutter.
depending on the zenith angle. As was generally the case, the layer was patchy rather than continuous.
Rocket launches into this event began with the launch of the instrumented rocket (Terrier Malemute 29.036) at 08:52:56 UT, followed by the launch of the two chemical release rockets (Terrier Orions 41.043 and 41.045). Figure 5 depicts the ionosphere during the time of the instrumented rocket flight. In the time elapsed from the previous scan, the large-scale wave amplitude increased, and the bottom-type layer began to dissipate. The distance between the two most distinct crests of the large-scale wave can be seen to be about 200 km, about the same as the distance between the bottom-type layer patches. The arc in Fig. 5 represents one way of comparing radar and rocket data. It traces the trajectory of the rocket, mapped along geomagnetic field lines to the plane perpendicular to B scanned by the radar. This mapping is most appropriate for comparing irregularities in the two datasets. The arc suggests that the rocket passed through a weak patch of irregularities on its upleg between 200–250 km altitude and may have done so again on the downleg between 225–275 km. The figure also shows a well-developed deple-tion drifting into the radar field of view from the west.
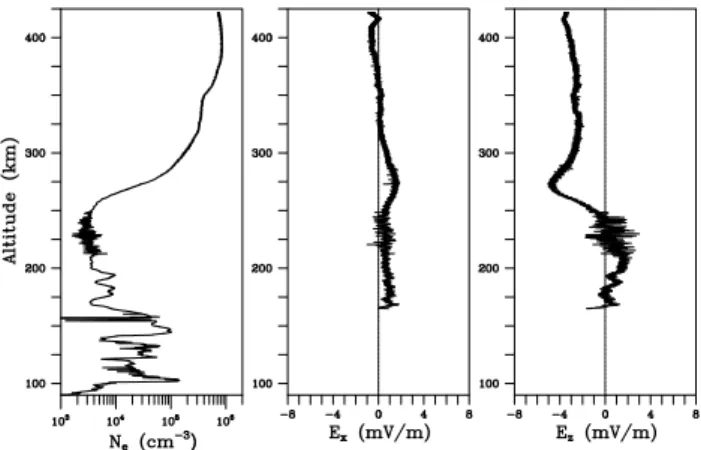
Figure 6 shows upleg data from the 7 August rocket exper-iment. The electron densities were derived by the Utah State University (USU) Swept Langmuir Probe, and the vector electric fields from the Penn State University (PSU) E-field experiment. The density profiles, normalized to the USU
Plasma Impedance Probe for absolute calibration, suggest a postsunset F region ionosphere with a steep bottomside den-sity gradient and a kink in the denden-sity at 350 km associated with the upwelling seen in Fig. 5. A strong sporadic E layer is evident in the density profile, as are additional layers in the valley that may be termed intermediate layers. The zonal electric field was relatively small throughout the upleg except around 275 km where the vehicle entered the upwelling. The tendency for vertical plasma drifts in the postsunset F region to show structure, with ascent rates peaking in the bottom-side, is a feature routinely observed at Jicamarca and asso-ciated with the demands of incompressible flow in a layer with zonal gradients in the zonal plasma drifts (Pingree and Fejer, 1987). The 1.5 mV/m field implies ascent at the rate of 50 m/s. Finally, the vertical electric field profile is indica-tive of strong shear flow, with the ionospheric plasma mov-ing eastward at up to 190 m/s above 250 km and westward at up to 50 m/s below 250 km. A rapid eastward plasma jet at 275 km is co-located with the upwelling and presumably associated with the electric field of the growing large-scale wave.
All of the profiles demonstrate that the payload intercepted intermediate- and small-scale bottom-type plasma irregular-ities in the interval between 200–250 km altitude. The ir-regularities existed in the rarefied valley region, where the density profile was nearly flat, rather than the steep bottom-side, where Rayleigh-Taylor type instabilities are expected
Fig. 6. Upleg data from the 7 August rocket flight. Left panel:
electron density. Center panel: zonal electric field. Right panel: vertical electric field.
Fig. 7. Downleg data from the 7 August rocket flight. Left panel:
electron density. Center panel: zonal electric field. Right panel: vertical electric field.
to occur. While the relative RMS density fluctuations were significant, of the order of 50%, the absolute density fluctu-ations were consequently small. Moreover, the irregularities were confined to the westward-drifting strata below the shear node. Finally, the irregularities were anisotropic, with the vertical electric field components being significantly stronger than the zonal field components.
The downleg data shown in Fig. 7 are substantially simi-lar to the upleg data. The steep bottomside F region density gradient along with layers in the valley and E region remain present. The zonal electric field profile shows that the ve-hicle flew through a region of downwelling above 300 km. Strong shear flow is again present, with the shear node falling at about 280 km. Plasma irregularities were encountered be-tween 225–275 km altitude, although these were weaker than the upleg irregularities in both relative and absolute senses.
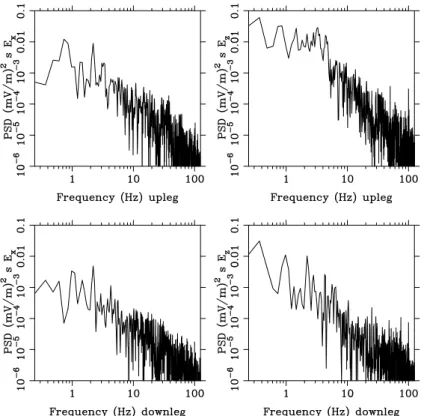
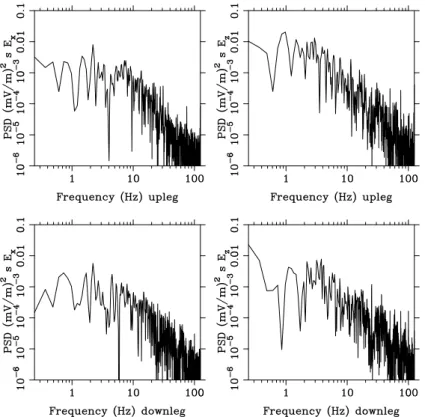
Figure 8 shows the power spectra of the zonal and vertical electric fields measured in the bottom-type layers intercepted on the upleg and downleg. The spectra seem roughly to obey
power laws at high frequencies and are clearly anisotropic, with the vertical field fluctuations at the largest (kilometric) scales (i.e., lower frequencies) being significantly stronger than the zonal field components.
Figure 9 shows an Altair radar UHF scan conducted ap-proximately one hour after the rocket launches. This one used a 300 µs uncoded long pulse and was made with the radar beam directed 5◦ off perpendicular so that only inco-herent scatter was received. The scan shows the state of the topside depletions from Fig. 5 by the time they drifted nearly overhead. The depletions are tilted steeply westward and show evidence of bifurcation. There is considerable fine structure on the depletions superimposed on a dominant 200 km wavelength undulation. The patchy bottom-type lay-ers and the large-scale waves from the earliest Altair scans seem therefore to have shared the horizontal scale size of the ESF that followed.
The second group of rockets was launched on 15 August. The conditions that initiated the experiment are depicted in Fig. 10. The ionosphere was tilted and already populated by large-scale irregularities to the east. Strong sporadic E layer echoes were also present. Most importantly, a strong bottom-type scattering layer had formed directly overhead. The layer was patchy rather than continuous and displayed regular, 30 km spacing between patches. Doppler informa-tion shows that the topside depleinforma-tion was ascending rapidly and that the layer was drifting slowly upward and/or west-ward.
The Es conditions leading up to the second launch were far less severe than for the first, affording the ionosonde much better bottomside F layer electron density profiles (see Fig. 11). Blanketing Es frequencies were typically below 3 MHz, although foEs reached 10 MHz during the second in-strumented rocket flight. The F layer heights rose contin-uously from 06:30 to 08:15 UT. The ionogram F trace be-gan to show disturbances at 07:45 UT, significant bifurca-tion at 08:00 UT, and distinct multiple traces at the F layer peak by 08:15 UT. By 08:30 UT, there would be signifi-cant frequency-type spread of the entire F layer which would developed into range-type spread by 08:45 UT. Range-type spread would continue until 13:30 UT.
Within 10 min of the acquisition of Fig. 10, the bottom-type layer expanded horizontally and became somewhat stronger while the bottomside just above it began to ex-hibit large-scale structure. An instrumented rocket (29.037) was launched at 08:21:53 UT, followed shortly thereafter by chemical release rockets (41.044 and 41.046). The trajec-tory of the instrumented rocket, mapped along magnetic field lines to the most closely related Altair scan, is highlighted in Fig. 12. This figure suggests that the rocket intercepted bottom-type layer patches on the upleg at about 250–300 km altitude and on the downleg at somewhat lower altitude.
Upleg rocket measurements are shown in Fig. 13, where the presence of irregularities is evident between about 240– 300 km altitude. These irregularities were qualitatively
D. L. Hysell et al.: Rocket investigation of equatorial spread F 1393
Fig. 8. Power spectra of the bottom-type layer electric fields measured on 7 August 2004. A frequency of 1 Hz corresponds roughly to a
wavelength of 1.8 km.
Fig. 9. Altair radar oblique scan for 7 August 2004, 09:52 UT.
different from the ones encountered in the first experiment, existing both in the valley and the bottomside and demon-strating a greater degree of isotropy in their electric fields. Their relative RMS amplitude was smaller, but because the
background density was an order of magnitude greater than before, the absolute density fluctuations were stronger. This is consistent with the detection of stronger coherent scatter from these layers.
Fig. 10. Altair radar perpendicular scan for 15 August 2004, 08:13 UT.
Fig. 11. Kwajalein ionogram from 15 August 2004, 08:15 UT. The F layer trace is extensively bifurcated and clearly a separate or secondary
trace. The brighter red color of the second trace is indication of positive Doppler shift, distinctly different from the consistently negative Doppler shift of the primary trace.
These irregularities moreover resided in a slowly ascend-ing ionospheric layer that spanned the vertical shear node, occupying both eastward- and westward-drifting strata. The vertical electric field profile appears to be highly distorted,
having jets moving eastward and westward with respect to the plasma at the F peak at altitudes just below and above 300 km, respectively. We attribute this as well as the kinks in plasma density to the large-scale wave forming in the region.
D. L. Hysell et al.: Rocket investigation of equatorial spread F 1395
Fig. 12. Altair radar perpendicular scan for 15 August 2004, 08:24 UT. The white arc represents the location of the instrument payload,
mapped along geomagnetic field lines to the plane perpendicular to B scanned by the radar.
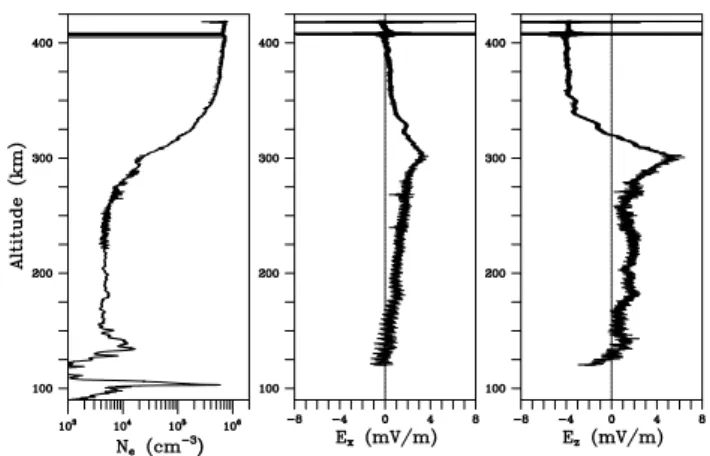
Fig. 13. Upleg data from the 15 August rocket flight. Left panel:
electron density. Center panel: zonal electric field. Right panel: vertical electric field.
Note also that the valley region was much flatter than in the earlier experiment and relatively free of layer structure. A single sporadic E layer was also present.
Downleg data for the second instrumented rocket flight ap-pear in Fig. 14. This time, the irregularities resided mainly in the valley region where the vertical density gradient was relatively small and the plasma drifts were upward and
west-Fig. 14. Downleg data from the 15 August rocket flight. Left panel:
electron density. Center panel: zonal electric field. Right panel: vertical electric field.
ward. The relative RMS amplitude of the irregularities was again small. A strong westward jet in the plasma flow ex-isted at about 300 km, a feature we associate with the grow-ing large-scale waves in the bottomside. The sporadic E layer had a density comparable to the F region critical density.
Figure 15 shows the power spectra of the zonal and vertical electric fields measured in the bottom-type layers intercepted
Fig. 15. Power spectra of the bottom-type layer electric fields measured on 15 August 2004. A frequency of 1 Hz corresponds roughly to a
wavelength of 1.8 km.
Fig. 16. Altair radar oblique scan for 15 August 2004, 09:59 UT.
on the upleg and downleg. The electric fields are not as clearly anisotropic as they were in the August 7 experiment. Most of the power in these spectra is contained in wave-lengths of a few km or less.
Finally, Fig. 16 shows the state of the ionosphere approxi-mately an hour after the rocket experiments began. The fig-ure represents an off-perpendicular scan of the Altair UHF radar with its 300 µs long pulse mode. Patterns in the elec-tron density are indicative of a large number of small de-pleted channels (radar plumes) along with one or two larger depletions that penetrated to the topside. The remarkable
feature of these depletions is their regular spacing between depletions, reminiscent of the spacing of the patchy bottom-type layer. (Note that the horizontal resolution of the radar is degraded in this mode as zenith angle is increased. Hori-zontal fine structure is most clearly appraised in the data near zenith.)
3 Analysis and discussion
These experiments were conducted as a theory of bottom-type layers, shear flow, and ionospheric preconditioning
D. L. Hysell et al.: Rocket investigation of equatorial spread F 1397 leading to ESF was emerging from studies conducted for
many years at Jicamarca, Altair, and elsewhere. The the-ory rests on several earlier findings, including that strong plasma shear flow exists in the postsunset equatorial F re-gion ionosphere (Kudeki et al., 1981; Tsunoda et al., 1981; Eccles et al., 1999) and that bottom-type scattering layers ex-ist exclusively in low-altitude, westward-drifting strata (Hy-sell and Burcham, 1998; Kudeki and Bhattacharyya, 1999). The first of these findings suggests an additional, overlooked source of free energy for ionospheric instability. The second was puzzling; Rayleigh-Taylor instabilities are expected to form in the bottomside where there is a steep vertical den-sity gradient and not in the valley, and irregularities form-ing in the valley would tend to be “shorted out” by the high fraction of the field aligned Pedersen conductivity existing in the E region. Layers produced by Rayleigh Taylor-type in-stabilities should also exhibit vertical development, whereas bottom-type layers do not.
Carrying out highly accurate measurements of vector plasma drifts associated with the evening vortex, Kudeki and Bhattacharyya (1999) surmised that the bottom-type layers were excited by the large differential neutral-plasma drifts that exist at low altitudes, where the plasma streams rapidly westward at altitudes where the neutral flow is rapidly east-ward. The wind-driven interchange instability they described requires zonal plasma density gradients to function, but these could be generated by the convection associated with the evening reversal of the zonal electric field and the prereversal enhancement. This same convection pattern, combined with shear flow, are what produce the vortex. The growth rate for the instability could be substantial in view of the large differ-ential drifts in question.
Direct evidence for the Kudeki and Bhattacharyya theory came from Hysell et al. (2004), who observed bottom-type layers using high-resolution aperture synthesis radar imag-ing techniques at Jicamarca. Their images revealed that the primary plasma waves in the layer had kilometric wave-lengths and phase fronts that were elongated and aligned zon-ally. Zonal phase fronts are expected for zonal wind-driven interchange instabilities, whereas vertical fronts should be produced by Rayleigh Taylor-type processes. Hysell et al. (2004) also showed that nonlocal effects could isolate the primary waves from resistive loading by the E region if the primary wave wavelengths are a few kilometers or less.
A third finding of Hysell et al. (2004) was that, on nights when fully-developed ESF occurred, the irregularities in the bottom-type layers were often clustered into patches ar-ranged periodically in the zonal direction. The irregularities were meanwhile continuous and beam-filling (or absent) on nights when ESF did not occur. The authors surmised that the scale periodicity was telltale of the presence of large-scale waves with comparable wavelength. Different phases of the wave would present zonal plasma density gradients al-ternately stable or unstable to Kudeki and Bhattacharyya’s wind-driven instability.
In a 2-D incompressible flow, waves are expected to have vertical spatial extents at least comparable to their wave-length. This implies that the large-scale waves that modulate the bottom-type layers in the valley region could also serve as seed waves for Rayleigh Taylor-type instabilities in the bot-tomside. (The wavelength in question during the 7 August experiment was 200 km, twice the vertical distance from the bottom-type layer to the bottomside. The wavelength was much less during the August 15 experiment, but so was the distance.) This suggests a diagnostic relationship between the layers and ESF. Bottom-type layers are not likely to form (and certainly not patchy ones) in the absence of large-scale waves, and neither is ESF. As bottom-type layers are readily detected from the ground, they provide an expedient means of diagnosing the seeding of Rayleigh Taylor-type instabili-ties in the early stages of ESF.
The necessity of seed or precursor waves for initiating ESF has long been appreciated. Using the flux-tube-integrated formalism introduced by Haerendel (1973), it can readily be shown that, in the absence of unusually strong storm-time electric fields at the magnetic equator, the e-folding growth time for the generalized Rayleigh Taylor instability is seldom less than about 15 min. in the postsunset bottomside F region and seldom for more than one or two e-folding times (see for example Sultan (1996).) The time of most rapid wave growth is generally about 19:00 SLT, depending on season, solar cy-cle, and longitude. How is it possible then for large-scale depletions and radar plumes to start appearing by 20:00 SLT and earlier? The answer appears to be the presence of preex-isting seed waves.
The importance of large-scale waves in the behavior of the postsunset equatorial ionosphere has been highlighted by Tsunoda and White (1981) and Kil and Heelis (1998); Tsun-oda (2005). Their source is often attributed to gravity waves (R¨ottger, 1973; Kelley et al., 1981; Singh et al., 1997; Mc-Clure et al., 1998). This hypothesis is difficult to test exper-imentally, however, since only the effects of gravity waves and not the gravity waves themselves can be detected in the thermosphere using ISRs. Recently, Vadas and Fritts (2004) examined the issue theoretically, showing that a spectrum of gravity waves launched by mesoscale convection cells could survive wind shears and viscous and conductive damping and penetrate into the lower thermosphere. However, the preferred range of horizontal wavelengths for the surviving gravity waves was about 50–150 km. This barely includes but does not favor either the ∼30 km or the 200+ km large scale waves seen in Jicamarca and EQUIS II experiments.
However, Hysell and Kudeki (2004) considered whether shear flow itself could be the source of the large-scale waves. They followed the formalism developed by Keski-nen et al. (1988) who assessed the viability of electrostatic Kelvin Helmholtz instabilities in the auroral F region. That study suggested that ion-neutral collisions damp the insta-bility in the ionosphere. Hysell and Kudeki (2004) adapted the work for equatorial application, incorporating the effects
of altitude-dependent collisions. They found a collisional branch of the instability that could operate in the collisional regime in regions of strong, retrograde plasma motion. The growth rate of the instability could be comparable to that of the Rayleigh Taylor instability but with potentially ear-lier onset. Nonlocal analysis predicted that the growth rate should be a maximum for kL∼1/2, where k is the horizontal wavenumber and L is the vertical scale length of the shear. Taking L∼15 km on the basis of Fig. 7 therefore implies a preferred wavelength of about 200 km. An initial value anal-ysis, meanwhile, suggested that the instability would exhibit a much shorter dominant wavelength in its early stages, of the order of a few times L in simulation. They suggested that the transient response of the instability could therefore account for the decakilometric large-scale waves in the post-sunset ionosphere and that the steady-state response could account for the ∼200+ km large scale waves.
The new campaign data from Kwajalein place a number of components of the shear instability theory of firm experimen-tal ground. The vertical electric fields measured in situ prove the existence of strong shear flow and retrograde drifts in the postsunset bottomside F region. Low plasma density in the bottomside makes incoherent scatter difficult to receive and process, and shear flow has been inferred in large part (al-though not entirely) from coherent scatter from the bottom-type scattering layers that inhabit the region. Since there is no formal, rigorous relationship between coherent scatter sig-nals and the state parameters of the plasma, however, there was some cause for uncertainty prior to these experiments.
The rocket experiments further show that bottom-type lay-ers reside mainly in the valley region, below the altitudes where the vertical plasma density gradient is steepest and in-stead in the altitude range where the retrograde plasma drift is fastest. This, the fact that the vertical RMS perturbed electric fields in the layers are stronger than the zonal fields, and the widespread presence of zonal plasma density gradients in the Altair data, support the theory of Kudeki and Bhattacharyya (1999) attributing the layers to wind-driven interchange in-stabilities. The outer-scale of the electric fields in the layers is consistent with the kilometric primary wave wavelengths observed in aperture-synthesis imaging experiments at Jica-marca and also with the nonlocal theory which shows how the waves can exist at low magnetic apex altitudes. That the small-scale irregularities detected by the instrumented rocket on the upleg of the 15 August experiments were mainly in the bottomside can be interpreted as meaning that the transi-tion to Rayleigh Taylor-type instability was underway. This interpretation is supported by the rapid growth of the large-scale waves in the vicinity in Fig. 12 as well as by the jets in the upleg and downleg electric field data in the vicinity of the irregularities.
Moreover, coherent scatter data from the Altair radar con-firm the observation that the bottom-type layers often consist of patches regularly distributed in space. This phenomenon was discovered using aperture-synthesis imaging and
vali-dated by conventional radar data like those in Fig. 12. That the regular spacing of the patches was later seen in the mor-phology of the depletions during full-blown ESF (Figs. 9 and 16) argues that the layer patches are telltale of large-scale seed waves in the bottomside existing in advance of ESF. Such waves should have sufficient vertical extent both to modulate the bottom-type layers in the valley region and to seed the bottomside for Rayleigh Taylor-type instability. The bottom-type layers provide a sensitive diagnostic of the seeding process.
4 Conclusions
Two important questions remain to be addressed with the EQUIS II dataset. The first concerns the cause of the shear flow. The factors that can contribute have been analyzed in-dividually in theoretical and experimental contexts by Anan-darao et al. (1978); Fejer (1981); Stenning (1981); Takeda and Maeda (1983); Farley et al. (1986) and by Haerendel et al. (1992), Haerendel and Eccles (1992), and again by Ec-cles (1998) in more theoretical treatments. They include 1) zonal electric fields on flux tubes with significant Hall con-ductivity, as are responsible for driving the equatorial elec-trojet, 2) zonal winds on flux tubes with significant Pedersen conductivity, as drive the E and F region dynamos, 3) vertical winds, a largely unknown quantity, and 4) vertical boundary currents forced from above or below the flux tube in ques-tion. In the bottomside and valley regions around twilight, this last factor could result from the closure of the equatorial electrojet, which must turn partly vertical at the boundary of the evening terminator. It could also result from the F region dynamo operating in flux tubes near the F peak. The finite efficiency of the dynamo implies the existence of an upward vertical current there. The demands imposed by this current can only be supported at lower altitudes, where the conduc-tivity is smaller, by a potentially large vertical electric field (Haerendel et al., 1992; Haerendel and Eccles, 1992).
The second question concerns the viability of the colli-sional shear instability in the postsunset bottomside equato-rial F region and its ability to produce the large-scale waves present at the start of the spread F events described here. An approximate expression for the linear growth rate of the in-stability can be written as (Hysell et al., 2005):
γ ≈ κφκphhhq pνin(u − v◦)n◦ 0i κφ2hhphq hφ νinn◦i +κ 2 ph hφhq hp νinn◦i (1)
where u is the zonal neutral wind speed, v is the zonal plasma drift speed, n◦is the background plasma number density, and
νinis the ion-neutral collision frequency. The equation is
ex-pressed in magnetic dipole coordinates (p, q, φ) as defined in the reference above, and the h factors are scale factors for this system. The κ factors are dimensionless wavenumber
D. L. Hysell et al.: Rocket investigation of equatorial spread F 1399 components. The prime notation is shorthand for
differentia-tion with respect to p. Finally, the overbars and angle brack-ets denote averages parallel to B and normal to B and the horizontal, respectively. Equation (1) is solved by carrying out the necessary averages and then finding and substitut-ing the ratio of wavenumber components that maximize the growth rate. Growth rates found to exceed the growth rate of the flux-tube-integrated generalized Rayleigh Taylor in-stability would point to the importance of shear inin-stability in initiating ESF.
Assessing both the causes of shear flow and the viability of shear instability require the specification of ionospheric con-ductivities, electric fields, and horizontal winds over a wide sector of the low-latitude ionosphere. We are assembling the required empirical and physics-based models, operating them with parameterizations chosen to produce results maxi-mally consistent with our measurements wherever they exist. It will be especially important to correctly model both the steep bottomside F region density gradients and the valley region plasma number density in view of the form of Eq. (1). The formula suggests that shear instability is most likely if strata can be found with both steep vertical density gradi-ents and rapid retrograde drifts. If the retrograde drifts are caused by significant electrical loading in the E region, how-ever, then growth will be suppressed in accordance with the denominator in Eq. (1). Only if the shear is produced mainly by one of the other aforementioned mechanisms would we expect shear instability to occur.
Acknowledgements. This work was supported by the National
Aeronautics and Space Administration through grant no. NAG5-5380 to Cornell University and grants NAG5-5373 and NAG5-5379 to Clemson University. The authors are indebted to the staffs of the Reagan Test Site on Kwajalein and of the Wallops Flight Facility who made this campaign possible and also to Prof. Erhan Kudeki and Dr. Robert Pfaff for many valuable discussions.
Topical Editor M. Pinnock thanks an anonymous referee for their help in evaluating this paper.
References
Anandarao, B. G., Raghavararao, R., Desai, J. N., and Haerendel, G.: Vertical winds and turbulence over Thumba, J. Atmos. Terr. Phys., 40, 157–163, 1978.
Bowles, K. L., Ochs, G. R., and Green, J. L.: On the absolute inten-sity of incoherent scatter echoes from the ionosphere, J. of Res. NBS - D. Rad. Prop., 66D, 395, 1962.
Close, S., Oppenheim, M. M., Hunt, S., and Dyrud, L. P.: Scattering characteristics of high-resolution meteor head echoes detected at multiple frequencies, J. Geophys. Res., 107, 1295–1306, 2002. Eccles, J. V.: A simple model of low-latitude electric fields, J.
Geo-phys. Res., 103, 26 699–26 708, 1998.
Eccles, J. V., Maynard, N., and Wilson, G.: Study of the evening drift vortex in the low-latitude ionosphere using San Marco elec-tric field measurements, J. Geophys. Res., 104, 28 133–28 144, 1999.
Farley, D. T., Bonelli, E., Fejer, B. G., and Larsen, M. F.: The pre-reversal enhancement of the zonal electric field in the equatorial ionosphere, J. Geophys. Res., 91, 13 723–13 728, 1986. Fejer, B. G.: The equatorial ionospheric electric fields. A review, J.
Atmos. Terr. Phys., 43, 377–386, 1981.
Haerendel, G.: Theory of Equatorial Spread F, Max-Planck In-stitute f¨ur Physik und Astrophysik, Garching, West Germany, preprint, 1973.
Haerendel, G. and Eccles, J. V.: The role of the equatorial electro-jet in the evening ionosphere, J. Geophys. Res., 97, 1181–1192, 1992.
Haerendel, G., Eccles, J. V., and Cakir, S.: Theory for modeling the equatorial evening ionosphere and the origin of the shear in the horizontal plasma flow, J. Geophys. Res., 97, 1209–1223, 1992. Hysell, D. L. and Burcham, J.: JULIA radar studies of equatorial
spread F, J. Geophys. Res., 103, 29 155–29 168, 1998.
Hysell, D. L. and Kudeki, E.: Collisional shear instability in the eqautorial F region ionosphere, J. Geophys. Res., 109, (A11 301), 2004.
Hysell, D. L., Chun, J., and Chau, J. L.: Bottom-type scattering layers and equatorial spread F, Ann. Geophys., 22, 4061–4069, 2004.
Hysell, D. L., Kudeki, E., and Chau, J. L.: Possible ionospheric pre-conditioning by shear flow leading to equatorial spread F, Ann. Geophys., 23, 2647–2655, 2005.
Kelley, M. C., Larsen, M. F., and La Hoz, C.: Gravity wave interac-tion of equatorial spread F: A case study, J. Geophys. Res., 86, 9087–9100, 1981.
Keskinen, M. J., Mitchell, H. G., Fedder, J. A., Satyanarayana, P., Zalesak, S. T., and Huba, J. D.: Nonlinear evolution of the Kelvin-Helmholtz instability in the high-latitude ionosphere, J. Geophys. Res., 93, 137–152, 1988.
Kil, H. and Heelis, R. A.: Global distribution of density irregulari-ties in the equatorial ionosphere, J. Geophys. Res., 103, 407–418, 1998.
Kudeki, E. and Bhattacharyya, S.: Post-sunset vortex in equatorial
F-region plasma drifts and implications for bottomside spread-F,
J. Geophys. Res., 104, 28 163–28 170, 1999.
Kudeki, E., Fejer, B. G., Farley, D. T., and Ierkic, H. M.: Inter-ferometer studies of equatorial F region irregularities and drifts, Geophys. Res. Lett., 8, 377–380, 1981.
Larsen, M. F. and Odom, C. D.: Observations of altitudinal and lat-itudinal E-region neutral wind gradients near sunset at the mag-netic equator, Geophys. Res. Lett., 24, 1711–1714, 1997. McClure, J. P., Singh, S., Bambogye, D. K., Johnson, F. S., and Kil,
H.: Occurrence of equatorial F region irregularities: Evidence for tropospheric seeding, J. Geophys. Res., 103, 29 119–29 136, 1998.
Miller, K. L. and Smith, L. G.: Horizontal structure of midlatitude sporadic E layers observed by incoherent scatter radar, Radio Sci., 10, 271–276, 1975.
Miller, K. L. and Smith, L. G.: Incoherent scatter radar observa-tions of irregular structure in mid-latitude sporadic E layers, J. Geophys. Res., 83, 3761–3775, 1978.
Pingree, J. E. and Fejer, B. G.: On the height variation of the equa-torial F region vertical plasma drifts, J. Geophys. Res., 92, 4763– 4766, 1987.
R¨ottger, J.: Wavelike structures of large scale equatorial spread F irregularities, J. Atmos. Terr. Phys., 35, 1195–1206, 1973.
Singh, S., Johnson, F. S., and Power, R. A.: Gravity wave seeding of equatorial plasma bubbles, J. Geophys. Res., 102, 7399–7410, 1997.
Stenning, R. J.: A two-layer ionospheric dynamo circulation, J. Geophys. Res., 86, 3543–3550, 1981.
Sultan, P. J.: Linear theory and modeling of the Rayleigh-Taylor instability leading to the occurrence of equatorial spread F, J. Geophys. Res., 101, 26 875–26 892, 1996.
Takeda, M. and Maeda, H.: F region dynamo in the evening – In-terpretation of equatorial 1D anomaly found by MAGSAT, J. Atmos. Sol. Terr. Phys., 45, 401–408, 1983.
Tsunoda, R. T.: On the enigma of day-to-day variability in equatorial spread F, Geophys. Res. Lett., 32, L08 103, doi:10.1029/2005GL022512, 2005.
Tsunoda, R. T. and White, B. R.: On the generation and growth of equatorial backscatter plumes, 1. Wave structure in the bottom-side F layer, J. Geophys. Res., 86, 3610–3616, 1981.
Tsunoda, R. T., Barons, M. J., Owen, J., and Towle, D. M.: Altair: An incoherent scatter radar for equatorial spread F studies, Radio Sci., 14, 1111–1120, 1979.
Tsunoda, R. T., Livingston, R. C., and Rino, C. L.: Evidence of a velocity shear in bulk plasma motion associated with the post-sunset rise of the equatorial F layer, Geophys. Res. Lett., 8, 807– 810, 1981.
Vadas, S. L. and Fritts, D. C.: Thermospheric response to gravity waves arising from mesoscale convective complexes, J. Atmos. Sol. Terr. Phys., 66, 781–804, 2004.
Woodman, R. F. and La Hoz, C.: Radar observations of F region equatorial irregularities, J. Geophys. Res., 81, 5447–5466, 1976.