HAL Id: hal-00317099
https://hal.archives-ouvertes.fr/hal-00317099
Submitted on 1 Jan 2003
HAL is a multi-disciplinary open access
archive for the deposit and dissemination of
sci-entific research documents, whether they are
pub-lished or not. The documents may come from
teaching and research institutions in France or
abroad, or from public or private research centers.
L’archive ouverte pluridisciplinaire HAL, est
destinée au dépôt et à la diffusion de documents
scientifiques de niveau recherche, publiés ou non,
émanant des établissements d’enseignement et de
recherche français ou étrangers, des laboratoires
publics ou privés.
The global heliospheric magnetic field polarity
distribution as seen at Ulysses
G. H. Jones, A. Balogh
To cite this version:
G. H. Jones, A. Balogh. The global heliospheric magnetic field polarity distribution as seen at Ulysses.
Annales Geophysicae, European Geosciences Union, 2003, 21 (6), pp.1377-1382. �hal-00317099�
Annales
Geophysicae
The global heliospheric magnetic field polarity distribution as seen
at Ulysses
G. H. Jones and A. Balogh
Space and Atmospheric Physics Group, The Blackett Laboratory, Imperial College London, London SW7 2BW, UK Received: 12 November 2002 – Accepted: 25 February 2003
Abstract. The Ulysses spacecraft is in a near-polar solar
or-bit with a period of 6.2 years. The heliospheric magnetic field polarity detected by Ulysses from its 1992 Jupiter encounter to the current time is presented, following ballistic mapping of the polarity information to the solar wind source surface, at approximately 2.5 solar radii. The spacecraft’s first foray to polar latitudes and first rapid heliolatitude scan occurred in 1994–1995, near a minimum in solar activity. The he-liospheric current sheet during this period was confined to low heliolatitudes. In 2000–2001, Ulysses returned in situ data from the same region of its orbit as in 1994–1995, but near to the maximum in solar activity. Unlike at solar min-imum, heliospheric current sheet crossings were detected at the spacecraft over a wide heliolatitude range, which is con-sistent with the reversal of the solar magnetic dipole occur-ring duoccur-ring solar maximum. Despite complexity in the solar wind parameters during the latest fast latitude scan (McCo-mas et al., 2002), the underlying magnetic field structure ap-pears consistent with a simple dipole inclined at a large angle to the solar rotational axis. The most recent data show the heliospheric current sheet returning to lower heliolatitudes, indicating that the dipole and rotational axes are realigning, with the Sun’s magnetic polarity having reversed.
Key words. Interplanetary physics (interplanetary magnetic
fields; sources of the solar wind) – Solar physics, astro-physics and astronomy (magnetic fields)
1 Introduction
A unique aspect of the ESA/NASA Ulysses mission is its provision of in situ data from extremely high heliolatitudes within the inner heliosphere. To reach the regions in the he-liosphere above the solar poles, Ulysses performed a close flyby of Jupiter in early 1992 to alter the spacecraft’s orbit from one lying close to the ecliptic plane to a 6.2-year, near-polar orbit inclined at 80.2◦to the solar equator.
Correspondence to: G. H. Jones (g.h.jones@ic.ac.uk)
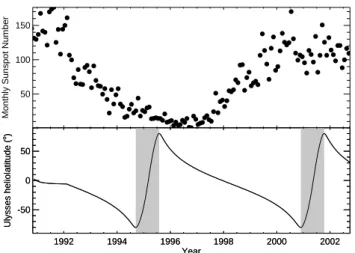
Figure 1 shows the monthly sunspot number, which is an indicator of solar activity levels, and the heliolatitude of Ulysses. The spacecraft’s first fast latitude scan, during which Ulysses travelled from high southern to high north-ern latitudes in less than 11 months, took place near a min-imum in the solar cycle. The spacecraft recently repeated the scan near solar maximum, when solar magnetic polar-ity reversal took place. Open magnetic field lines originat-ing in regions of opposite magnetic polarity are separated by the heliospheric current sheet (HCS). Crossings of the HCS are detected in situ as reversals in the heliospheric mag-netic field (HMF) polarity at the spacecraft. The heliolati-tude range over which HCS crossings occur is primarily a function of the solar magnetic dipole’s tilt. Nearing solar maximum, as the dipole begins to reverse orientation, the HCS is expected to extend over an ever-increasing heliolati-tude range. The dipole axis crosses the solar equator, and the HCS latitude range decreases again (Saito et al., 1978). This is the behaviour of the source surface neutral line in poten-tial field models based on photospheric field measurements (e.g. Hoeksema, 1986). Due to the difficulty of remotely ob-serving high-latitude photospheric fields, these models cover a limited latitude range.
During the majority of Ulysses’s first polar orbit, the HCS was confined to low heliolatitudes. Data returned by Ulysses during 2000/2001 have provided the first in situ measure-ments of high-latitude heliospheric magnetic fields around the time of polarity reversal, when the HCS extended over its maximum heliolatitude range. The Ulysses data may thus greatly aid our understanding of the polarity reversal process. Here, we present the global pattern of magnetic polarity, the sector structure, detected by the spacecraft since its entry into a near-polar orbit.
2 Data analysis
The HMF polarity distributions were derived from data re-turned by Ulysses’s magnetometer (Balogh et al., 1992) and
1378 G. H. Jones and A. Balogh: Heliospheric magnetic field polarity distribution at Ulysses
50 100 150
Monthly Sunspot Number
1992 1994 1996 1998 2000 2002 Year -50 0 50 Ulysses heliolatitude ( o) 1992 1994 1996 1998 2000 2002 Year -50 0 50 Ulysses heliolatitude ( o)
Fig. 1. Top: monthly sunspot numbers from the U.S. National Geo-physical Data Center. Bottom: the heliolatitude of Ulysses. The spacecraft’s two fast latitude scans are shaded.
SWOOPS instrument (Bame et al., 1992). Hourly-averaged data from both instruments were employed, to reduce the ef-fects of short-term fluctuations of the solar wind parameters. The magnetic polarity at Ulysses was estimated by compar-ing the instantaneous Parker spiral direction at Ulysses, with the actual azimuth angle of the field. In all plots presented here, the magnetic polarities are shown as yellow (outwards, or positive polarity), blue (inwards, or negative), or red (un-certain polarity, where the field azimuth was between 60◦and 120◦from the expected Parker spiral direction).
For each data point, ballistic mapping was used to esti-mate the source Carrington longitude of the parcel of plasma represented by that datum. This made use of the coordinates of the sub-Ulysses point on the Sun at the time of observa-tion, the solar wind velocity measured at the spacecraft, the spacecraft’s heliocentric distance, and the rotation period of the Carrington frame of reference (= 25.38 days in the iner-tial frame). The solar wind was assumed to have remained at the same heliolatitude during its traversal from the solar wind source surface, at ∼2.5 solar radii, to the spacecraft. Some uncertainties are known to be associated with some of the assumptions made (e.g. Neugebauer et al., 1998), but the results are believed to be sufficiently accurate for a relatively reliable overview of the polarity distribution.
3 Results
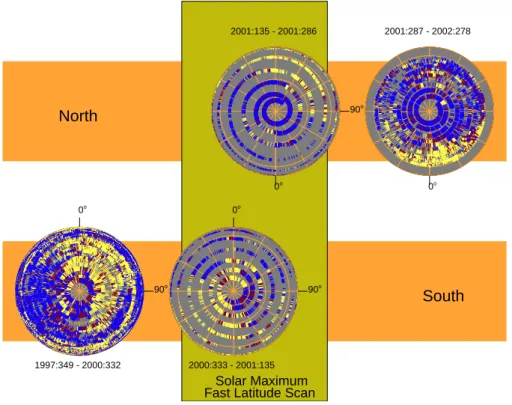
The polarities at Ulysses from the Jupiter encounter in early 1992 onwards, mapped back to the source surface, are shown in Fig. 2. Due to the spatial distortion associated with the Mercator projection, particularly for high-latitude regions, the same source surface magnetic polarities are shown in Figs. 3 and 4, as viewed from above the solar rotational poles. The Northern Hemisphere is shown in the upper panels, and the Southern Hemisphere in the lower panels. Each phase of the mission from equator to pole, or vice-versa, is shown,
beginning with the first excursion to high southern latitudes after the Jovian encounter in early 1992. Magnetic polarity observations made during the mission’s in-ecliptic phase, i.e. preceding the period covered by these plots, were outlined by Balogh et al. (1993a).
The longitudinal sampling of the mapped-back data is sometimes poor, particularly when rapid increases occurred in solar wind velocity, giving a corresponding westward jump in the apparent source longitude. We decided not to interpolate between the data points plotted in the figures.
One of the unexpected aspects of the HMF at high latitudes around solar minimum was its occasional reversal when well away from the HCS. Through the study of the propagation directions of waves during these polarity inversions, Balogh et al. (1999) determined that they are likely to be caused by large-scale folds in the B-field, rather than by flux tubes of opposite polarity originating at the Sun. In the plots pre-sented here, these isolated features are largely reprepre-sented by red points, i.e. uncertain magnetic polarities.
Below, we briefly describe the observations made during each phase in the mission, describing the recent data in most detail.
3.1 From Jupiter to the Southern Polar Region (1992:038 – 1994:256)
The data representing this period, which was during the de-clining phase of the solar cycle, are shown in the first panels of Figs. 2 and 3. A mixture of the two polarities was de-tected at the beginning of this period, as described by Balogh et al. (1993b). The then-northern (outward) polarity was de-tected until a heliolatitude of ∼30◦S (Smith et al., 1993;
Balogh et al., 1993b), when HCS crossings ceased.
3.2 The solar minimum fast latitude scan (1994:257 – 1995:212)
Around its first perihelion passage, Ulysses moved rapidly from high southern to high northern heliolatitudes. The rele-vant data are shown in the second panel of Fig. 2, and the sec-ond and third panels of Fig. 3. It is clear that HCS crossings were confined to low heliolatitudes, implying that the axis of the Sun’s magnetic dipole component was closely aligned with the rotation axis. A previous study of the HCS crossings by Erd¨os and Balogh (1998) has shown that at the location of Ulysses the HCS was, on average, symmetric with respect to the solar equatorial plane, while the coronal neutral line was displaced to the south, on average, by ∼5◦.
3.3 From high northern latitudes to the solar equator (1995:213 – 1997:349)
The data for this period are shown in the upper half of the third panel of Fig. 2, and the fourth panel of Fig. 3. Ulysses continued to detect the then-northern (outward) polarity until HCS crossings resumed at a heliolatitude of 25.5◦N, which was at higher latitudes than expected. This was ascribed by Forsyth et al. (1997) to be due to an active region deflecting
1992:038 - 1994:256 0 0 Carrington Longitude (o ) 0 0 Heliolatitude ( o) 0 45 90 135 180 225 270 315 360 0 0 -90 -60 -30 0 30 60 90 0 0 1994:257 - 1995:212 0 0 Carrington Longitude (o ) 0 0 Heliolatitude ( o) 0 45 90 135 180 225 270 315 360 0 0 -90 -60 -30 0 30 60 90 0 0 1995:213 - 2000:332 0 0 Carrington Longitude (o ) 0 0 Heliolatitude ( o) 0 45 90 135 180 225 270 315 360 0 0 -90 -60 -30 0 30 60 90 0 0 2000:333 - 2001:286 0 0 Carrington Longitude (o ) 0 0 Heliolatitude ( o) 0 45 90 135 180 225 270 315 360 0 0 -90 -60 -30 0 30 60 90 0 0 2001:287 - 2002:278 0 0 Carrington Longitude (o ) 0 0 Heliolatitude ( o) 0 45 90 135 180 225 270 315 360 0 0 -90 -60 -30 0 30 60 90 0 0
Outward Inward Uncertain
Fig. 2. The polarity distribution at the solar wind source surface plotted in a Mercator projection in the Carrington frame of reference. Each plot displays a distinct mission phase. The arrows to the right of the plot denote the direction in which Ulysses was moving in heliolatitude. The colours employed are defined in the key.
1380 G. H. Jones and A. Balogh: Heliospheric magnetic field polarity distribution at Ulysses South North 0o 90o 1992:039 - 1994:256 Solar Minimum Fast Latitude Scan
0o 90o 1994:257 - 1995:063 0o 90o 1995:064 - 1995:212 0o 1995:213 - 1997:349 South
Fig. 3. The same data as presented in the first two and a half panels of Fig. 2, but projected onto spheres representing the solar wind source surface, viewed from above the solar rotational poles. Time broadly moves from left to right, with the Northern Hemisphere shown in the upper plots, and the Southern Hemisphere in the lower plots. Carrington longitudes of 0◦and 90◦are indicated. The colours denote the same polarities as defined in Fig. 2.
the HCS northwards. The HCS did, however, later move to lower latitudes, before Ulysses reached the solar equator. 3.4 From the solar equator to the southern polar region near
solar maximum (1997:350 – 2000:332)
This period, plotted in the lower half of the third panel in Fig. 2, and the first panel of Fig. 4, saw a marked increase in complexity in the sector structure detected at Ulysses, coin-cident with the increase in solar activity. Balogh and Smith (2001) described the observations to mid-2000, and Smith et al. (2001) summarized observations at Ulysses to late 2000, at high southern heliolatitudes.
Rather than being dominated by a single polarity, the Southern Hemisphere at this time was a mixture of the two polarities, as the HCS extended to ever higher heliolatitudes with the approach of solar maximum. Both polarities were detected during each solar rotation, except for the very last rotation prior to maximum southern heliolatitude (Smith et al., 2001), indicating that Ulysses briefly moved to higher latitudes than the maximum HCS latitude.
If the HCS during this time was a single, coherent struc-ture without significant warps, it can be stated that magnetic polarity reversal had not occurred at this time (∼2000:332), at least in the polarity distribution at the solar wind source surface. However, although it is almost certain that the HCS inclination was near its maximum, a small warp in the HCS would have been sufficient to produce the observations
de-scribed while most of the sheet had actually tipped past the south pole.
As pointed out by Smith et al. (2002), the two-sector struc-ture observed during this period was consistent with a single HCS tilted at high inclination. The presence of isolated “is-lands” of opposite polarity cannot be ruled out, but such fea-tures were not unambiguously detected by the spacecraft. 3.5 The solar maximum fast latitude scan (2000:333 –
2001:286)
An initial overview of the HMF polarity at Ulysses around solar maximum was presented by Jones and Balogh (2002). This period is represented in the fourth panel of Fig. 2, and the second and third panels of Fig. 4. There are obvious differences in the polarity distribution between this mission phase and solar minimum fast latitude scan. Although the polarity distribution was probably evolving rapidly during this period, the fast pace of Ulysses’s motion around its sec-ond perihelion provided the closest we can currently attain to a global “snapshot” of the HMF polarities during this key phase in the solar activity cycle. During almost the entire period, both polarities continued to be detected at the space-craft, in approximately equal proportions with each solar ro-tation, until northern mid-heliolatitudes were reached. At a heliolatitude of ∼67◦N, around 2001:236, the last clear HCS crossing was seen at Ulysses. From that time onwards, the “new” northern (inward) polarity was the only one detected,
0o
90o
1997:349 - 2000:332
Solar Maximum Fast Latitude Scan
0o 90o 2000:333 - 2001:135 0o 90o 2001:135 - 2001:286 0o 2001:287 - 2002:278
North
South
Fig. 4. The polarity data presented in the final two and a half panels of Fig. 2, in the same format as Fig. 3.
with the exception of brief reversals within transient struc-tures. As the new northern polarity was clearly dominant at this time, this constrains the time of polarity reversal at the source surface to earlier than 2001:236.
Solar wind parameters during this period show a complex mixture of fast and intermediate speed flows, probably re-sulting from interactions between slow streams and faster flows from coronal holes and the interplanetary counterparts of coronal mass ejecta (McComas et al., 2002). Care should always be taken when extrapolating single-point sampling of HMF polarity to a global view. The magnetic polarity distri-bution is, however, simple enough, with a two-sector struc-ture seen in the 80◦S to 60◦N heliolatitude range, to be fairly confident that the sector structure seen was a result of the so-lar magnetic dipole being tipped such that its axis was near-orthogonal to the Sun’s rotation axis.
3.6 From high northern latitudes southwards (2001:287 – 2002:278)
The final panels in both Figs. 2 and 4 show the polarity dis-tribution to the time of writing, during which Ulysses has moved from high northern latitudes to ∼30◦N. The sector structure may have been again detected around 2002:018, at a heliolatitude of ∼62◦N. However, this possible sector was not clear, and it was two full solar rotations later when the sector structure was detected unambiguously, at a heliolat-itude of ∼50◦N. The sector structure continues to be quite clearly seen, with the new northern polarity constituting most of the solar wind sampled, as expected. A swathe of new
southern polarity is present from ∼320◦to 80◦longitude at
the end of this period.
Quite striking is the shift in the range of Carrington lon-gitude of the “new” southern polarity in the Northern Hemi-sphere. This is very different to the longitude range it oc-cupied during the ascent to high northern latitudes, and sug-gests that the magnetic dipole’s rotation rate during this pe-riod was slower than that of the Carrington frame of ref-erence. A similar longitude shift was seen around highest southern latitudes near solar maximum. Such a shift in the sector structure has been detected previously (e.g. Svaalgard and Wilcox, 1975; Balogh et al., 1993b).
As the rate of change of warping of the HCS is probably past its peak during this period, and as the fraction of the longitude range taken up by the southern polarity is not de-creasing, we expect Ulysses to continue to sample the new southern polarity while in the Northern Hemisphere. How-ever, as it occurred when Ulysses was first approaching the solar equatorial plane in 1996, comparatively rapid reposi-tioning of the HCS could conceivably occur, which would leave Ulysses again in unipolar fields.
4 Conclusion
The high-latitude observations made by Ulysses in 2000/2001 reveal for the first time the behaviour of the HCS at high latitudes. The sector structure at Ulysses near solar maximum is vastly different to that seen near solar minimum. Although detailed examinations of the data
1382 G. H. Jones and A. Balogh: Heliospheric magnetic field polarity distribution at Ulysses remain to be carried out, the first results presented here
clearly show that, largely through very fortunate timing, Ulysses witnessed the magnetic polarity reversal from a unique vantage point.
Although solar wind velocity exhibited a largely complex structure during the near-maximum fast latitude scan (Mc-Comas et al., 2002), the global magnetic polarity distribution appears to be consistent with the solar magnetic dipole sim-ply being inclined at a large angle to the solar rotational pole. The complexity seen in the solar wind parameters may thus largely be a consequence of the disruption of a relatively sim-ple initial flow pattern by stream-stream interactions between the Sun and spacecraft.
Acknowledgements. We are grateful to D. J. McComas for the use of data from the Ulysses SWOOPS instrument. Ulysses research at Imperial College London is supported by the UK Particle Physics and Astronomy Research Council.
The Editor in Chief thanks S. Suess and another referee for their help in evaluating this paper.
References
Balogh, A., Beek, T. J., Forsyth, R. J., Hedgecock, P. C., Mar-quedant, R. J., Smith, E. J., Southwood, D. J., and Tsurutani, B. T.: The magnetic field investigation on the Ulysses mission: Instrumentation and preliminary scientific results, Astron. Astro-phys. Suppl. Ser., 92, 221–236, 1992.
Balogh, A., Forsyth, R. J., Ahuja, A., Southwood, D. J., Smith, E. J., and Tsurutani, B. T.: The interplanetary magnetic field from 1 to 5 AU: Ulysses observations, Adv. Space Res., 13, 615–624, 1993a.
Balogh, A., Erd¨os, G., Forsyth, R. J., and Smith, E. J.: The evolu-tion of the interplanetary sector structure in 1992, Geophys. Res. Lett., 20, 2331–2334, 1993b.
Balogh, A., Forsyth, R. J., Lucek, E. A., Horbury, T. S., and Smith, E. J.: Heliospheric magnetic field polarity inversions at high he-liographic latitudes, Geophys. Res. Lett., 26, 631–634, 1999. Balogh, A. and Smith, E. J.: The Heliospheric magnetic field at
So-lar Maximum: Ulysses observations, Space Sci. Rev., 97, 147–
160, 2001.
Bame, S. J., McComas, D. J., Barraclough, B. L., Phillips, J. L., Sofaly, K. J., Chavez, J. C., Goldstein, B. E., and Sakurai, R. K.: The Ulysses solar wind plasma experiment, Astron. Astrophys. Suppl. Ser., 92, 237–265, 1992.
Erd¨os, G. and Balogh, A.: The symmetry of the heliospheric cur-rent sheet as observed by Ulysses during the fast latitude scan, Geophys. Res. Lett., 25, 245–248, 1998.
Forsyth, R. J., Balogh, A., Smith, E. J., and Gosling, J. T.: Ulysses observations of the northward extension of the heliospheric cur-rent sheet, Geophys. Res. Lett., 24, 3101–3104, 1997.
Hoeksema, J. T.: The relationship of the large-scale solar field to the interplanetary magnetic field: what will Ulysses find?, in: The Sun and the Heliosphere in Three Dimensions, (Ed) Marsden, R. G., Reidel, Dordrecht, 1986.
Jones, G. H. and Balogh, A.: Ulysses observations of changes in the solar polar regions around Solar Maximum, submitted to Pro-ceedings of Solar Wind X, AIP conference series, 2002. McComas, D. J., Elliott, H. A., Gosling, J. T., Reisenfeld, D. B.,
Skoug, R. M., Goldstein, B. E., Neugebauer, M., and Balogh, A.: Ulysses’ second fast-latitude scan: Complexity near solar maximum and the reformation of polar coronal holes, Geophys. Res. Lett., 29, 9, 10.1029/2001GL014164, 2002.
Neugebauer, M., Forsyth, R. J., Galvin, A. B., Harvey, K. L., Hoek-sema, J. T., Lazarus, A. J., Lepping, R. P., Linker, J. A., Mikic, Z., Steinberg, J. T., von Steiger, R., Wang, Y.-M., and Wimmer-Schweingruber, R. F.: The spatial structure of the solar wind and comparison with solar data and models, J. Geophys. Res., 103, A7, 14 587–14 599, 1998.
Saito, T., Sakurai, T., and Yumoto, K.: The Earth’s paleomagne-tosphere as the third type of planetary magnepaleomagne-tosphere, Planet. Space Sci., 26, 413–422, 1978.
Smith, E. J., Neugebauer, M., Balogh, A., Bame, S. J., Erd¨os, G., Forsyth, R. J., Goldstein, B. E., Phillips, J. L., and Tsurutani, B. T.: Disappearance of the heliospheric sector structure at Ulysses, Geophys. Res. Lett., 20, 2327–2330, 1993.
Smith, E. J., Balogh, A., Forsyth, R. J., and McComas, D. J.: Ulysses in the south polar cap at solar maximum: Heliospheric magnetic field, Geophys. Res. Lett., 28, 4159–4162, 2001. Svalgaard, L. and Wilcox, J. M.: Long term evolution of solar sector