The Economics of Future Membrane Desalination
Processes and Applications
by
Ronan Killian McGovern
B.E., University College Dublin (2010)
MASSACHUSETS INSTITUTE. OF TECHNOLOGY
AUG 15 2014
LIBPARIES
S.M., Massachusetts Institute of Technology (2012)
Submitted to the Department of Mechanical Engineering
in partial fulfillment of the requirements for the degree of
Doctor of Philosophy in Mechanical Engineering
at the
MASSACHUSETTS INSTITUTE OF TECHNOLOGY
June 2014
@
Massachusetts Institute of Technology 2014. All rights reserved.
Author ...
Certified
by.
.~Signature redacted
Department of Mechanical Engineering
May 20th, 2014
Signature redacted
John H. Lienhard V
ins Professor of Mechanical Engineering
Thesis Supervisor
Accepted by ...
Signature redactedr
David E. Hardt
Chairman, Committee for Graduate Studies
The Economics of Future Membrane Desalination Processes
and Applications
by
Ronan Killian McGovern
Submitted to the Department of Mechanical Engineering on May 20th, 2014, in partial fulfillment of the
requirements for the degree of
Doctor of Philosophy in Mechanical Engineering
Abstract
Seawater desalination, the desalination of waters flowing back from hydraulic frac-turing processes and brackish water desalination constitute important desalination applications. These have a combined market size in excess of $25 billion per annum and a combined water production rate equivalent to the domestic consumption of over
300 million people. Each application offers its own distinct challenge. Reductions in
energy consumption are key to driving down seawater desalination costs. The optimi-sation of water treatment in tandem with the formulation of fracturing fluids is key to reducing water management costs and environmental impacts in hydraulic fracturing. The development of desalination technologies that allow for high water recovery and high product purity is key to meeting industrial and municipal needs from brack-ish water sources. This thesis develops and investigates three emerging technologies: forward osmosis, electrodialysis at high salinity and hybrid electrodialysis-reverse os-mosis with a view to addressing the three above challenges.
Forward osmosis has often been viewed as a technology with the potential to reduce energy consumption in seawater desalination. An analysis is therefore un-dertaken into the theoretical limits upon its energy requirements paying particular attention to the energy penalty involved in drawing water from the feed stream into a more concentrated solution. Although unaddressed in literature this energy penalty is an important and distinguishing factor between FO and other desalination tech-nologies. In the case of seawater, it is shown to put FO at a disadvantage that makes it difficult to compete with reverse osmosis. Consequently, it is argued that forward osmosis research should be reoriented away from seawater desalination to focus on al-ternate applications where salinities are above those which reverse osmosis can handle or where draw solution regeneration is not required. For these alternate applications a new framework is provided that explains the influence of the membrane orienta-tion upon water flux through the membrane, an insight that is of particular use in
considering the trade-off between water flux and fouling.
The conventional view of electrodialysis is that it is most cost effective for the desalination of low salinity waters, and less so for moderate and high salinities, such
as those encountered in waters that flow back from hydraulic fracturing processes. A thermoeconomic analysis of the effect of salinity upon cost reveals a different picture whereby electrodialysis is most cost effective removing salt from streams with between
1,000 ppm and 20,000 ppm of total dissolved solids. At lower salinities performance
is hampered by low solution conductivity and low salt removal rates. At higher salinities the process is thermodynamically inefficient as the chemical potential of salt is raised only by a small amount when transported into the concentrate stream. The conclusion is that applications requiring salt removal within this 'sweet spot' for electrodialysis, such as the treatment of waste waters from flue-gas desulphurisation
and coal-bed methane production, merit accelerated investigation.
Incumbent technologies for the recycling of water produced from shales are cur-rently inefficient and expensive. A study of electrodialysis energy requirements and equipment costs indicates that they are similar to, or even lower than, those for distil-lation. By developing a numerical model of system performance, which was validated over the range of 250 ppm to 192,000 ppm NaCl, it was possible to optimise the elec-trodialysis stack voltage and bring about cost savings of up to 30% in certain cases. These results and this numerical model warrant and will guide further investigations of electrodialysis under field conditions.
Finally, a hybrid electrodialysis-reverse osmosis system was designed and opti-mised such that the reverse osmosis unit shifts salt removal in the electrodialysis unit into its sweet spot. The combination of these two technologies results in a system that provides enhanced product purity and product recovery at reduced cost. A simple rule of thumb is provided to guide practitioners in their choice between hybrid and standalone systems. This rule allows a choice to be made based on the relative cost of water from electrodialysis and reverse osmosis.
Thesis Supervisor: John H. Lienhard V
Acknowledgments
I thank my co-authors, who contributed to this work: David Cohen-Tanugi, Shreya
Dave, Prof. Jeffrey Grossman, Jordan Mizerak and others whom I will mention below. I thank current and former members of Prof. Lienhard's research group: Karan, Ed, Jacob, Mohamad, Charlene, Kishor, Urmi, Christine, David, Bader, Seongpil, Mohit, Jai, Karim, John and Emily. In particular, I thank Chester, Lige and Adam, with whom it was a pleasure to work on the electrodialysis project. I thank Adam for teaching me about baseball, Leo for teaching me jazz, Prakash for teaching me how to write patents and Greg, a friend whom I greatly trust. I thank my committee members, Prof. Evelyn Wang and Prof. Jongyoon Han, for their enthusiastic support for my plan of study, and Prof. Syed Zubair, for spending significant time with me when visiting and providing great encouragement. I thank Jim Freedman of the
Technology Licensing Office with whom it has been a pleasure to work. I thank my advisor Prof. John Lienhard V. His courage and flexibility in allowing me to pursue and take responsibility for new research ideas allowed me to learn rapidly at MIT and his continuous support and responsiveness is greatly appreciated. I thank Ivonne, Anne-Marie, Faddy, Gabriel and Audren for the time we have spent together since we all arrived in the USA. I thank my parents, Jim and Stephanie, my sister, Aoife, and my brother, Fergal. In Irish we say 'Nil aon tinteain mar do thintein fein', meaning 'There's no place like home'. My family has always made me feel at home, even when I'm away. I've learned greatly and will remember fondly my time at MIT. We may have Twitter and Facebook to keep in touch but technology is no replacement for tears. Technology is no replacement for tears and with desalination those tears will always be fresh.
Sponsors supporting this work
I thank the U.S. Department of State for support through the Fulbright Science and
Technology program, the Hugh Hampton Young Memorial Fund for support through a graduate fellowship, the King Fahd University of Petroleum and Minerals for fund-ing through the Center for Clean Water and Clean Energy at MIT and KFUPM, the Martin Family for support through the Martin Fellowship for Sustainability and the International Desalination Assocation for support through the Channabasappa
Contents
1 Introduction 13
1.1 Seawater desalination: The challenge of reducing energy consumption 13
1.2 Desalination of produced waters from hydraulic fracturing: The
chal-lenge of integrating desalination into water reuse . . . . 15
1.3 Brackish and industrial water desalination: The challenges of high pu-rity and high recovery . . . . 18
1.4 In sum m ary . . . . 19
2 On the potential of forward osmosis to energetically outperform re-verse osmosis desalination 25 2.1 Introduction . . . . 27
2.2 Thermodynamic limits upon draw regeneration . . . . 27
2.3 An energetic comparison of FO and RO . . . . 29
2.4 An analysis of RO as a regeneration process for FO . . . . 34
2.5 Comments on alternate forward osmosis applications . . . . 38
2.6 Conclusion . . . . 38
2.A Seawater Reverse Osmosis Example . . . . 39
2.B Ultrafiltration and forward osmosis pumping power estimations . . . 39
2.C Evaluation of heat exchanger costs in waste heat driven forward osmo-sis applications . . . . 40
3 Three dimensionless parameters influencing the optimal membrane
3.1 Introduction . . . .
3.2 Dimensionless water transport equations . . . .
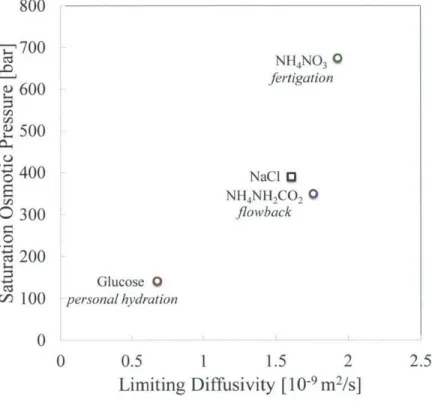
3.3 Application to FO Processes . . . . 3.4 Implications for the design of flowback, fertigation and hydration pro-cesses . . . . 3.5 C onclusion . . . .
3.A Determination of osmotic pressures, diffusivities and membrane
pa-ram eters . . . .
3.A.1 Membrane parameters . . . . 3.A .2 D iffusivities . . . . 3.A.3 Osmotic Pressures . . . .
3.B Optimal membrane orientation for reverse osmosis pre-dilution and post dilution . . . .
3.C The role of individual ions in determining solute diffusivity . . . .
4 The cost effectiveness of electrodialysis for diverse salinity applica-tions
4.1 Introduction . . . .
4.2 M ethodology . . . .
4.2.1 The 'Local Cost' of separation . . . . 4.2.2 The cell pair model . . . . 4.2.3 The input parameters to the numerical model . . . . 4.3 Dependence of efficiency, productivity and cost upon current density for fixed salinities . . . . 4.4 Dependence of productivity, efficiency and cost upon salinities at the optimal current density . . . . 4.4.1 Influence of salinities upon productivity, efficiency and 'Local Cost' . . . .. 4.4.2 Influence of salinities on optimal current density . . . . 4.4.3 Implications for the cost of ED systems . . . .
53 55 57 61 61 62 62 62 62 63 66 75 77 78 79 83 86 87 89 90 94 95
4.5 Conclusion . . . . 96
5 A hybrid electrodialysis-reverse osmosis system and its optimization for the treatment of highly saline brines 105 5.1 Introduction . . . 107
5.1.1 M otivation . . . . 107
5.1.2 Literature review . . . . 107
5.1.3 G oals . . . . 108
5.2 Design considerations for ED at high salinity . . . . 108
5.2.1 Relative importance of ohmic losses in solutions and membranes 109 5.2.2 Limiting current density and concentration polarization . . . . 109
5.2.3 Maximum concentration achievable in electrodialysis 5.2.4 Summary of high salinity ED . . . . 5.3 System description and modelling . . . . 5.3.1 Evaluation of Donnan potentials . . . 5.3.2 Evaluation of solution resistances . . 5.3.3 Membrane properties . . . . 5.3.4 ED system modelling . . . . 5.3.5 Physical properties . . . . 5.3.6 Solution of hybrid system equations 5.4 Minimization of the levelized cost of water 5.5 R esults . . . . 5.6 Conclusions . . . . . . . . . 112 . . . . 114 . . . . 114 . . . . 116 . . . . 117 . . . . 117 . . . . 118 . . . . 119 . . . . 120 . . . . 121 . . . . 122 . . . . 126
the cost of electrodialysis for the desalination of high salinity s 133 6.1 Introduction . . . . 6.2 M ethods . . . . 6.2.1 Experim ental . . . . 6.2.2 M odel . . . . 6.3 Results: Process time, energy consumption and costs . . . . . . . . . 135 . . . . 138 . . . . 138 . . . . 141 . . . . 144 6 On feed
6.4 6.5 6.A 6.3.1 Discussion . . . . Voltage optimisation . . . . C onclusions . . . .
Determination of experimental conditions . . . .
6.A.1 Determination of the concentrate salinity in each stage
6.A.2 Selection of the stack voltage . . . . . 6.A.3 Determination of diluate circuit volume
6.B Assessment of pumping power . . . .
6.C Electrodialysis model . . . . 6.C.1 Concentration polarisation . . . .
6.C.2 Junction and membrane potentials . . 6.D Determination of fitted parameters . . . . 6.D.1 Sherwood number . . . .
6.D.2 Spacer shadow factor . . . .
6.D.3 Electrode potential . . . .
6.D.4 Membrane resistance . . . .
6.D.5 Salt and water transport numbers . . . 6.D.6 Salt and water permeability . . . . 6.D.7 Summary of model parameters . . . . .
. . . . 149 . . . . 151 . . . . 152 . . . . 154 . . . . 154 . . . . 155 . . . . 155 . . . 156 . . . . 157 . . . . 157 . . . . 158 . . . . 159 . . . . 159 . . . . 159 . . . . 161 . . . . 161 . . . . 162 . . . . 164 . . . . 165
7 The benefits of hybridising electrodialysis with reverse osmosis 7.1
7.2
Introduction . . . . The rationale for hybridising electrodialysis with reverse osmosis
7.3 Reasons to prefer a simple ED-RO hybrid configuration . . . .
7.4 Reasons to prefer a recirculated hybrid ED-RO system . . . . 7.4.1 Implications of scaling and fouling on the selection of stan-dalone versus hybrid systems . . . . 7.5 Sensitivity analysis . . . .
7.6 C onclusion . . . .
7.A Estimation of the growth of world brackish water desalination . . . .
177 179 182 185 189 191 192 193 194
7.B Electrodialysis model details . . . 195
7.B.1 Electrodialysis transport model . . . 195
7.B.2 Evaluation of the stack voltage . . . 197
7.B.3 Electrodialysis cost model . . . 198
7.C Estimation of specific equipment costs . . . . 199
7.D Validation of energy consumption . . . . 199
7.E Hybrid model details . . . . 199
7.F Assessment of electrodialysis power requirements for pumping . . . . 201
8 Summary and Impact 211 8.A Seawater desalination and the future of forward osmosis . . . 211
8.B Desalination of produced waters via electrodialysis . . . 212
8.C Desalination of brackish waters via hybrid electrodialysis - reverse os-m osis systeos-m s . . . 212
Chapter 1
Introduction
This thesis addresses the development of technology for three significant desalina-tion applicadesalina-tions: seawater desalinadesalina-tion, produced water recycling for the hydraulic fracturing of shales and brackish water desalination. The emphasis is placed on ad-dressing a core challenge faced in each of these applications. These core challenges are summarised in this introductory section.
1.1
Seawater desalination: The challenge of
reduc-ing energy consumption
In the last twenty years, approximately 42,000,000 m3/day of seawater desalination
plant capacity had been installed worldwide'. Based on estimated per capita water withdrawals associated with public water supply of 574 litres per day in 20052, this capacity would satisfy the needs of approximately 73 million people. Increasingly, the preferred technology for seawater desalination is the membrane based pressure-driven process of reverse osmosis3, which accounted for approximately 59% of total seawater desalination plant capacity that came online in the past 20 years'.
The cost of desalinated water45 currently lies roughly in the region of 0.5-1.5
$/m3, excluding distribution costs. Significant efforts to reduce these costs rest on reducing the energy demands of the desalination process. Depending on the price of
electricity, water costs attributable to energy (Fig. 1-1) can account for a significant portion of total water costs. Interestingly, though energy costs may seem high, en-ergy requirements have already fallen drastically, in fact enen-ergy requirements twenty
five years ago were more than double what they are today 17. Improvements in
mem-brane permeability and the emergence of pressure recovery devices have succeeded in capturing energy savings that constituted the 'low lying fruit'. Now, membrane development is at such a stage that further improvements in permeability are unlikely
to bring about significant energy savings3, as shown in Fig. 1-2. This recent work
on the benefits of higher membrane permeability suggests that instead improvements will come about through a redesign of the reverse osmosis process. Such a redesign might entail a move towards batch rather than continuous processes, as suggested
by a recent study6 showing that energy savings of up to 7% are achievable while
maintaining the water production rate constant (Fig. 1-3).
1.00 0.80 40.60 -_ o 0.40 --0.20 0.00 Electricity price [$/kWh]
Figure 1-1 Given desalinated water prices vary from 0.50-1.50 $/m3, energy accounts for
a significant portion of costs, even when electricity prices are low. This plot is based upon
reverse osmosis energy consumption5 of 3 kWh/m3
Thus, one of the great open questions in seawater desalination is whether another technology might someday outperform reverse osmosis and achieve lower energy con-sumption. Chapter 2 of this thesis addresses this question by analysing whether
6
Useawater
E brackish water -- TFC case 4 UPM case 0 E 4 0 r_ 0) C 0' 0 100 200 300 400 500Permeate per vessel (m3/d)
Figure 1-2 Specific energy consumption of RO vs. permeate production per vessel, for
conventional thin film composite (TFC) membranes (solid) and ultra permeable
membranes (UPM) at 3X greater permeability (dashed). Circles depict the baseline case, and the arrows indicate how each RO system could operate given the availability of UPMs. Feed flowrate is held fixed while pressure increases as a function of permeate production. The potential improvement in energy consumption is limited as current systems already operate with the hydraulic pressure close to the osmotic pressure of concentrated brine exiting the RO module. Image taken from Cohen-Tanugi et al.3
forward osmosis, an emerging membrane desalination process, might be able to com-pete. Chapter 3 follows up by addressing alternate forward osmosis applications other than seawater desalination focusing on how water transport can be maximised through optimisation of the membrane orientation.
1.2
Desalination of produced waters from hydraulic
fracturing: The challenge of integrating
desali-nation into water reuse
Due to a lack of comprehensive data, it is difficult to estimate the quantity of water that flows to the surface in the US each day as a result of the hydraulic fracturing of
shales for oil and gas extraction. However, given that the quantity of water produced
in the long term varies from roughly 200-1,000 gallons per MMCF of natural gas7
80
70 Base Case, pAt) 60
50 -1- - - - - -.
Redesign Case, p,(t)
-40
Po--0. Redesign Case, 1T(t)
20 Base Case, u(t) 10
0
0 0.2 0.4 0.6 0.8 1
Dimensionless Time
Figure 1-3 Hydraulic and osmotic pressure profiles vs. dimensionless time elapsed in the
batch process. Solid lines show the pressure profiles for the base case where the hydraulic pressure is maintained constant. Dashed lines correspond to a batch process where the hydraulic pressure is increased at a rate that matches the osmotic pressure. The feed solution in each case is 35,000 ppm NaCl and the recovery ratio is 50%. The mean driving pressure difference is equal in both cases but the variance in driving pressure difference is lower in the redesigned case. Image taken from Thiel et al.6
billion m3) of gas were produced from shales in the US in 2012', this puts produced
water volumes in the long run at between 340,000 and 1,700,000 bbls/day or between
54,000 and 270,000 m3/day.
By and large these waters are disposed of, often through injection underground,
or recycled as a source of water for subsequent fracturing processes 1 . The rates of
reuse vary geographically and depend upon freshwater costs, transport costs, wastew-ater disposal costs (Fig. 1-4) in the locality. Central to the viability of wwastew-ater reuse is an understanding of how recycled water quality affects the chemistry and perfor-mance of fluids used in the fracturing process. The composition of waters flowing to the surface varies geographically .(Fig. 1-4) with total dissolved solids reaching levels
above 300,000 ppm in certain cases. At the present time various approaches to water
treatment exist with some advocating direct reuse high salinity waters, even up to
or even lower10. The key challenge in the long run is therefore to design a water treatment process whose costs, in addition to the costs of formulating the fracturing fluid, are minimised.
Bakken '- hm~ fPoue Ar
Fresh: 0.5-1 $/bbl n Id cad ata Marcellus
Disposal: 3 $/bb Fresh: 0.01-0.02 $/bbl Disposal: 15-18 $/bbl Barnett Fresh: 0.25-0.35 $/bbl Disposal: 0.75 $/bbl Haynesville ** uFresh: 0.25-0.35 $/bbl * n ' Disposal: 1.5 $/bbI Eagleford Fresh: 0.25-0.35 $/bbl Disposal: 2 $/bbl
Figure 1-4 Map illustrating the ranges of produced water total dissolved solids
concentrations from the U.S. Geological Survey's Produced Waters Database augmented with estimates of fresh water and disposal costs in major shale plays1 1"2
By and large, the current options for water treatment" are primary treatment
(involving solids and oil removal) at circa $1/bbl and distillation (providing a highly
pure product) at circa $3.5-6.25/bbl. Chapters 4 to 6 explore the possibility of a
third option; partial desalination using electrodialysis to a level of purity that falls between the extremes of primary treatment and complete desalination through dis-tillation. Chapter 4 provides a framework to understand the range of salinities where electrodialysis operates most cost effectively. Chapter 5 addresses the design and op-erational aspects of a high salinity electrodialysis process (operating in conjunction with reverse osmosis). Finally, Chapter 6 provides an experimental and economic study of electrodialysis over a range of salinities from 500 ppm to 192,000 ppm NaCl.
1.3
Brackish and industrial water desalination: The
challenges of high purity and high recovery
In the last 20 years, 6.3 million m3/day of brackish desalination plant capacity came
online treating waters containing between 500 ppm and 3,000 ppm of total dissolved solids. These volumes are equivalent to the domestic consumption of approximately
110 million people. The cost of water4 from these plants, of which 94% employed
reverse osmosis or nanofiltration technology', ranged between 0.1 and 1 $/m3. Of
particular importance is the large fraction of plants that provide high purity water to industry. Figure 1-5 shows that 46% of product water contained less than 10 ppm of total dissolved solids, which is 50 times more stringent than World Health
Organisation guidelines for drinking water'3.
Power stations ('I)S Other
/,,indUstry (TDS II Oppni) 10 Municipalities (TDS I Oppm -1 000ppn) 50%
Figure 1-5 Breakdown of brackish desalination plants online in the years 1994-2014
treating waters between 500 and 3,000 ppm TDS .
While high purity is one desirable aspect of a brackish desalination technology, a high ratio of water recovered to feed water, known as the recovery ratio, is a sec-ond. High recovery ratios reduce feed water requirements and also reduce the volume of waste that must be disposed of after the desalination process. One of the major challenges faced in brackish desalination is thus the design of a process that can
simul-taneously achieve the goals of high product purity and high product recovery. The two primary brackish desalination technologies, reverse osmosis and electrodialysis
(which accounts for 4% of installed capacity in Fig. 1-5), have undergone and are still undergoing adaptation to meet these goals. Traditional reverse osmosis technologies, which are based on water removal, achieve excellent product purity but require multi-ple membrane stages to remove high percentages of water. Adaptation of the process is currently taking place in the form of a batch reverse osmosis process, which can be implemented within the same stage". Electrodialysis, by contrast, easily achieves high water recovery as only salt is removed. However, high levels of purity are chal-lenging to achieve due to low electrical conductivity. In the case of electrodialysis, adaptation has involved the use of ion-conductivity spacers within flow channels in a process known as electrodeionisation15'16.
Rather than focus on either of the dominant brackish technologies alone Chapter
7 explores the idea of hybridising reverse osmosis and electrodialysis processes. The
objective is to leverage the synergy of water removal and salt removal technologies and achieve high purity high recovery processes at reduced cost.
1.4
In summary
The scale, cost, and economic significance of desalination is well illustrated by consid-ering the volume of water produced, its cost, and the product of these two quantites: the approximate market size. Figure 1-6 summarises this information and sets out the challenges and potential solutions according to the order with which they are addressed in Chapters 2 through 7.
Figure 1-6 Illustration of the water volumes, water costs, challenges faced in three key
desalination applications along with the solutions investigated within this thesis. Water volume and cost data are intended as a rough guide. Ranges for these values are provided in Sect. 1.1, 1.2 and 1.2. Per person water use is based on an average U.S. domestic water consumption of 336 litres per day in 20052
Bibliography
[1] Desaldata. Analysis, 2014. desaldata.com.
[2] Joan F Kenny, Nancy L Barber, Susan S Hutson, Kristin S Linsey, John K Lovelace, and Molly A Maupin. Estimated use of water in the United States in
2005. US Geological Survey Reston, VA, 2009.
[3] David Cohen-Tanugi, Ronan K McGovern, Shreya H Dave, John H Lienhard, and
Jeffrey C Grossman. Quantifying the potential of ultra-permeable membranes for water desalination. Energy & Environmental Science, 7(3):1134-1141, 2014. [4] Lauren F Greenlee, Desmond F Lawler, Benny D Freeman, Benoit Marrot, and
Philippe Moulin. Reverse osmosis desalination: water sources, technology, and today's challenges. Water research, 43(9):2317-2348, 2009.
[5] Sunny Wang Srinivas (Vasu) Veerapaneni, Ben Klayman and Rick Bond.
Desali-nation facility design and operation for maximum efficiency. Technical report, Water Research Foundation, 2011.
[6] Gregory P Thiel, Ronan K McGovern, Syed M Zubair, and John H Lienhard V.
Thermodynamic equipartition for increased second law efficiency. Applied
En-ergy, 118:292-299, 2014.
[7] Matthew E Mantell. Produced water reuse and recycling challenges and oppor-tunities across major shale plays. In Proceedings of the Technical Workshops for
the Hydraulic Fracturing Study: Water Resources Management. EPA, volume
[8] U.S. Energy Information Administration. Technically recoverable shale oil and
shale gas resources: An assessment of 137 shale formations in 41 countries outside the united states, June 2013.
[9] Renee LeBas, P Lord, D Luna, and T Shahan. Development and use of high-tds
recycled produced water for crosslinked-gel-based hydraulic fracturing. In 2013
SPE Hydraulic Fracturing Technology Conference, 2013.
[10] Proceedings and Minutes of the Hydraulic Fracturing Expert Panel XTO
Facili-ties, Fort Worth September 26, 2007.
[11] James A Slutz, Jeffery A Anderson, Richard Broderick, Patrick Harold Horner,
et al. Key shale gas water management strategies: An economic assessment. In International Conference on Health Safety and Environment in Oil and Gas
Exploration and Production. Society of Petroleum Engineers, 2012.
[12] Shawn Shipman, Drew McConnell, Morgan Paul Mccutchan, Kushal Seth, et al. Maximizing flowback reuse and reducing freshwater demand: Case studies from the challenging marcellus shale. In SPE Eastern Regional Meeting. Society of Petroleum Engineers, 2013.
[13] World Health Organization. Guidelines for drinking-water quality:
recommen-dations, volume 1. World Health Organization, 2004.
[14] Avi Efraty. Closed circuit desalination series no-4: High recovery low energy desalination of brackish water by a new single stage method without any loss of brine energy. Desalination and Water Treatment, 42(1-3):262-268, 2012.
[15] Jonathan Wood, Joseph Gifford, John Arba, and Michael Shaw. Production of
ultrapure water by continuous electrodeionization. Desalination, 250(3):973-976, 2010.
[16] GC Ganzi. Electrodeionization for high purity water production. In AIChE
[17] Menachem Elimelech and William A. Phillip. The future of seawater desalination:
Chapter 2
On the potential of forward
osmosis to energetically
outperform reverse osmosis
desalination
Abstract
We provide a comparison of the theoretical and actual energy requirements of forward osmosis and reverse osmosis seawater desalination. We argue that reverse osmosis is significantly more energy efficient and that forward osmosis research efforts would best be fully oriented towards alternate applications. The underlying reason for the inefficiency of forward osmosis is the draw-dilution step, which increases the theoret-ical hnd actual energy requirements for draw regeneration. As a consequence, for a forward osmosis technology to compete with reverse osmosis, the regeneration process must be significantly more efficient than reverse osmosis. However, even considering the optimisation of the draw solution and the benefits of reduced fouling during regen-eration, the efficiency of an optimal draw regeneration process and of reverse osmosis are unlikely to differ significantly, meaning the energy efficiency of direct desalination with reverse osmosis is likely to be superior.
Contributions
This chapter was co-authored by Prof. John Lienhard V and received financial sup-port from the Hugh Hampton Young Memorial Fellowship.
2.1
Introduction
Energy consumption accounts for approximately 20-35% of the total cost of water in reverse osmosis desalination of seawater', and a greater fraction when the price of electricity is high. In this context, forward osmosis, a technology with the benefit of operating at low pressures 2-9, has been promoted as an alternative to reverse osmosis.
Indeed, seawater desalination is very frequently cited as a motivating application for the study of forward osmosis; 17 of the 20 most cited articles that include the words 'forward' and 'osmosis' within their titles on the Thomson Reuters Web of Science
Database address seawater desalination2,4,5,8,0- 25. This level of interest in forward
osmosis for seawater desalination is surprising given that FO processes have higher theoretical and actual energy requirements than reverse osmosis, though this is seldom
acknowledged21 or analysed.
In this context, we perform an energetic comparison of reverse osmosis, the most energy efficient commercial desalination technology1, and forward osmosis, an indirect means of desalination, consisting of two steps; the dilution of a concentrated draw solution, and, its subsequent regeneration (Fig. 2-1). We outline how the draw-dilution step of Fig. 2-1 influences the theoretical and actual energy consumption of draw-regeneration, we assess how efficient draw-regeneration need be for forward osmosis to compete with reverse osmosis, and we outline what efficiency might be achievable by the most efficient draw-regeneration systems.
2.2
Thermodynamic limits upon draw
regenera-tion
The minimum theoretical energya required for the direct desalination of a feed stream depends upon the feed composition and the recovery ratio. For a seawater feed of 35,000 ppm total dissolved solids and a recovery of 50%, the theoretical energy
aThe 'minimum theoretical energy requirement', which may also be termed the 'minimum ther-modynamic energy requirement' or the 'reversible work requirement' will from here on, for brevity, be referred to as the 'theoretical energy'.
FO pressure concentrated draw brine vessels _n _dr / /I feed product dilute draw
draw-dilution
draw-regeneration
Figure 2-1 A two step desalination involving draw dilution by forward osmosis and a draw regeneration process
requirement2 7 of 1.05 kWh/m3 places single-stage seawater reverse osmosis, with an energy consumption' of about 2.5 kWh/m3, at a thermodynamic efficiency of about 42% (if pre-treatment, raw and treated water conveyance are excluded).
Since forward osmosis involves the initial transfer of water from the feed to a draw solution of higher osmotic pressure, the theoretical energy required for regeneration is different. Specifically, the theoretical energy required to remove an infinitesimal volume of pure water dV, from a solution at an osmotic pressure of 7 is 7wdVp. On a volumetric basis, say in J/m3 (equivalent to pascals), the minimum energy required is given by the osmotic pressure 7r. Thus, by first drawing water from a feed solution at
7
rF into a draw solution at 7TD, the theoretical energy required to produce pure water
increases by a factor of
rD/i7rF-The same arguments hold for a desalination process where a finite recovery (e.g.,
greater than infinitesimal) of the feed stream is desired. Figure 2-2 illustrates a counter-flow draw dilution process where the relative mass flow ratio of the feed and draw are controlled to facilitate a driving osmotic pressure difference that is close to uniform. The feed salinity is a 35,000 ppm NaCl solution and the inlet draw osmotic pressure is 78.5 bar. The draw solution in this case is modelled as NaCl, though this is in-consequent as an almost identical osmotic pressure profile may be
obtained with almost any draw solutionb by tailoring the mass flow rate ratio. To calculate the theoretical energy for water production, the product of osmotic pressure
and permeate production are integrated over the process:
ET = j , (Vp ) de ( 2.1)
0
RRtOt
SRRtOt
]
r(RR)dRR (2.2)0
Figure 2-3 illustrates the effect of the mean osmotic pressure ratio (r D rF -
aver-aged over water permeation through the membrane) in Fig. 2-2 upon the theoretical energy required for draw solution regeneration. The theoretical energy penalty is the difference between the theoretical energy required for direct desalination and the theoretical energy for draw regeneration. Both the magnitude of this energy penalty, and the total theoretical energy required for draw solution regeneration depend only on the osmotic pressure of the draw solution and not on its chemical composition.
The magnitude of the energy penalty increases rapidly with an increasing osmotic pressure ratio. At a mean pressure ratio of 2.3 (mean osmotic pressure differential of 50 bar), the theoretical energy requirements for a forward osmosis process reach
2.5 kWh/m3 - the actual energy requirement of energy efficient reverse osmosis plants. Therefore, if forward osmosis systems are to achieve energy efficiency that is comparable to RO, low osmotic pressure ratios during draw-dilution are a necessity.
2.3
An energetic comparison of FO and RO
While reverse osmosis is typically electrically driven, the regeneration process in for-ward osmosis may also be thermally or chemically driven. Rather than delve into the amortised equipment (e.g. solar collectors or waste-heat exchangers) and fuel costs for various different direct desalination and draw regeneration processes, we compare
bThe saturation osmotic pressure of the draw must be above the maximum desired osmotic pressure
i2 r2i Q 0 0 80 70 60 50 40 30 0 1 1 I 0 0.1 0.2 0.3 Recovery Ratio [-] 0.4 0.5 draw feed
Figure 2-2 Counterflow feed concentration and draw solution dilution forward osmosis
process. Feed stream of 35,000 ppm NaCl at 25'C. Draw solution of aqueous NaCl at an inlet osmotic pressure of 67.3 bar. Osmotic coefficients taken from Robinson and Stokes28
draw
feed
6
5-actual RO energy 4 2-1 2 3 4 5Mean osmotic pressure ratio
[-]
Figure 2-3 Effect of the mean osmotic pressure ratio upon the energy penalty imposed by draw solution dilution. Feed stream as in Fig. 2-2. Draw solution of aqueous NaCl with
the inlet osmotic pressure and mass flow rate varied to achieve desired mean osmotic pressure ratio.
FO and RO systems on the basis of their thermodynamic efficiencies. For the reverse osmosis process, the thermodynamic efficiency, 77R, is the ratio of the theoretical
en-ergy required to recover a defined portion of the feed water as a pure water product,
ET to the actual energy (or more strictly exergy29), E, required:
RRtot,RO
E RO RRtot,RO
f
sw (RR) dRRR = ER E. (2.3)
For a draw regeneration process q"-qg" differs only in that osmotic pressure of the draw solution, rather than of seawater, is integrated over the recovery ratio of the draw regeneration process:
RRtot ,regen
E Egen RRtot,regen f 7draw (RR) dRR
Eregen Ere(2
Eregen is the exergy required to drive the actual regeneration process, which for an
electrically driven process equals the electrical energy required and for a thermally driven process is related, by the dead state temperature, To, and the temperature,
Tsource, at which heat, Qr'e, is supplied, by:
Eregen T_ o- Qregen. (2.5)
T source
Thus, for a draw regeneration process, ,rgen relates the theoretical energy required
to restore the draw solution from its most diluted to its most concentrated state, to the actual energy required (again on a Second Law basis).
In our comparison, we parametrise the thermodynamic efficiency of both reverse
osmosis and draw regeneration using 77R. We consider the desalination of a 35,000
ppm stream of NaCl, with RO and FO systems at a recovery of 50%. For the draw
dilution process we consider a mean osmotic pressure difference of 19.4 bar (osmotic
pressure ratio of approximately 1.5). This driving force is based on the net driving pressure for a typical seawater reverse osmosis system, 2.A. A larger (smaller) osmotic
10
E
8
forward osmosis
47% 70% 2.34 kWh/M3 2 0 0 20 40 60 80 100 Regeneration efficiency, TjR[%]
Figure 2-4 Effect of the efficiency of the draw regeneration process upon overall energy
consumption. Feed stream of 35,000 ppm NaCl at 25'C and recovery ratio of 50% in all cases. Draw solution of aqueous NaCl with inlet osmotic pressure of 78.5 bar. The energy consumption of a typical single pass reverse osmosis system is indicated.
pressure difference would result in a lower (higher) forward osmosis capital costs but higher (lower) theoretical and actual energy penalties. Setting the mean driving force in forward osmosis equal to that in reverse osmosis is perhaps conservative since flux is lower in FO (at the same driving pressure difference) due to concentration
polarisation 2 and thus area requirements would be higher 0.
Figure 2-4 illustrates the actual energy consumption of the RO and FO systems. Whereas the theoretical energy penalty for a draw dilution desalination process is shown in Fig. 2-3, the actual energy penalty is shown, in green, in Fig. 2-4. The actual energy penalty is calculated as the theoretical energy penalty divided by the regeneration/direct-desalination efficiency. Its presence means that the actual energy consumption of forward osmosis is always above that of reverse osmosis if reverse osmosis and the draw regeneration process operate at the same efficiency.
To perform a more complete comparison we can compare the energy consumption for a forward osmosis system and a two-pass reverse osmosis system that includes
Table 2.1 Comparison of two-pass reverse osmosis with forward osmosis assuming 47%
efficiency for the first RO pass and for draw regeneration. 35,000 ppm NaCl feed A 50% recovery.
Two-pass RO FO
kWh/m3 kWh/M3
Ultra-filtration 0.16 Draw dilut. 0.10
RO - 1st Pass 2.34 Draw regen. 3.48
RO - 2nd Pass 0.50
-Total 3.00 Total 3.58
pre-treatment, Table 2-3. Experiments suggest that forward osmosis exhibits lower rates of irreversible fouling than reverse osmosis31 and thus might be expected to cope
with lower levels of pre-treatment. As a limiting case we can neglect pre-treatment for forward osmosis and consider ultrafiltration pretreatment for reverse osmosis, estimating pumping power consumption of 0.1 and 0.3 kWh/m3 respectively 2.B.
Assuming the FO draw regeneration process to be just as efficient as RO leads to an energy requirement of 3.48 kWh/m3 for draw regeneration, compared to 2.34 kWh/M3 for the first pass of reverse osmosis (from Fig. 2-4). Thus, even allowing
for the additional energy typically consumed in a second pass of reverse osmosis (0.5
kWh/M3)32 ,33, the total energy consumption of reverse osmosis remains lower than
forward osmosis.
2.4
An analysis of RO as a regeneration process
for FO
According to Fig. 2-4, a single pass RO system must operate at an efficiency of
TIR=47% to achieve a specific energy consumption of 2.34 kWh/M3 (the energy con-sumption of a representative seawater RO process, see 2.A). To match this perfor-mance, the regeneration portion of a forward osmosis system must achieve regener-ation at an efficiency of IIR=70% - an increase of 23 percentage points. Since RO is currently the most energy efficient of desalination systems2 7 (thermal regeneration
systems are estimated to achieve about 6-8% efficiencyc and, in the case of a ther-mally regenerated ammonia-carbon dioxide solution, energy requirements for a final reverse osmosis purification step may further reduce efficiency35.) it is therefore
im-portant to analyse whether reverse osmosis, operating as a draw regeneration system, can significantly outperform reverse osmosis as a direct desalination system3 6. Five
factors to consider include the possibilities of:
1. employing higher permeability nano-filtration membranes.
2. increasing permeability through optimisation of the draw solution composition;
3. increasing permeability by optimising temperature;
4. lower levels of fouling as a result of treating a clean draw rather than feed seawater; and
5. reducing feed flow rates per vessel (and thus energy consumption) due to lower
fouling.
Although nano-filtration membranes offer superior permeability, they exhibit infe-rior solute rejection to reverse osmosis membranes. For example, the nominal CaCl2 rejection of nanofiltration membranes is typically in the range of 89%31, compared to normalised NaCl rejections of 99.8%38 for RO membranes. Thus, the use of nanofil-tration necessitates multiple passes of filnanofil-tration39 or draw solutes that are large in
size4 0. Unfortunately, larger molecules (such as sucrose and glucose) typically exhibit lower diffusivities than NaCl, which result in stronger concentration polarisation and reduced flux in the draw dilution step. This is particularly true when the FO mem-brane is oriented in forward osmosis mode4 1, as is typically necessary to minimise cFor seawater desalination at 50% recovery, Semiat et al. estimated energy requirements of 13 kWh/M3, leading to an efficiency of 1.1/13 = 8%3. For 50% recovery of a 73,000 ppm NaCl feed stream in pure form, an actual auxilliary system power of 8.5 kWh/m3 and an electrical input of 21 kWh/M3 for mechanical vapor compression was reported by McGinnis35. Based upon a theoretical minimum requirement of 1.9 kWh/m3 this suggests an efficiency of 6%. While the use of low temperature waste heat may reduce fuel costs, the capital costs of heat exchangers required to capture waste heat are typically prohibitive (see 2.C).
Table 2.2 Influence of temperature, fouling and cross-flow optimisation on reverse
osmosis efficiency, computed using membrane projection software4 4
with a 35,000 ppm
NaCl feed and operating at 50% recovery (see 2.A).
-temp. fouling membranes/ average theoretical actual efficiency factor vessel flux spec. energy spec. energy
[0 C] [-] [-3 [lmh] [kWh/M3] [kWh/M3]
[-3
direct desalination 25 0.8 6 13.5 1.1 2.34 47% temperature 40 0.8 6 13.5 1.1 2.27 +1.4% pts
fouling 25 0.91 6 13.5 1.1 2.30 +0.8% pts
cross-flow 25 0.8 5 13.5 1.1 2.33 +0.2% pts fouling 7 42 . Thus, while large solutes such as glucose may allow the use of
nanofil-tration membranes, flux in the draw-dilution step is significantly reduced compared
39
to using an NaCl draw solution of the same osmotic pressure
An analysis of the effect of feed solution chemistry on the permeability of re-verse osmosis membranes4 3 revealed that permeability decreased with increasing ionic
strength. Since the draw solution must be of higher concentration than the feed wa-ter, and thus typically of higher ionic strength, this suggests that RO regeneration is at a disadvantage compared to direct reverse osmosis treatment of the feed; at least if the draw solution is ionic. As previously discussed, non-ionic draw solutes (such as glucose and sucrose) are undesirable as they increase the membrane area required in the draw dilution step.
To analyse the effects of temperature, fouling and cross-flow optimisation upon energy consumption we perform comparative analyses of RO systems using membrane projection software44. Holding constant the feed composition and recovery ratio we vary the feed temperature, the fouling factor and the number of membrane elements per vessel one by one, as indicated in Table 2.2.
In FO-RO processes, since the draw solution is recirculated it can potentially be maintained at a temperature above that of the feed", with the objective of increasing membrane permeability. However, this effect is mitigated, particularly at tempera-tures above 250C, by the increase in osmotic pressure with temperature46. Thus, the overall enhancement in efficiency in going from 25 to 40'C, 1.4% pts, is small.
When operating as a draw regeneration process, RO benefits from lower fouling rates than a direct seawater desalination process. The levels of fouling (flux reduced to 91% of nominal after 3 years4 ) might be considered similar to that of the second
pass in a two pass RO system4 5, rather than the levels of fouling seen when treating
seawater from an open intake (flux reduced to 80% of nominal after 3 years4 4). A
comparison of the energy consumption reveals that the improvement in efficiency, of
0.8% pts, remains small. While this analysis focuses on energy consumption it is true
that there may be cost benefits if membrane replacement is reduced in hybrid FO-RO processes. However, the contribution of energy to the cost of water can be five times more important than the cost of membrane replacement, as seen in the analysis of Reddy and Ghaffour.
A further benefit arising from reduced fouling is a relaxation of the requirement
for a minimum brine cross-flow velocity to reduce fouling4 in the reverse osmosis unit
used for draw regeneration. Holding the average flux constant, this would allow for operation with a larger number of shorter pressure vessels (fewer elements per vessel). The reduced viscous pressure drop within shorter vessels with reduced flow rates can allow for a slight reduction in feed pressure and energy consumption. However the improvement in efficiency, +0.2% pts, is small, in part due to the strengthening of concentration polarisation at lower cross flow velocities.
Ultimately, the draw-dilution step requires draw regeneration to be significantly more efficient (+23% pts) than direct reverse osmosis desalination if the overall energy consumption of forward osmosis is to be comparable. Though reductions in fouling and the optimisation of temperature can enhance the regeneration efficiency, these effects are an order of magnitude smaller than what is required. It appears, therefore, that forward osmosis is better suited to applications other than seawater desalination, particularly those where reverse osmosis cannot directly compete.
2.5
Comments on alternate forward osmosis
appli-cations
One implication of the energy penalty, imposed by draw dilution, is that forward osmosis research might increasingly focus on regeneration-free applications48, e.g.,
where the draw solution is a nutrient containing drink49, a concentrated fertilizer,
or a kill fluid for hydraulic fracturing51. Forward osmosis processes that dilute rather than concentrate the feed stream are a second option, whereby forward osmosis is used to dilute seawater feeds, prior to reverse osmosis desalination, by employing a low salinity 'impaired' source of water5 2. This dilution provides an energy benefit
compared to direct desalination of seawater but an energy penalty compared to the direct desalination of the impaired stream. Perhaps the viability of pre-dilution will be decided by weighing the benefits of a dual-barrier FO-RO system versus the benefits of avoiding the energy penalty of draw-dilution in single-barrier RO desalination of the impaired stream.
Desalination applications where the osmotic pressures of feeds are too great for existing reverse osmosis technologies are also potentially promising for forward os-mosis' 5 . Here, the alternatives to forward osmosis that desalinate feed streams
directly are primarily evaporative technologies with efficiencies that draw regenera-tion processes can potentially surpass35. Meanwhile, evaporative technologies may well improve in efficiency56 57 and reverse osmosis may increase its reach in terms of osmotic pressure, perhaps through tiered processes58, but until then forward osmosis may offer energetic advantages at salinities higher than seawater.
2.6
Conclusion
The draw dilution step in forward osmosis desalination systems places the draw regen-eration process at a significant energetic disadvantage compared to direct desalination of the feed stream with reverse osmosis. Even with optimisation of the draw solution, and the benefit of reduced fouling in the regeneration step, the overall forward osmosis
Table 2.3 Seawater reverse osmosis projection44
Feed source open seawater intake Feed TDS 35,000 ppm NaCl
Feed temperature 250C
Recovery 50%
Membranes SWC5
Elements/vessel 6
Pressure recovery isobaric Average flux 13.5 lmh
Net driving pressure 19.4 bar Specific energy 2.34 kWh/M3
process is unlikely to approach the energy efficiency of reverse osmosis for seawater desalination. In this light, it appears best for forward osmosis research to focus fully on high salinity applications and applications that do not require draw regeneration, where reverse osmosis cannot compete.
2.A
Seawater Reverse Osmosis Example
Basic input parameters for the base seawater reverse osmosis case are provided in Tab. 2.3. A detailed list of parameters is provided in the Supplementary Electronic Information for this base case as well as the three other cases of Tab. 2.2.
2.B
Ultrafiltration and forward osmosis pumping
power estimations
The maximum transmembrane pressure in ultrafiltration is in the region of 2 bar". Assuming close to 100% recovery of water from the ultrafiltration unit and a pump efficiency of 70% this leads to power consumption of approximately 0.16 kWh/M3 of
product water from the entire system.
To estimate the pressure difference between the feed inlet and outlet and the draw inlet and outlet we employ the pressure difference of 0.6 bar between the feed inlet and the brine outlet in the RO base example of 2.A. Assuming a pump efficiency of
70% this leads to an energy consumption of approximately 0.10 kWh/m3.
2.C
Evaluation of heat exchanger costs in waste
heat driven forward osmosis applications
Fuel costs may be minimal when low temperature waste heat is employed to drive a desalination process. However, the cost of heat exchangers required to capture waste heat is significant. This is largely because the lower the temperature of the heat source, the lower its exergy, and, consequently, the larger the amount of heat required and the higher the heat exchanger costs. For example, if we consider a draw solution regeneration process requiring reen=1 3 kWh of exergy per m3 of product
water desalinated (the electrical energy requirement computed by Semiat et al. for a thermally regenerated seawater forward osmosis process34), we can compute the heat
exchanger size, PHX [in kWt/(m3/day)] theoretically required for the process to be
thermally driven by a heat source at temperature Tso.ce-Eregen day
PHX = - T0 X hr (2.6)
To , hr
where To is the ambient temperature. The capital cost of the heat exchangers re-quired can then be obtained by considering the cost of heat exchangers on a $/kWt basis, which, according to a recent report, can fall roughlyd within the range of $500-2,000/kWt 6. In Fig. 2-5 we illustrate how the cost and size of the heat ex-changers required depends upon the heat source temperature assuming, conserva-tively, a heat exchanger cost of $500/kWt. At low temperatures, the capital cost of heat exchangers becomes very large, in fact, much larger than the capital costs of multi-effect distillation plants47 (or reverse osmosis plants for that matter, typically
$600-800/(m 3/day) 47). Thus, unless low temperature draw regeneration (or
desalina-tion) processes can be developed with significantly lower exergetic requirements (or
dThis range depends in part on whether heat exchange occurs between two liquids, a liquid and a condensing fluid or a liquid and an evaporating fluid.
20,000 40 35,000 ppm feed 50% recovery 15,000 - 8.5% 2nd law efficiency 30 HX cost =$500/kW .O o 10,000 20 5,000 -- 10 0 0 0 seawater MED 0 20 40 60 80 100 120 140 capital costs, T0 =25 C 850 $/(m3/day)
Heat source temperature, pource [OC]
Figure 2-5 When using low temperature heat sources to drive desalination the total heat
input required, and thus heat exchanger size and costs, become very large. Here, heat exchanger costs are compared to typical capital costs for large scale multi-effect distillation systems4 7.
equivalently, significantly higher 2nd law efficiencies than existing thermal processes such as those documented by Mistry et al.29) heat exchanger costs pose a major
barrier to desalination using waste heat.
Bibliography
[1] S. W. Srinivas (Vasu) Veerapaneni, Ben Klayman, R. Bond, Desalination
fa-cility design and operation for maximum efficiency, Tech. rep., Water Research Foundation (2011).
[2]
Q.
Yang, K. Y. Wang, T.-S. Chung, Dual-layer hollow fibers with enhanced flux as novel forward osmosis membranes for water production, Environmental science & technology 43 (8) (2009) 2800-2805.[3] M. M. Ling, K. Y. Wang, T.-S. Chung, Highly water-soluble magnetic
nanopar-ticles as novel draw solutes in forward osmosis for water reuse, Industrial & Engineering Chemistry Research 49 (12) (2010) 5869-5876.
[4] W. A. Phillip, J. S. Yong, M. Elimelech, Reverse draw solute permeation in for-ward osmosis: modeling and experiments, Environmental science & technology 44 (13) (2010) 5170-5176.
[5] R. Wang, L. Shi, C. Y. Tang, S. Chou, C. Qiu, A. G. Fane, Characterization
of novel forward osmosis hollow fiber membranes, Journal of Membrane Science
355 (1) (2010) 158-167.
[6] T.-S. Chung, S. Zhang, K. Y. Wang, J. Su, M. M. Ling, Forward osmosis
pro-cesses: yesterday, today and tomorrow, Desalination 287 (2012) 78-81.
[7] J.-J. Qin, W. C. L. Lay, K. A. Kekre, Recent developments and future challenges
of forward osmosis for desalination: a review, Desalination and Water Treatment
[8] S. Zhao, L. Zou, C. Y. Tang, D. Mulcahy, Recent developments in forward
os-mosis: Opportunities and challenges, Journal of Membrane Science 396 (2012) 1-21.
[9] C. Boo, S. Lee, M. Elimelech, Z. Meng, S. Hong, Colloidal fouling in forward
osmosis: role of reverse salt diffusion, Journal of Membrane Science 390 (2012)
277-284.
[10] T. Y. Cath, A. E. Childress, M. Elimelech, Forward osmosis: Principles,
appli-cations, and recent developments, Journal of membrane science 281 (1) (2006)
70-87.
[11] J. R. McCutcheon, R. L. McGinnis, M. Elimelech, A novel ammoniacarbon
diox-ide forward (direct) osmosis desalination process, Desalination 174 (1) (2005)
1-11.
[12] J. McCutcheon, M. Elimelech, Influence of concentrative and dilutive internal concentration polarization on flux behavior in forward osmosis, Journal of Mem-brane Science 284 (1) (2006) 237-247.
[13] J. R. McCutcheon, R. L. McGinnis, M. Elimelech, Desalination by
ammonia-carbon dioxide forward osmosis: influence of draw and feed solution concen-trations on process performance, Journal of Membrane Science 278 (1) (2006) 114-123.
[14] N. Y. Yip, A. Tiraferri, W. A. Phillip, J. D. Schiffman, M. Elimelech, High per-formance thin-film composite forward osmosis membrane, Environmental Science
& Technology 44 (10) (2010) 3812-3818.
[15] G. T. Gray, J. R. McCutcheon, M. Elimelech, Internal concentration polarization
in forward osmosis: role of membrane orientation, Desalination 197 (1) (2006)
1-8.