HAL Id: hal-00317380
https://hal.archives-ouvertes.fr/hal-00317380
Submitted on 1 Jan 2002
HAL is a multi-disciplinary open access
archive for the deposit and dissemination of
sci-entific research documents, whether they are
pub-lished or not. The documents may come from
teaching and research institutions in France or
abroad, or from public or private research centers.
L’archive ouverte pluridisciplinaire HAL, est
destinée au dépôt et à la diffusion de documents
scientifiques de niveau recherche, publiés ou non,
émanant des établissements d’enseignement et de
recherche français ou étrangers, des laboratoires
publics ou privés.
Global morphology of night-time NmF2 enhancements
A. F. Farelo, M. Herraiz, A. V. Mikhailov
To cite this version:
A. F. Farelo, M. Herraiz, A. V. Mikhailov. Global morphology of night-time NmF2 enhancements.
Annales Geophysicae, European Geosciences Union, 2002, 20 (11), pp.1795-1806. �hal-00317380�
Annales
Geophysicae
Global morphology of night-time NmF2 enhancements
A. F. Farelo1, M. Herraiz1, and A. V. Mikhailov2
1Department of Geophysics and Meteorology, Faculty of Physics, Complutense University, E-28040 Madrid, Spain 2Institute of Terrestrial Magnetism, Ionosphere and Radio Wave Propagation, Russian Academy of Sciences, Troitsk,
Moscow Region, Russia
Received: 19 September 2001 – Revised: 23 May 2002 – Accepted: 28 May 2002
Abstract. An overall statistical study of night-time
enhance-ments of NmF2 has been carried out. All available foF2 ob-servations since 1955 at 53 ionosonde stations distributed worldwide in the latitude range φgeom = 15◦−60◦ were
used in the analysis. More than 200 000 station-nights of data were analysed. This large data base allowed us to study sea-sonal, solar cycle and spatial variations of the NmF2 night-time enhancements. Both pre-midnight and post-midnight
NmF2 peaks demonstrate distinct variations with
geophysi-cal conditions, indicating different physigeophysi-cal mechanisms re-sponsible for their formation.
Key words. Ionosphere (mid-latitude ionosphere, ionosphere-magnetosphere interactions) Radio science (ionospheric physics)
1 Introduction
Night-time enhancements of electron concentration are typi-cal phenomena of the F2-layer in middle latitudes that can be observed both in the maximum of electron concentra-tion in the F2-layer (NmF2) and total electron content (TEC) (Arendt and Soicher, 1964; Evans, 1965; Da Rosa and Smith, 1967; Bertin and Papet-Lepine, 1970; Young et al., 1970; Titheridge, 1973; Tyagi, 1974; Davies et al., 1979; Ivanov-Kholodny and Mikhailov, 1986; Balan and Rao, 1987; Joshi and Iyer, 1990; Lois et al., 1990; Jakowski et al., 1991; Jakowski and F¨orster, 1995; Mikhailov and F¨orster, 1999; Mikhailov et al., 2000a, b). Although NmF2 and TEC varia-tions usually exhibit similar behaviour in the night-time iono-sphere, there are some differences in the occurrence of these variations and in the treatment that has been applied to their analysis (Tyagi, 1974; Lois et al., 1990). Two peaks (pre-and post-midnight) in the NmF2 (pre-and TEC daily variations are considered here, analysing such characteristic parameters as: occurrence probability, time of occurrence and amplitude,
to-Correspondence to: M. Herraiz (mherraiz@fis.ucm.es)
gether with their geographic, seasonal and solar activity de-pendences.
Different mechanisms have been proposed to explain the observed variations. However, the results of previous analy-ses have often been contradictory. While Rao et al. (1982) found that for stations in Asia the amplitudes of both en-hancements are higher during solar maximum; according to Titheridge (1973) and Tyagi (1974), the opposite tendency is observed. Jakowski et al. (1991) pointed out a higher oc-currence probability of night-time enhancements of electron concentration during winter and solar minimum for observa-tions in Havana, and a reversal of this behaviour during solar maximum with higher probabilities in summer, which agrees with Rao et al. (1982) but contradicts Titheridge (1973) and Tyagi (1974). Different conclusions are also reached when the local time of occurrence and the duration of NmF2 en-hancements are studied.
It should be stressed that in previous publications devoted to this problem the authors considered either one or two in-creases of electron concentration at night but in quite differ-ent ways. In some papers no distinction was made between pre- and post-midnight enhancements and only one peak (the one with the higher amplitude) was considered, even though the presence of both was mentioned (Young et al., 1970; Titheridge, 1973; Tyagi, 1974; Balan and Rao, 1987; Joshi and Iyer, 1990). Other researchers treated these increases separately in their statistical studies, but only one was con-sidered for each night (Jakowski et al., 1991; Jakowski and F¨orster, 1995). In our study both increases are considered separately, following a method of data analysis similar to one used previously by Mikhailov et al. (2000a, b). Compar-isons with results of previous studies based on other methods should be made with caution.
Another important point to be considered is that previous analyses are quite limited either geographically or tempo-rally, lacking complete seasonal and solar activity coverage or being restricted to a single station. Only Mikhailov et al. (2000a) made an extensive study over four solar cycles for four stations in the Eurasian region.
1796 A. F. Farelo et al.: Global morphology of night-time NmF2 enhancements
Table 1. List of stations and data samples used in alphabetical order
Station Station Code Latitude (◦) Longitude (◦) Geomagnetic Geomagnetic Year range Number of Latitude (◦) Longitude (◦) Data
Akita AK 39.70 140.10 29.83 207.00 1957 1988 4169 Alma Ata AA 43.20 76.90 33.46 152.00 1957 1989 5219 Arenosillo EA 37.10 353.20 41.32 72.40 1975 1997 993 Ashkhabad AS 37.90 58.30 30.37 134.70 1957 1995 3419 Bekescsaba BH 46.70 21.20 45.19 103.40 1964 1989 2111 Boulder BC 40.00 254.70 48.89 318.50 1958 1997 5993 Brisbane BR −27.50 152.90 −35.33 228.50 1955 1986 4719 Camden CN −34.00 150.70 −42.06 227.50 1980 1995 1190 Canberra CB −35.30 149.10 −43.57 226.10 1955 1994 5960 Cape Kennedy CC 28.40 279.40 39.46 348.70 1958 1989 634 Christchurch GH −43.60 172.80 −47.69 254.20 1957 1994 3745 Concepcion CP −36.60 287.00 −25.35 357.90 1957 1979 2638 Dourbes DB 50.10 4.60 51.65 89.00 1957 1997 6455 Gorki GK 56.10 44.30 50.18 127.80 1958 1989 3840 Grahamstown GR −33.30 26.50 −33.97 89.70 1973 1997 2883 Graz GZ 47.10 15.50 46.67 98.20 1958 1981 1762 Hobart HO −42.90 147.30 −51.29 226.10 1955 1997 5550 Irkutsk IR 52.50 104.00 41.88 175.70 1957 1997 5702 Johannesburg JO −26.10 28.10 −27.42 94.40 1957 1991 4290 Juliusruh/R¨ugen JR 54.60 13.40 54.21 99.90 1957 1998 6013 Kaliningrad KL 54.70 20.60 52.94 106.60 1964 1994 5182 Karaganda KR 49.80 73.10 40.35 149.90 1964 1989 3552 Kerguelen KG −49.40 70.30 −57.49 130.30 1965 1988 1501 Khabarovsk KB 48.50 135.10 38.17 201.50 1959 1993 2810 Kiev KV 50.50 30.50 47.12 113.50 1964 1992 4347 Lannion LN 48.80 356.60 51.97 80.40 1971 1998 3407 Leningrad LD 59.90 30.70 56.02 118.40 1957 1998 5098 Lisbonne LE 38.70 350.70 43.33 70.30 1987 1992 776 Magadan MG 60.00 151.00 50.94 211.80 1968 1997 3879 Maui MA 20.80 203.50 21.19 269.80 1957 1994 7150 Miedzeszyn MZ 52.20 21.20 50.45 105.80 1958 1975 2072 Moscow MO 55.50 37.30 50.73 121.60 1957 1998 7710 Mundaring MU −32.00 116.40 −43.16 188.20 1959 1994 5109 Norfolk NI −29.00 168.00 −34.35 244.80 1964 1994 4687 Novokazalinsk NK 45.50 62.10 37.35 139.70 1964 1989 3289 Observatori de L’Ebr EB 40.80 0.30 43.56 80.90 1956 1998 1785 Ottawa OT 45.31 284.01 56.60 353.30 1955 1993 4891 Point Arguello PA 35.60 239.40 42.30 302.70 1969 1997 4724 Rome RO 41.80 12.50 42.15 93.30 1958 1997 4846 Rostov RV 47.20 39.70 42.34 120.50 1957 1998 2747 Slough SL 51.50 359.40 54.00 84.60 1957 1995 6384 Sofia SQ 42.70 23.40 40.92 104.40 1964 1998 4334 St Johns SJ 47.60 307.30 58.15 23.20 1957 1980 1916 Sverdlovsk SV 56.40 58.60 48.46 139.70 1957 1995 6347 Tahiti TT −17.70 210.70 −15.16 284.60 1971 1989 2259 Tashkent TQ 41.30 69.60 32.31 145.40 1961 1998 4411 Tokio TO 35.70 139.50 25.80 206.90 1957 1991 5196 Tomsk TK 56.50 84.90 46.04 160.80 1957 1997 6479 Townsville TV −19.70 146.90 −28.44 220.70 1955 1997 3864 Uppsala UP 59.80 17.60 58.28 107.00 1957 1998 4265 Wakkanai WK 45.40 141.70 35.63 207.50 1957 1988 4147 Wallops Is. WP 37.80 284.50 49.01 354.20 1967 1997 3429 Yamagawa YG 31.20 130.60 20.64 199.40 1957 1988 4389
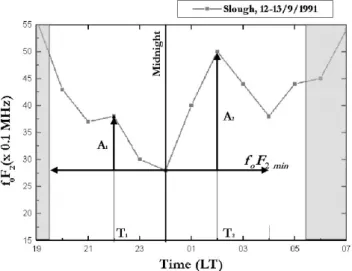
Fig. 1. Definition of each of the two peaks and their characteristic
parameters from the original foF2 data. Shadowed rectangles show sunlit time.
Consequently, the contradictions between the results of previous analyses may be due to geographical variations in the morphology of enhancements and to the different meth-ods of data treatment used by the different authors. These contradictions point to the necessity for a broader investiga-tion of the phenomenon that considers a wide range of sea-sonal and solar conditions and mid- to low-latitudes.
Various physical processes have been suggested to explain the formation of night-time electron concentration enhance-ments. The most important are: (1) plasma fluxes from the plasmasphere (Hanson and Ortenburger, 1961; Evans, 1965, 1975; Titheridge, 1968; Jain and Williams, 1984; F¨orster and Jakowski, 1988; Jakowski et al., 1991; Jakowski and F¨orster, 1995; Mikhailov and F¨orster, 1999); (2) raising of the F2-layer to higher altitudes (where the recombination rate is smaller) by electric fields and thermospheric winds (Young et al., 1970; Standley and Williams, 1984; Hedin et al., 1991; Titheridge, 1995; Mikhailov et al., 2000a, b). Other less im-portant processes are plasma transfer from conjugate points (Wickwar, 1974; Balan et al., 1994) and night-time ioniza-tion at the top of the ionosphere at high latitudes (Titheridge, 1968; Leitinger et al., 1982). All of these physical pro-cesses are also among the main mechanisms that generate the night-time F2-layer. Therefore, a proper understanding of the night-time F2 enhancements can make a significant contribution to knowledge of how the night-time F2-layer is formed.
The main goal of this paper can be defined as a morpho-logical study of the night-time NmF2 enhancements using all available worldwide, ground-based ionosonde observations for the last 3–4 solar cycles in both hemispheres. No de-tailed physical interpretation of the morphological features revealed is attempted here. This will be done elsewhere.
2 Data analysis
The method used to select and specify each of the two night-time peaks is similar to the one described by Mikhailov et al. (2000a, b). All hourly values of the F2-layer critical fre-quency (foF2) available at the World Data Center for STP at Chilton (WDC) from 53 ionosonde stations for the period since 1955 were analysed. This covers four solar cycles at many of the stations used. The locations of the ionosonde sta-tions selected cover the 15◦to 60◦range of geomagnetic lati-tude in both hemispheres, and all longitudinal sectors. Coor-dinates of the stations used are listed in Table 1. Night-time observations were selected according to solar zenith angle. Each NmF2 enhancement was identified by the presence of a relative maximum in hourly foF2 values, as shown in Fig. 1. Maximum electron concentration, NmF2, is known to be re-lated to the critical frequency, foF2, by the expression
NmF2 = 1.24 · 104·(foF2)2cm−3. (1)
Each NmF2 peak revealed in this way was specified by three parameters: occurrence probability, amplitude (rela-tive to the minimum electron concentration for the particu-lar night) and local time of occurrence. Amplitude of the enhancement was defined as
Amplitude1, 2= [foF2max1, 2/foF2min]2, (2)
where foF2max1, 2 are the critical frequencies at the two
possible peaks: pre-midnight (foF2max1) and post-midnight
(foF2max2), and foF2min is the minimum critical frequency
through the time between sunset, defined by solar angle
>95◦, and 04:00 LT.
One-hour gaps in the data were filled in using neighbour-ing values. Nights with gaps lastneighbour-ing two or more hours were rejected. To avoid the effects of solar illumination during summer nights, only periods when the solar zenith angle was greater than 95◦ were considered. Only magnetically quiet days (Ap <12) were analysed, though night-time
en-hancements have also been observed during disturbed pe-riods (Mikhailov and F¨orster, 1999). These filtering pro-cesses reduced the number of available observations (nights) to those shown in Table 1.
For statistical analysis, all available data were binned ac-cording to season and solar activity level: summer (May– August), equinox (March, April, September and October) and winter (November–February) for the Northern Hemi-sphere, changing summer for winter months for Southern Hemisphere stations; and three levels of solar activity: high (1957–1959; 1968–1970; 1979–1981; 1989–1991; 1999– 2001), medium (1955; 1956; 1960–1963; 1966; 1967; 1971– 1974; 1977; 1978; 1982–1984; 1987; 1988; 1992–1995; 1998) and low (1964; 1965; 1975; 1976; 1985; 1986; 1996; 1997). This classification gives nine gradations (3 seasons × 3 solar activity levels), which were applied to each station.
1798 A. F. Farelo et al.: Global morphology of night-time NmF2 enhancements Southern Hemisphere Northern Hemisphere a) Southern Hemisphere Northern Hemisphere b) Southern Hemisphere Northern Hemisphere c)
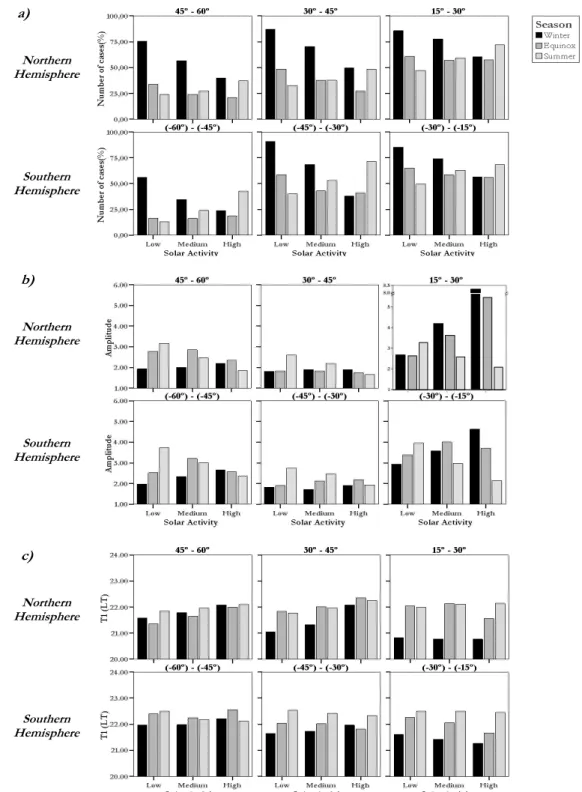
Fig. 2. Seasonal and solar variations of characteristic parameters of the first (pre-midnight) peak. Solar activity is classified in three levels:
high solar activity (High), medium solar activity (Medium) and low solar activity (Low). Seasonal variability is arranged in three categories: winter, summer and equinox. See the text for details. (a) Probability of occurrence, (b) relative amplitude, (c) local time of occurrence; for 6 geomagnetic latitude ranges. Bars represent means. Negative latitudes represent Southern Hemisphere positions.
3 Results
Two different kinds of analysis were carried out for the se-lected stations. First, seasonal and solar variability were studied in different bands of geomagnetic latitude.
Sec-ond, spatial variations of selected features were analysed. It should be stressed that only by using a sufficient amount of data for each of the conditions considered is it possible to ob-tain reliable results. This was achieved by using 53 stations, most of which cover a wide temporal range. Even after
fil-tering for disturbed days and data gaps, the total amount of data is over 200 000 station-nights. This gives an indication of the reliability of the results obtained. The main results are summarized in Tables 2 and 3.
3.1 Solar cycle and seasonal variation
To analyse the seasonal and solar cycle variations of the six parameters selected (occurrence probability, relative ampli-tude and local time of occurrence of each of the two peaks), nights were classified according to their season and solar ac-tivity level. Average values of the parameters for each of the gradations considered are shown for the first (pre-midnight) enhancement (Figs. 2a–c) and for the second (post-midnight) enhancement (Figs. 3a–c) for all 53 stations grouped into six geomagnetic latitude ranges. The corresponding numerical values are listed in Table 2. Data being grouped by latitude allows us to study the latitudinal dependence of seasonal and solar cycle variations.
3.1.1 First peak (pre-midnight)
The occurrence probability of the first peak (Fig. 2a) shows a clear seasonal dependence, tending to be higher in winter than in summer. There is also a clear dependence on solar ac-tivity level, with a higher probability during the years around solar minimum. However, in summer the peaks are more fre-quent during solar maximum. This is related to an upsurge in the occurrence probability associated with the months around the summer solstice (June–July in the Northern Hemisphere, December–January in the Southern). This was noted earlier by Mikhailov et al. (2000a) for the Northern Hemisphere. The effect is especially pronounced at high latitude stations. A latitudinal variation can be seen in Fig. 2a, with maximum occurrence probability at lower geomagnetic latitudes.
The variation of the relative amplitude (Npeak/Nmin) for
the first peak (Fig. 2b) does not show such a clear pattern as does that of the occurrence probability. The graphs show a complicated pattern; the amplitude of winter peaks increases along with solar activity, whereas in summer the behaviour is the reverse. The largest peaks occur at low latitudes, espe-cially in winter and near solar maximum. Large amplitudes are also observed during equinox at lower latitudes. It should be noted that relative amplitudes usually do not exceed 3.5, except for lower geomagnetic latitudes (see later).
The third characteristic parameter studied (Fig. 2c) is the local time of occurrence of the peak. At all latitudes, the time of occurrence tends to be later in summer than in win-ter. At middle latitudes, the enhancements occur later in the evening as solar activity increases, but no clear seasonal vari-ation can be noted. The opposite behaviour is found at low latitudes, with later enhancements during solar minimum. At high latitudes the variability is more complicated, with dif-ferent behaviour depending on the season. In winter the en-hancements occur later at low solar activity level, while in summer the same happens during solar maximum. Early en-hancements are found at high latitudes during equinoxes.
The time of occurrence shows small changes with geo-magnetic latitude. Very small variations of this parameter are found for different seasons and solar activity levels, the time being always close to 21:50 LT. As it will be shown later, the occurrence time of both peaks mainly reflects its dependence on longitude.
3.1.2 Second peak (post-midnight)
Night-time enhancements of electron concentration are more common after midnight than before midnight, as is clearly shown in Fig. 3a. Post-midnight enhancements occur on about 80% of all the nights, while the pre-midnight occur-rence probability is about 50%. The occuroccur-rence probability shows a clear seasonal dependence at all latitudes, with more enhancements in winter than in summer. Variations with so-lar activity are less clear, though in general a higher occur-rence probability is observed during solar minimum.
In general, at middle latitudes the amplitude of the post-midnight peaks (Fig. 3b) is slightly smaller than that of the pre-midnight ones, with values being less than three. At higher and lower latitudes we don’t see any extreme be-haviour of these amplitudes (see later).
In general, the highest relative amplitudes are found in winter and during solar minimum. A physical mechanism to explain this behaviour was proposed by Mikhailov et al. (2000b). This pronounced seasonal and solar variability occurs at high and middle geomagnetic latitudes only.
Post-midnight enhancements usually occur between 01:50–03:50 LT and are later in winter than in summer. No clear dependence of any parameter on solar activity is ap-parent, except for a small decay of amplitude during solar maximum, which was explained in detail by Mikhailov et al. (2000b). A small variation of these parameters with geo-graphic location occurs and is described later.
3.2 Geographical morphology of night-time NmF2 en-hancements
A similar analysis was applied to each of the 53 ionosonde stations (Table 1) to determine spatial variations of the F2-layer night-time electron concentration enhancements. The variations were analysed and presented in geomagnetic coor-dinates.
Figures 4a–c and 5a–c show the spatial variations of each of the previously defined parameters in panels displaying changes with season and solar activity level. Numerical val-ues are listed in Table 2. In general, latitudinal variations are the most important and longitudinal variations are negli-gible. Only the time of the peak’s occurrence shows a small longitudinal dependence displayed in Figs. 4c and 5c. No lat-itudinal variation of time of occurrence is apparent, and there is no significant difference between hemispheres for any of the parameters studied. Only cases with more than 100 valid nights for a station under a particular solar activity condition and season were used for the graphs in order to provide sta-tistical reliability.
1800 A. F. Farelo et al.: Global morphology of night-time NmF2 enhancements
Table 2. Numerical results: mean, standard deviation and number of valid cases for each variable and condition
Table 2. Numerical results: Mean, standard deviation and number of valid cases for each variable and condition.
PERCENTAGE OF OCCURRENCE OF FIRST PEAK (%) PERCENTAGE OF OCCURRENCE OF SECOND PEAK (%) AMPLITUDE OF FIRST PEAK AMPLITUDE OF SECOND PEAK T1 (LT) T2 (LT) Geomagnetic
latitude Range(º): Solar
Acti vity
Season Mean N Mean N Mean Std.
dev. N Mean dev. Std. N Mean dev. Std. N Mean dev. Std. N
Winter 85,27 713 93,13 713 2,94 2,57 608 2,04 1,1 664 21,6 1,36 608 2,94 1,24 664 Equinox 65,15 726 78,65 726 3,39 2,49 473 2,65 2,31 571 22,26 1,27 473 2,41 1,15 571 Low Summer 49,47 566 55,3 566 3,96 2,59 280 2,05 1,59 313 22,5 1,25 280 2,31 1,35 313 Winter 74,15 2476 90,02 2476 3,59 4,07 1836 1,91 1,04 2229 21,42 1,49 1836 2,84 1,17 2229 Equinox 58,46 2364 66,5 2364 4,01 3,69 1382 2,23 1,67 1572 22,06 1,37 1382 2,47 1,16 1572 Medi um Summer 62,94 2175 53,24 2175 2,98 2,3 1369 1,79 1,23 1158 22,5 1,15 1369 2,34 1,38 1158 Winter 56,5 1462 81,94 1462 4,63 4,95 826 1,76 1,07 1198 21,27 1,45 826 2,83 1,19 1198 Equinox 56,15 1163 47,72 1163 3,72 2,51 653 2,02 1,42 555 21,66 1,29 653 2,45 1,23 555 (-30º) - (-15º) High Summer 68,42 1406 47,44 1406 2,14 0,83 962 1,48 0,44 667 22,45 1,07 962 2,25 1,27 667 Winter 90,65 1690 98,82 1690 1,82 0,51 1532 2,02 0,67 1670 21,63 1,21 1532 3,27 1,28 1670 Equinox 58,49 1614 85,69 1614 1,9 0,83 944 1,67 0,53 1383 22,03 1,14 944 2,52 1,18 1383 Low Summer 40,07 1218 56,08 1218 2,74 1,22 488 1,77 0,88 683 22,53 1,14 488 1,97 1,19 683 Winter 68,58 4608 98 4608 1,72 0,59 3160 1,84 0,6 4516 21,73 1,3 3160 3,35 1,15 4516 Equinox 42,91 4123 69,61 4123 2,12 0,76 1769 1,62 0,54 2870 22,01 1,18 1769 2,41 1,18 2870 Medi um Summer 53,08 3945 47,43 3945 2,47 1,01 2094 1,65 0,62 1871 22,41 1,1 2094 2,15 1,35 1871 Winter 37,75 2580 94,34 2580 1,9 0,74 974 1,6 0,48 2434 21,96 1,34 974 3,19 1,16 2434 Equinox 40,85 2191 52,3 2191 2,18 0,76 895 1,47 0,43 1146 21,81 1,15 895 2,26 1,2 1146 (-45º) - (-30º) High Summer 71,42 2579 42,5 2579 1,94 0,49 1842 1,36 0,34 1096 22,33 0,95 1842 2,51 1,36 1096 Winter 56,09 640 92,81 640 1,97 0,81 359 1,97 1,16 594 21,97 1,46 359 2,96 1,45 594 Equinox 16,62 716 70,53 716 2,52 1,36 119 1,65 0,54 505 22,39 1,43 119 2,43 1,32 505 Low Summer 12,83 538 22,3 538 3,74 1,62 69 1,8 0,82 120 22,51 1,04 69 1,87 1,17 120 Winter 34,52 1776 90,65 1776 2,34 2,04 613 1,87 0,98 1610 21,98 1,6 613 3,23 1,5 1610 Equinox 16,27 1862 50,75 1862 3,21 1,73 303 1,78 0,78 945 22,24 1,53 303 2,27 1,36 945 Medi um Summer 24,02 1957 23,71 1957 3 1,29 470 1,67 0,62 464 22,17 0,98 470 1,89 1,26 464 Winter 23,69 1030 89,32 1030 2,67 2,33 244 1,61 0,43 920 22,21 1,7 244 3,22 1,35 920 Equinox 18,52 999 44,94 999 2,57 1,21 185 1,59 0,49 449 22,55 1,16 185 2,18 1,3 449 (-60º) - (-45º) High Summer 42,88 1278 24,96 1278 2,36 0,59 548 1,4 0,33 319 22,12 0,82 548 2,1 1,3 319 Winter 85,75 1439 94,51 1439 2,67 1,55 1234 2,31 1,27 1360 20,82 1,47 1234 2,76 1,37 1360 Equinox 60,72 1497 80,16 1497 2,64 1,47 909 2,21 1,33 1200 22,05 1,32 909 2,24 1,24 1200 Low Summer 47,33 748 59,89 748 3,29 1,91 354 2,01 1,13 448 21,99 1,33 354 1,8 1,2 448 Winter 77,82 4067 89,45 4067 4,17 4,39 3165 2,18 1,44 3638 20,78 1,55 3165 2,73 1,35 3638 Equinox 56,99 3890 70,57 3890 3,62 4,18 2217 2,04 1,45 2745 22,13 1,28 2217 2,2 1,19 2745 Medi um Summer 59,17 2687 56,61 2687 2,64 1,57 1590 1,81 1,06 1521 22,12 1,26 1590 1,9 1,22 1521 Winter 60,42 2850 69,12 2850 8,24 7,75 1722 2,07 1,62 1970 20,77 1,63 1722 2,62 1,33 1970 Equinox 57,34 2398 48,25 2398 5,5 6,44 1375 1,84 1,16 1157 21,56 1,46 1375 2,13 1,07 1157 15º - 30º High Summer 72,15 2219 53,49 2219 2,13 1,18 1601 1,57 0,71 1187 22,14 1,26 1601 1,94 1,21 1187 Winter 87,16 4150 98,22 4150 1,81 0,56 3617 2,07 1,06 4076 21,05 1,77 3617 3,32 1,81 4076 Equinox 48,5 4177 81,25 4177 1,83 0,95 2026 1,42 0,5 3394 21,84 1,45 2026 2,48 1,44 3394 Low Summer 32,73 3132 46,23 3132 2,6 1,2 1025 1,34 0,34 1448 21,77 1,15 1025 1,94 1,22 1448 Winter 70,49 9986 97,82 9986 1,89 1,08 7039 2,02 1,23 9768 21,33 1,79 7039 3,39 1,68 9768 Equinox 37,72 9131 80,05 9131 1,83 0,98 3444 1,37 0,45 7309 22,01 1,42 3444 2,39 1,38 7309 Medi um Summer 37,53 8010 49,94 8010 2,19 0,91 3006 1,34 0,32 4000 21,96 1,08 3006 1,97 1,18 4000 Winter 49,66 5797 94,5 5797 1,88 1,49 2879 1,76 1,22 5478 22,08 1,6 2879 3,19 1,54 5478 Equinox 27,18 4426 72,73 4426 1,75 0,89 1203 1,34 0,59 3219 22,36 1,29 1203 2,27 1,28 3219 30º - 45º High Summer 48,31 4579 50,99 4579 1,65 0,51 2212 1,29 0,47 2335 22,25 1 2212 1,88 1,18 2335 Winter 75,46 5367 94,17 5367 1,93 0,74 4050 2,28 1,19 5054 21,58 1,73 4050 2,48 1,61 5054 Equinox 33,67 6318 68,68 6318 2,78 2,55 2127 1,47 0,74 4339 21,35 1,63 2127 2,15 1,3 4339 Low Summer 24,1 6311 20,65 6311 3,16 1,71 1521 1,35 0,74 1303 21,86 0,99 1521 1,66 1,09 1303 Winter 56,71 14608 91,08 14608 2,01 1,42 8284 2,05 1,44 13305 21,79 1,74 8284 2,59 1,61 13305 Equinox 24,12 15284 56,84 15284 2,85 2,06 3687 1,48 0,75 8687 21,64 1,59 3687 2,01 1,28 8687 Medi um Summer 27,33 17267 22,52 17267 2,46 1,23 4719 1,33 0,52 3889 21,96 0,98 4719 1,61 1,11 3889 Winter 39,97 9238 86,48 9238 2,19 2,84 3692 1,72 1,4 7989 22,08 1,57 3692 2,75 1,71 7989 Equinox 20,86 8072 48,1 8072 2,34 1,79 1684 1,47 0,7 3883 22 1,4 1684 1,89 1,26 3883 45º - 60º High Summer 37,25 9115 28,22 9115 1,84 0,87 3395 1,3 0,62 2572 22,1 1,05 3395 1,58 1,04 2572 Winter 81,43 13999 95,85 13999 2,01 1,04 11400 2,16 1,11 13418 21,35 1,66 11400 2,9 1,64 13418 Equinox 43,85 15048 75,7 15048 2,38 1,87 6598 1,62 0,95 11392 21,78 1,48 6598 2,33 1,33 11392 Low Summer 29,86 12513 34,48 12513 3,03 1,68 3737 1,54 0,86 4315 22 1,15 3737 1,87 1,2 4315 Winter 64,22 37521 93,46 37521 2,35 2,38 24097 2,01 1,26 35066 21,49 1,69 24097 2,97 1,57 35066 Total Medi um Equinox 34,93 36654 65,83 36654 2,74 2,59 12802 1,59 0,9 24128 21,94 1,43 12802 2,24 1,3 24128
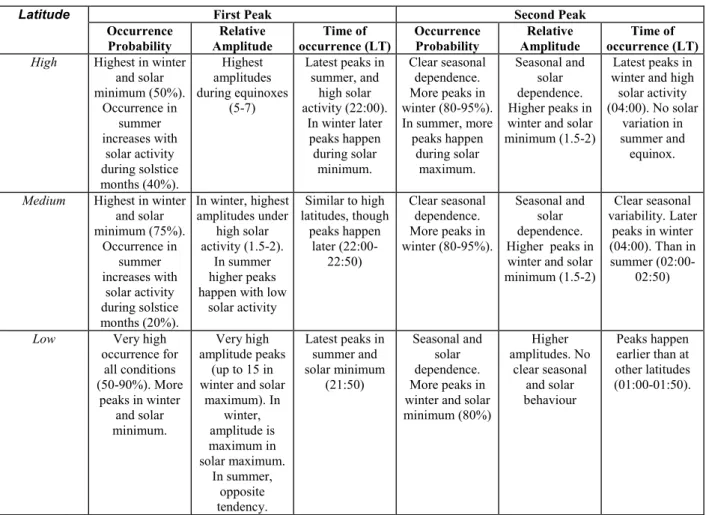
Table 3. Summary of results
First Peak Second Peak
Latitude
Occurrence
Probability Amplitude Relative occurrence (LT) Time of Occurrence Probability Amplitude Relative occurrence (LT) Time of
High Highest in winter
and solar minimum (50%). Occurrence in summer increases with solar activity during solstice months (40%). Highest amplitudes during equinoxes (5-7) Latest peaks in summer, and high solar activity (22:00). In winter later peaks happen during solar minimum. Clear seasonal dependence. More peaks in winter (80-95%). In summer, more peaks happen during solar maximum. Seasonal and solar dependence. Higher peaks in winter and solar minimum (1.5-2)
Latest peaks in winter and high solar activity (04:00). No solar
variation in summer and equinox.
Medium Highest in winter
and solar minimum (75%). Occurrence in summer increases with solar activity during solstice months (20%). In winter, highest amplitudes under high solar activity (1.5-2). In summer higher peaks happen with low
solar activity Similar to high latitudes, though peaks happen later (22:00-22:50) Clear seasonal dependence. More peaks in winter (80-95%). Seasonal and solar dependence. Higher peaks in winter and solar minimum (1.5-2) Clear seasonal variability. Later peaks in winter (04:00). Than in summer (02:00-02:50)
Low Very high occurrence for all conditions (50-90%). More peaks in winter and solar minimum. Very high amplitude peaks (up to 15 in winter and solar
maximum). In winter, amplitude is maximum in solar maximum. In summer, opposite tendency. Latest peaks in summer and solar minimum (21:50) Seasonal and solar dependence. More peaks in winter and solar minimum (80%) Higher amplitudes. No clear seasonal and solar behaviour Peaks happen earlier than at other latitudes (01:00-01:50).
3.2.1 First peak (pre-midnight)
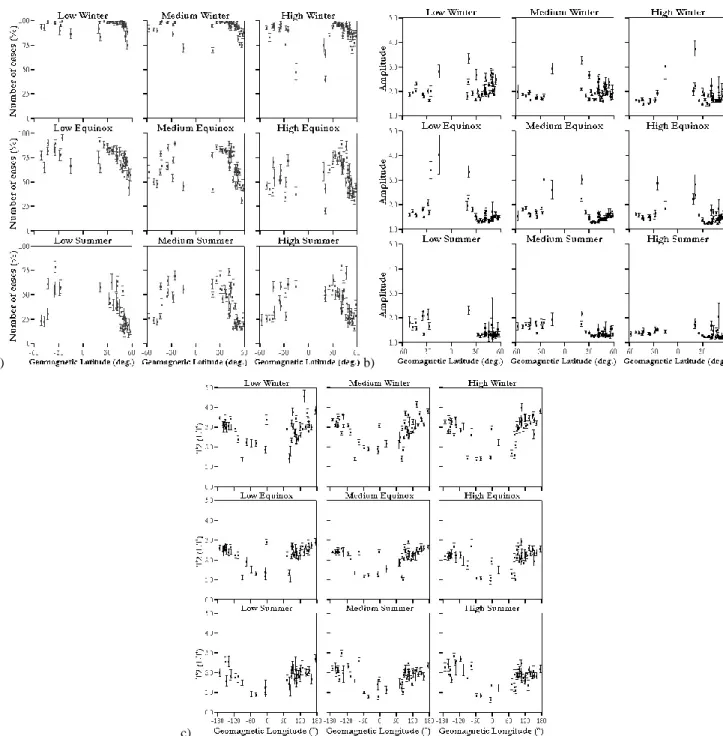
Figures 4a–c show the geographic morphology of the first en-hancement of electron concentration. The occurrence prob-ability (Fig. 4a) shows a maximum around φgeomag = 35◦
and a noticeable latitudinal variation. The lowest occurrence probabilities take place at high latitudes. This behaviour is most pronounced in winter, while in summer, and especially under solar maximum conditions, it distorts at high latitudes due to the influence of the summer solstice feature mentioned earlier.
The amplitude (Fig. 4b) shows quite a different type of morphology, with a relative minimum around 40◦and very high values in lower latitudes. The minimum in latitudinal variation shifts equatorward in summer and poleward in win-ter. Not much can be said about the latitudinal variation of the local time of the first peak’s occurrence. However, though smaller and less clear than in the case of the second peak, an irregular longitudinal variation is apparent (Fig. 4c). 3.2.2 Second peak (post-midnight)
The geographic morphology of the second peak of elec-tron concentration is displayed in Figs. 5a–c. The
occur-rence probability (Fig. 5a) shows a clear maximum around
φgeom = 40◦ for all solar activity conditions, with values
very close to 100% in winter. For other seasons, occurrence probability is higher around solar minimum. A great reduc-tion in occurrence probability is seen around φgeom = 25◦.
As in the case of the first peak, the amplitude of the post-midnight enhancement shows the reverse behaviour, with a minimum in amplitude around φgeom =40◦and the greatest
amplitudes at latitudes < 25◦. This is not surprising, since the occurrence probability depends only on the existence of relative increases in electron concentration, while the ampli-tude is strongly related to the minimum electron concentra-tion during the particular night.
Finally, the time of occurrence shows both a latitudinal and longitudinal dependence. Latitudinally (see Fig. 3c), the variation of the occurrence time of the second enhancement is almost constant, while longitudinally (Fig. 5c) it shows a sinusoidal type of variation with period 360◦. Stations at low latitudes (φgeom<25◦) show quite a different behaviour
for both enhancements, indicating a different mechanism of formation at these latitudes.
1802 A. F. Farelo et al.: Global morphology of night-time NmF2 enhancements Southern Hemisphere Northern Hemisphere a) Southern Hemisphere Northern Hemisphere b) Southern Hemisphere Northern Hemisphere c)
Fig. 3. (a)–(c) Same as Fig. 2 for second (post-midnight) peak.
4 Discussion
The method of data analysis used here allows one to inves-tigate the NmF2 night-time enhancements morphology, re-vealing that the two peaks have different behaviours and in-dicating different formation mechanisms. From this perspec-tive it follows that previous studies analysing only one peak omitted the characteristics of the “weaker” peak, which will be pre- or post-midnight, depending on season, solar activity and geographical location. This is believed to be the main reason for the differences between our results and those of other authors. Balan and Rao (1987) found that for low lat-itudes and winter solar minimum two peaks are common,
while only a post-midnight peak is present at middle and high latitudes. This contradicts our results. However, they only considered one peak each night, missing the presence of pre-midnight peaks at low latitudes, whose amplitude is small under these conditions. The difference in methods of analysis does not allow us to make a comparison with their results for geographical variation.
Jakowski et al. (1991) found for observations at Havana a higher occurrence probability in winter during solar mini-mum and in summer during solar maximini-mum. The joint con-sideration of the occurrence probabilities of both peaks in our graphs (Figs. 2a and 3a) explains this change, which is due to the increased occurrence of the first peak at high
a) b)
c)
Fig. 4. Geographic variation with of characteristic parameters for the first peak (a) probability of occurrence, (b) relative amplitude, and (c)
local time of occurrence with geomagnetic longitude, under different seasonal and solar conditions. Categories are the same as in Figs. 2 and 3. For example, “Low winter” refers to winter data under low solar activity conditions. Points indicate means. Bars indicate 95% confidence limits.
solar activity during summer solstice. They also found that the occurrence of two peaks on the same night occurs only during winter and solar maximum. This can be explained by the fact that the amplitude of both peaks is similar under solar maximum conditions for middle latitude stations like Havana, which makes both enhancements “visible” to their method of data analysis, while under other conditions only the (larger) second peak is found. Other authors also miss one of the peaks for similar reasons.
The distinct and systematic behaviour of each of the two
enhancements indicates that different physical mechanisms lead to their formation. For the first (pre-midnight) peak sev-eral mechanisms appear to act, depending on season and so-lar activity. At middle latitudes the highest amplitudes are found during summer and low solar activity. This has been attributed to a collapse in the F2-region as electron tem-perature decreases after sunset, producing large downward ion fluxes. This, along with the contribution of equator-ward meridional thermospheric winds uplifting the F2-layer to regions with low recombination rates, causes the NmF2
1804 A. F. Farelo et al.: Global morphology of night-time NmF2 enhancements
a) b)
c)
Fig. 5. (a)–(c) Same as Fig. 4 for the second peak.
increase.
During solar maximum, however, the amplitude of the summer peak decreases. The occurrence probability in-creases during summer solstice months, especially during solar maximum. This effect was attributed by Mikhailov et al. (2000a) to a direct solar photoionization as the night-time ionosphere rises to higher sunlit altitudes. This effect is es-pecially apparent at high latitudes. The time of occurrence of these summer solstice peaks shifts to later hours as so-lar activity increases. This is consistent with the hypothesis of a photoionization origin. It should be noted that higher amplitudes are often associated with low occurrence
proba-bility, while the highest amplitudes are always observed at lower latitudes. This may indicate that the relative ampli-tude of night-time peaks is controlled mainly by the value of minimum electron concentration used for a scale (Nmin),
which determines the background level above which the en-hancements are counted. This was checked by studying the dependence of amplitude on Nmin. The importance of this
background level specification was pointed out by Joshi and Iyer (1990). It may also be the cause of high amplitudes found at lower latitudes for both peaks.
The formation of pre-midnight peaks in winter is due mainly to a strong equatorward thermospheric wind
raising the F2-layer to heights with a lower recombina-tion rate (Young et al., 1970; Standley and Williams, 1984; Mikhailov et al., 2000a, b).
Large amplitudes at high-latitudes during equinox can be associated with the highest efficiency in the interaction be-tween the Earth and the solar wind that occurs during these periods (Hargreaves, 1992). The behaviour found at lower latitudes is opposite to that commonly found at middle lati-tudes and may explain the contradiction between our results and those by Lois et al. (1990) and Jakowski et al. (1991) at Havana, Cuba.
The season-dependent behaviour of the first peak’s ampli-tude that can be seen clearly in Fig. 2b, has a different and un-known physical mechanism. The second enhancement shows a clear seasonal variation, being much more likely to occur in winter than in summer, both around solar maximum and solar minimum. The highest amplitudes also occur in winter, being higher during solar minimum. As with the first peak, the highest amplitudes occur at lower latitudes, which also demonstrate different behaviour compared with middle and high latitudes.
The physical mechanism proposed to explain the forma-tion of the second enhancement is again electron fluxes from the plasmasphere. However, observed fluxes are smaller than those required to explain the peaks (see Mikhailov et al. (2000b) and references therein). This problem was solved by Mikhailov and F¨orster (1999) and Mikhailov et al. (2000b), who proposed that the observed night-time
NmF2 variations were due to the uplifting of the F2-layer
by the equatorward thermospheric winds, along with the ob-served night-time plasmaspheric fluxes into the F2-region. The increase in the night-time height of the maximum elec-tron concentration in the F2-layer, hmF2, and the correspond-ing decrease in the recombination rate is then sufficient to explain the night-time NmF2 increases with the observed rel-atively small plasma fluxes from the protonosphere.
The critical role played by thermospheric winds in the de-velopment of night-time peaks of NmF2 is evident from the geographic variation of the parameters studied, which show relative extremes (maximum in occurrence probability, min-imum in amplitude) around φgeom ≈ 40◦. Vertical drift of
plasma (W ) due to the meridional component (Vnx) of the
neutral winds depends on magnetic inclination (I ) as
W = Vnxsin I cos I , (3)
which is a maximum when I = 45◦. Additionally, the flux
tube content is proportional to L4, which gives a maximum of electron content in the tube at φgeom ≈ 60◦ (Carpenter
and Park, 1973) due to the partial filling of tubes with L > 3. Tubes at lower latitudes are filled, but their volume is insuffi-cient to produce the necessary plasma influx to the F2-layer. The action of meridional thermospheric winds at the equator may be another cause for the different behaviours, especially for the high amplitudes observed (Titheridge, 1995). A bet-ter knowledge of the global patbet-tern of thermospheric winds is desirable in order to improve the understanding of the mech-anism of NmF2 peak formation.
5 Conclusions
A detailed study of the morphology of NmF2 night-time en-hancements was carried out at 53 ionosonde stations world-wide for different seasons and different levels of solar activ-ity. The main results of our analysis are the following:
1. There are two distinct (pre- and post-midnight) NmF2 peaks, which can occur for any season and solar activity level.
2. All the characteristics of the night-time enhancements that were analysed demonstrate a pronounced depen-dence on geomagnetic latitude, with distinctive be-haviour at lower (φgeom<25◦) latitudes, indicating
dif-ferent formation mechanisms.
3. In general, the occurrence probability is higher for the second (post-midnight) peak.
4. The occurrence probability of the first peak shows a clear seasonal dependence, with a maximum in winter solar minimum. The greatest occurrence probability is at φgeom≈35◦, and the least is at high latitudes (except
for summer and high solar activity, due to the summer solstice occurrence upsurge).
5. The occurrence probability of the second peak shows a similar seasonal pattern, but without a dependence on solar activity. The greatest occurrence probability is ob-served at φgeom ≈40◦, and the least at high latitudes.
6. In general the amplitude Npeak/Nminof the first peak is
higher than for the second peak. The largest enhance-ments are observed at low latitudes in winter during solar minimum. Appreciable enhancements also take place at high latitudes during equinoxes. At middle lati-tudes peaks show various patterns depending on the sea-son.
7. The amplitude of the post-midnight peak shows a clear seasonal and solar activity dependence, being larger in winter and during solar minimum. In general, post-midnight enhancements of electron concentration are smaller than the pre-midnight ones. The geographical morphology of the NmF2 enhancements shows a rela-tive minimum around φgeom≈35◦, with a large upsurge
at lower latitudes.
8. The time of occurrence of the first peak is between 20:00 and 22:50 LT and shows a clear dependence on solar activity. Enhancements occur later at middle lat-itudes during solar maximum. The dependence of the time of occurrence on solar activity is different at differ-ent geomagnetic latitudes. A small longitudinal effect is also present.
9. The time of occurrence of the second peak is between 01:50 and 03:00 LT. Enhancements occur later in winter than in summer. There is a small but distinct longitudi-nal variation.
1806 A. F. Farelo et al.: Global morphology of night-time NmF2 enhancements
Acknowledgements. The authors wish to thank E. Kazimirovsky and D. McKnight for careful reading of the manuscript and valu-able comments, and the World Data Center for STP at Chilton (UK) for providing the data base.
Topical Editor M. Lester thanks M. F¨orster and C. Davis for their help in evaluating this paper.
References
Arendt, P. R. and Soicher, H.: Downward electron flux at 1000 km altitude from electron content measurement at mid-latitudes, Na-ture, 204, 983–984, 1964.
Balan, N. and Rao, P. B.: Latitudinal variations of night-time en-hancement in total electron content, J. Geophys. Res., 92, 3436– 3440, 1987.
Balan, N., Bailey, G. J., Balachandran Nair, R., and Titheridge, J. E.: Nighttime enhancements in ionospheric electron content in the northern and southern hemispheres, J. Atmos. Terr. Phys., 56, 67–69, 1994.
Bertin, F. and Papet-Lepine, J.: Latitudinal variation of total elec-tron content in the winter at middle latitude, Radio Sci., 5, 899– 906, 1970.
Carpenter, D. L. and Park, C. G.: On what ionospheric workers should know about the plasmasphere-plasmapause, Rev. Geo-phys. Space Phys., 11, 133–154, 1973.
Da Rosa, A. V. and Smith, F. L.: Behaviour of the night-time iono-sphere, J. Geophys. Res., 72, 1829–1836, 1967.
Davies, K., Anderson, D. N., Paul, A. K., Degenhardt, W., Hart-mann, G. K., and Leitinger, R.: Night-time increase in total elec-tron content observed with the ATS 6 radio beacon, J. Geophys, Res., 84, 1536–1542, 1979.
Eccles, D. and Burge, J. D.: The behaviour of the upper ionosphere over North America at sunset, J. Atmos. Terr. Phys., 35, 1927– 1934, 1973.
Evans, J. V.: Cause of midlatitude winter increase in foF2, J. Geo-phys. Res., 70, 4331–4345, 1965.
Evans, J. V.: A study of F2 region night-time vertical ionization fluxes at Millstone Hill, Planet. Space Sci., 18, 1225–1253, 1975. F¨orster, M. and Jakowski, N.: The nighttime winter anomaly (NWA) effect in the American sector as a consequence of in-terhemispheric ionospheric coupling, PAGEOPH, 127, 447–471, 1988.
Hanson, W. B. and Ortenburger, I. B.: The coupling between the protonosphere and the normal F-region, J. Geophys. Res., 66, 1425–1435, 1961.
Hargreaves, J. K.: The Solar-Terrestrial Environment, Cambridge University Press, Cambridge, 1992.
Hedin, A. E., Biondi, M. A., Burnside, R. G., Hernandez, G., John-son, R. M., Killeen, T. L., Mazaudier, C., Meriwether, J. W., Salah, J. E., Sica, R. J., Smith, R. W., Spencer, N. W., Wickar, V. B., and Virdi, T. S.: Revised global model of thermosphere winds using satellite and ground-based observations, J. Geophys. Res., 96, A5, 7657–7688, 1991.
Ivanov-Kholodny, G. S. and Mikhailov, A. V.: The prediction of ionospheric conditions, D. Reidel Publ. Co., Dordrecht, The Netherlands, 1986.
Jain, A. R. and Williams, P. J. S.: The maintenance of nighttime ionosphere at mid-latitudes. II. The ionosphere above St. Santin, J. Atmos. Terr. Phys., 46, 83–89, 1984.
Jakowski, N., Jungstand, A., Lazo, B., and Lois, L.: Night-time enhancement of the F2-Layer ionization over Havana, Cuba, J. Atmos. Terr. Phys., 53, 1131–1138, 1991.
Jakowski, N. and F¨orster, M.: About the nature of the night-time winter anomaly effect (NWA) in the F-region of the ionosphere, Planet. Space Sci., 43, 603–612, 1995.
Joshi, H. P. and Iyer, K. N.: On night-time anomalous enhancement in ionospheric electron content at lower mid-latitude during solar maximum, Ann. Geophysicae, 8, 53–58, 1990.
Leitinger, R. G., Hartmann, G. K., Degenhart, W., Hedberg, A., and Tanskanen, P.: The electron content of the ionosphere and the southern boundary of diffuse aurora, J. Atmos. Terr. Phys., 44, 369–374, 1982.
Lois, L., Peres, H., Lazo, B., Jakowski, N., and Landrock, R.: Night-time enhancement of the F2-layer ionization over Havana-Cuba: A relationship with solar activity, Geomag. Aeronom., 30, 76–82, 1990.
Mikhailov, A. V. and F¨orster, M.: Some F2-layer effects during the 6–11 January 1997 CEDAR storm period as observed with the Millstone Hill incoherent scatter facility, J. Atmos. Solar-Terr. Phys., 61, 249–261, 1999.
Mikhailov, A. V., Leschinkaya, T. Yu., and F¨orster, M.: Morphol-ogy of NmF2 night-time increases in the Eurasian sector, Ann. Geophysicae, 18, 618–628, 2000a.
Mikhailov, A. V., F¨orster, M., and Leschinkaya, T. Yu.: On the mechanism of the post-midnight winter NmF2 increases. De-pendence on solar activity, Ann. Geophysicae, 18, 1422–1434, 2000b.
Rao, M. M., Raj, P. E., and Jogulu, C.: A study of the post-sunset increase in the F2-region electron density at low and middle lati-tudes in the Asian zone during sunspot maximum and minimum periods, Ann. Geophysicae, 38, 357–365, 1982.
Standley, P. J. and Williams, P. J. S.: The maintenance of nighttime ionosphere at mid-latitudes. I. The ionosphere above Malvern, J. Atmos. Terr. Phys., 46, 73–81, 1984.
Sterling, D. L., Hanson, W. B., Moffet, R. J., and Baxter, R. G.: Influence of electromagnetic drifts and neutral air winds on some features of the F2-region, Radio Sci., 4, 1005–1023, 1969. Strobel, D. F. and McElroy, M. B.: The F2-layer at middle latitudes,
Planet. Space Sci., 18, 1181–1202, 1970.
Titheridge, J. E.: The maintenance of the nighttime ionosphere, J. Atmos. Terr. Phys., 30, 1857–1875, 1968.
Titheridge, J. E.: The electron content of the southern mid-latitude ionosphere, J. Atmos. Terr. Phys., 35, 981–1001, 1973. Titheridge, J. E.: Winds in the Ionosphere – A Review, J. Atmos.
Terr. Phys., 57, 1681–1714, 1995.
Tyagi, T. R.: Electron content and its variation over Lindau, J. At-mos. Terr. Phys., 36, 475–487, 1974.
Wickwar, V. B.: Conjugate photoelectrons at L = 5.6 and the 6300 A post sunset enhancement, Planet. Space Sci., 22, 1297–1307, 1974.
Young, D. M. L., Yuen, P. C., and Roelofs, T. H.: Anomalous night-time increases in total electron content, Planet Space Sci., 18, 1163–1179, 1970.