TH
EFEC
0FFE6AD
by,
N.B4M4od
.
Ben d9ic5
K.C
Uematsu, H.
.Wttngan
CAA ENGN
M N
McuET
Inti
N
U
L A ,PEe
ofi.
CNtra. c No, A
.
T
e e
(3 -c t
K em tu, . .Withig an K * *
U.US.Atomi
ENg
Coiss
Septe
ber 1,PI9
UNCLASSIFIED
THE EFFECT OF FUEL AND POISON MANAGEMENT ON NUCLEAR POWER SYSTEMS
by
N. B. McLeod, M. Benedict,
K. Uematsu, H. L. Witting, and K. S. Ram
Massachusetts Institute of Technology Nuclear Engineering Department
Contract No. AT (30-1) - 2073 September 15, 1961 June, 1959 - September, 1961
TID 4500 Category UC-80 Reactor Technology
This work was done in part at the
MIT Computation Center, Cambridge, Massachusetts.
UNCLASSIFIED NYO 9715
Distribution No. of Copies
Division of Sponsored Research, MIT 1
Industrial Liason Office, MIT 5
MIT Library 2
MIT Computation Center 1
MIT Files 30
N. B. McLeod 20
AEC TIS 3
AEC Reports and Statistics Branch 1
D. Richtman 1 Donald H. Stewart 1 Harmon Potter 1 Saul Strauch 1 E. A. Eschbach 1 W. B. Lewis 1 D. P. Herron 1 S. Siegel 1 Harvey W. Graves 1 J. W. Weil 1 Dale F. Babcock 1
The contents of this report have been submitted by Mr. N. B. McLeod to the Massachusetts Institute of Technology in partial fulfillment of the requirements for the degree of
Doctor of Philosophy.
This work was done in part at the M:I. T. Computation Center, Cambridge, Massachusetts.
TABLE OF CONTENTS
CHAPTER L ABSTRACT... . . ....
CHAPTER II. INTRODUCTION...-.-.-.-.-.-.-.. CHAPTER III. SUMMARY
-A. FUELMOVE CODE DESCRIPTION
1. Introduction.-.-.-.-. -... -.-.-.-.-.-.-. 2. The FUEL Code
3. The MOVE Code
4. The Limitations of FUELMOVE . .
B. THE EVALUATION OF THE NEUTRON BEHAVIOR MODEL . . . . . . . . . . . . 1 . . C. THE RESULTS FROM THE STUDY OF FUEL AND
POISON MANAGEMENT TECHNIQUES 1. Introduction . .a ... s... ... ..
2. FUEL Code Results ... . . 3. MOVE Code Results ... .... . CHAPTER IV. FUELMOVE CODE DESCRIPTION AND
CALCULATIONAL TECHNIQUES A. INTRODUCTION . . . . . . . . . .
24
24 .0 . 40 B. THEFUEL CODE 1 . . . .. . . . . .. . 41 1. Introduction . . . . . . . ... , ... 41 2. The Neutron Cycle. . ... . . .. .433. The Thermal Region . -. 45
4. The Resonance Region .. ... 54 5. The Nuclide Concentration Equations and the
Flux-Time Properties ... 57 6. The Definition of k , . . ... . . . 62 C. THE MOVECODE
1. Introduction . -...-. . . 2. Spatial Behavior
3. The Fuel Management Procedures 4, The Cost Analysis . . . . .
D. MACHINE AND TIME REQUIREMENTS. . .
63 67 83 104 134 1 3 12 12 13 14 17 19 24 . . . .
E. THE MAIN PROGRAM FLOW CHARTS ... -. 135 1. The FUEL Code . . . . . . . ... 137 2. The MOVE Code . - . . . . --.-.-. 143 CHAPTER V. EVALUATION OF THE NEUTRON BEHAVIOR
MODEL- - --.... --.-.-.-. -. -. 161
A. INTRODUCTION -.-.-.-.-.-.-.-.-.-.-.-.-. 161
B. THE EXPERIMENT AND EXPERIMENTAL DATA
1. The Samples . ....--.-.-.-. -.-.-. 162
2. The Irradiation --.-.-. -. -. -. -.-.-.-.-. 162 3. The Pile Oscillator ... -. -. -.-.- .162 4. The Interpretation of Pile
Oscillator Measurements -.-.-.-. -.-.-.-.-. 162 5. The Evaluation of Nuclide Concentrations . - - 168 C. THE FUEL CODE PREDICTIONS
1. Introduction. ... .- -. -. -.-. 169 2. The NRX Reactor -.-.-. -.-.-.-.-.-.-.-.-. 169 3. Preparation of NRX Input Data for
the FUEL Code . . . - - - .- . 169
4. FUEL Code Predictions and
Experimental Data - - . - - - . .173 5. The Significance of Errors
and Uncertainties - .- ..- .- - .- ..- .- - .- 183
D. THE DISCUSSION OF RESULTS
1. Nuclide Concentrations ...-.-.-. -.-. 195 2. Reactivity - - - .-.- .- -.- .- ..- .- .. 196 3. The Significance of Uncertainties in
Basic Nuclear Data ... 197 CHAPTER VI. FUEL AND POISON MANAGEMENT STUDIES:
THE CANDU REACTOR
A. INTRODUCTION ... ... 199
B. THE CANDU REFERENCE DESIGN . ... 200
C. THE FUEL CODE CALCULATIONS 1. The Preparation of FUEL Code
Input Data . .. . .... 203
2. The CANDU Fuel Properties
D. THE FUEL AND POISON MANAGEMENT STUDY 1. Introduction . 0 . . . . - -2. The Preparation of MOVE Code
Input Data .
3. The Reference Design 4. Continuous Bidirectional, Steady-State. . .... ..-.-.-.-. 216 . .
220
220 226 5. Continuous Bidirectional, Startup 6. Discontinuous Bidirectional 7. Batch Irradiation...-.-.-.-. 8. Discontinuous Outin. ... 9. Continuous Outin and Graded E. SUMMARY AND GENERAL CONCLUSIONS 262 266 272 292 313 320 CHAPTER VII. CONCLUSIONS AND RECOMMENDATIONS A. THE VERIFICATION OF THE FUEL CODE NEUTRON BEHAVIOR MODEL ,... 332B. THE FUEL AND POISON MANAGEMENT STUDY . .... . . .. . ... 334
C. RECOMMENDATIONS FOR FUTURE WORK . . . 335
APPENDICES: A. OPERATIONAL INFORMATION .. ... 336
1. Input Data Card Formats . ... 336
2. The FUEL Code ... . . . ... 337
3. Data Transfer from the FUEL Code to the MOVE Code ... . . ... 350
4. The MOVE Code .... . . ... 354
5. Program Stops.... . ... . . . 376
B. THE GENERAL TREATMENT OF THE STEADY-STATE BIDIRECTIONAL FUEL MOVEMENT. . . 382
C. SAMPLE COST CALCULATION ... 387
D. FUELMOVE SUBPROGRAMS ... ... 392
E. TABULATED FUEL CODE DATA ... 463
F. CATALOGUEOF COMPUTER RUNS . . . . . . 482
G. NOMENCLATURE ... . ... 484
LIST OF TABLES Table No. 2.1 2. 4. 4. 5. 5. 5. 2 1 2 1 2 3 5.4 5.5 5.6 5. 7 5.8 5. 5. Title Characteristics of Reference Reactors
Previous Fuel Cycle Theses at MIT Basic Nuclear Data
Input Data for Cost Calculations Reactor Physics Data for NRX
FUEL Code Input Data for NRX
Unit Cell Properties During Burnup, NRX Reactor
FUEL Code and Experimental NRX
Nuclide Concentrations Total Cross Section Changes,
SGMSFL = 1152 Bifa Total Cross Section Changes,
SGMSFL = 230 Bifa
Thermal Cross Section Changes, SGMSFL = 1152 Bifa
Thermal Cross Section Changes, SGMSFL = 230 Bifa
Calculation of Z eff
Uncertainties in Basic Nuclear Data
FUEL Code Data for Uncertainty
Determination
Computation of Uncertainties
CANDU Reference Design
FUEL Code Input Data for CANDU
MOVE Code Input Data for CANDU
9 10 5.11 5. 6. 6. 6. 12 1 2 3 Page 8 11 49 106 170 171 174 176 178 179 180 181 184 190 191 192 201 204 221
Table No. T itle Page 6.4 MOVE Code Calculation of the
CANDU Reference Design 223
6. 5 Summary of Initial Survey Results for the Bidirectional Fuel
Movement 230
6. 6 The Radial Variation of Discharge
Flux-Time 231
6. 7 The Effect of Changes on Reference
Design 244
6. 8 The Effect of Mixed Enrichments 246
6.9 The Effect of Fixed Poison on Burnup
and Power Distribution 248
6. 10 Characteristics of the Optimum
Reactor 1.0 a/o 253
6.11 Characteristics of the Optimum
Reactor 1.3 a/o 255
6.12 Characteristics of the Optimum
Reactor 1.5 a/o 257
6. 13 Enrichment Survey for Batch
Irradiation 274
6.14 The Use of Burnable Poison in
Batch Irradiation 280
6.15 The Use of Radial Zone Poison
Variation with Uniform
Enrich-ment in Batch Irradiation 283 6.16 The Effect of Radial Variation of
Enrichment and Initial Control
Poison Distribution 285
6. 17 The Effect of Core Volume Change on the Fuel Cycle Cost for
Batch Irradiation 288
6. 18 Characteristics of the Optimum Reactors for Batch
Table No. Text Page 6. 19 Radial Zone Poison Distribution,
Steady-State, 2-Zone,
Discontinuous Outin 300
6. 20 Characteristics of the Optimum Reactors
for Discontinuous Outin Irradiation 301 6. 21 The Startup of 2-Zone Discontinuous
Outin 307
6. 22 The Characteristics of Continuous
Outin and Graded Fuel Irradiations 314
Al FUEL Code Input Data Calculations 339
A2 FUEL Code Input Data Card Formats 347
A3 FUEL Code Output Data Card Formats 352
A4 The Sequence of MOVE Code Input
Data Cards 365
A5 MOVE Code Input Data Card Formats 366
A6 Program Stops in the MOVE Code 377
A7 Input Data for the FUEL Code
Test Case 379
A8 The FUEL Code Punched Card Output 380
A9 Input Data for the MOVE Code
Test Case 381
El to 9 CANDU Unit Cell Properties During Burnup, Enrichments:
LIST OF FIGURES
Figure No. Title Page
3.1 FUEL Code and Experimental Nuclide
Concentrations 20
3. 2 Reactivity Change, Experiment vs.
FUEL Code Prediction 21
3. 3 The Effect of Uncertainties in
Basic Nuclear Data 22
3.4 Variation of k During Burnup,
CANDU Reactor Unit Cell 25
3. 5 The Flux-Time Behavior of k, with Various Amounts
of Burnable Poison 26
3.6 Contour Plot of the Relative Power
Density, CANDU Reference Design 28 3. 7 The Peak-to-Average Power Density
Ratio in the CANDU Reactor 29 3.8 Average Burnup in the CANDU Reactor
as a Function of Enrichment 30 3.9 Net Fuel Cycle Cost in the CANDU
Reactor at Various Enrichments 31 3. 10 Net Fuel Cycle Cost as a Function
of Enrichment 33
3.11 The Use of Burnable Poison in
Control Limited Reactors 34 3.12 The Variation of Total Energy Cost
with Enrichment 36
3. 13 The Total Energy Cost as a Function of Enrichment for Various Fuel
and Poison Management Techniques 38 3. 14 The Total Energy Cost as a Function
of Maximum Burnup for Various Fuel and Poison Management
Figure No. Title Page
4.1 The Neutron Cycle 44
4. 2 Mesh Representation of a Core
Quadrant 71
4.3 Process Flow Sheet for Fuel
Cycle Cost Analysis 109
4.4 Model Used for Fuel Cycle
Interest Charges 121
4. 5 Symbols Used for Computer Logic
Flow Charts 136
5. 1 Fuel Code and Experimental
Nuclide Concentrations 177 5. 2 Reactivity Change: Experiment
vs. FUEL Code Predictions 185 5. 3 The Effect of Uncertainties in
Basic Nuclear Data 193
6. 1 CANDU Flux Spectra, Natural
Uranium 206
6. 2 Percent Change in Cross Sections
During Burnup 207
6. 3 Variation of Fuel Composition
During Burnup 209
6. 4 Variation of Homogenized Unit Cell Properties During
Burnup 210
6.5 Variation of k., During Burnup,
CANDU Reactor Unit Cell 211
6. 6 Relation Between Flux-Time and
Burnup at Various Enrichments 212 6. 7 The Flux-Time Behavior of k with
Various Amounts of Burnable
Poison 214
6. 8 Relative Radial Flux Shape at the Mid-Plane: CANDU Reference
Figure No. Title Page 6.9 Contour Plot of the Relative
Power Density, CANDU
Reference Design 227
6.10 The Components of Net Fuel Cycle
Cost, CANDU Reference Design 228 6. 11 The Peak-to-Average Power Density
Ratio in the CANDU Reactor at
Various Enrichments 23Z
6.12 The Axial Behavior of Relative Power Density at the Axis of the
CANDU Reactor 233
6.13 The Radial Behavior of Relative Power Density at the Mid-P lane of the
CANDU Reactor 235
6.14 Average Burnup in the CANDU Reactor
as a Function of Enrichment 236 6.15 Maximum Burnup in the CANDU Reactor
as a Function of Enrichment 237 6. 16 Contour Plot of the Relative Power
Density, CANDU Reactor 239
6.17 Net Fuel Cycle Cost in the CANDU
Reactor at Various Enrichments 240 6. 18 The Components of the Net Fuel Cycle
Cost (Basis 1) vs. Enrichment 241 6.19 The Components of the Net Fuel Cycle
Cost (Basis 2) vs. Enrichment 242 6.20 The Variation of Total Energy Cost
with Enrichment for Reactors at Constant Output or Constant
Volume 252
6. 21 Contour Plot of the Relative Power Density, Minimum Core Volume
at 1.3 a/o Enrichment 260 6. 22 Burnup at Various Times of Fuel Being
Figure No. Title Pag 6. 23 Initial Behavior of the Ratio
of Peak-to-Average
Power Density 264
6. 24 Fuel Cycle Cost for Fuel Discharged
at Various Times After Startup 265 6. 25 Average Burnup of Discharged Fuel
at Various Times After Startup 268 6. 26 The Variation of Peak-to-Average
Power Density Ratio 270
6. 27 Net Fuel Cycle Cost for Fuel
Discharged at Various Times 271 6. 28 The Behavior of the Peak-to-Average
Power Density Ratio for Various
Control Poison Removal Techniques 275 6. 29 The Behavior of the Peak-to-Average
Power Density Ratio for Various Enrichments with Uniform Poison
Removal 277
6. 30 Net Fuel Cycle Cost as a Function of
Enrichment 278
6. 31 The Use of Burnable Poison in Control
Limited Reactors 281
6. 32 Total Energy Cost as a Function of
Enrichment for the CANDU Reactor
Optimized for Batch Irradiation 291 6. 33 The Time Behavior of Average Burnup
and the Peak-to-Average Power
Density Ratio with 2 Radial Zones 295 6.34 The Time Behavior of Average Burnup
and the Peak-to-Average Power
Density Ratio with 3 Radial Zones 296 6. 35 The Total Energy Cost During the
Startup Period of 2- and 3-Zone
CANDU Reactors 298
6. 36 The Variation of Total Energy Cost with Enrichment for Reactors
Figure No. Title Pag 6. 37 The Variation with Enrichment of
Maximum and Average Burnup for Continuous Outin and
Graded Irradiations 315
6. 38 The Variation with Enrichment of the Peak-to-Average Power Density
Ratio 317
6. 39 The Variation with Enrichment of Net
Fuel Cycle Cost 318
6.40 The Total Energy Cost as a Function of Enrichment for Various Fuel
and Poison Management Techniques 325 6.41 The Total Energy Cost as a Function of
Maximum Burnup for Various Fuel
and Poison Management Techniques 328 6.42 The Effect of Various Degrees of Excess
Neutron Distribution Between
I. ABSTRACT
THE EFFECT OF FUEL AND POISON MANAGEMENT
ON NUCLEAR POWER SYSTEMS by
N. B. McLeod, M. Benedict
K. Uematsu, H. L. Witting, and K. S. Ram
The FUELMOVE Code, which is described in this work, is a two-dimensional, two-group fuel depletion code developed for the purpose of studying the effect of fuel and control poison management on nuclear power systems which are fueled with U-235, U-238, and their irradiation products. The code source language is FORTRAN for use on IBM 704, 709, 7090 or Philco TRANSAC computers which have 32K of fast memory.
One of the principal advantages of the code is that it is capa-ble of evaluating the important gross characteristics of reactor per-formance and their history throughout fuel lifetime with a minimum
of computer time expenditure. A typical fuel history can be obtained in approximately one minute on the IBM 7090 computer. Its com-parative accuracy is such that it is able to eliminate from further
consideration all but the most promising fuel management techniques being considered under a given set of conditions.
FUELMOVE is actually written as two separate codes, the FUEL Code and the MOVE Code. In the FUEL Code, the
homogen-ized reactor unit cell properties are evaluated as a function of flux-time. The properties at specified flux-times are then put out on punched cards and/or magnetic tape for subsequent use by the MOVE Code. The MOVE Code represents fuel by its flux-time, and fuel transfer by flux-time transfer. It evaluates flux and power density distributions, control poison requirements, the criticality factor and average core properties throughout fuel lifetime, and when fuel is discharged, it obtains the nuclide concentrations, fuel burnup, fuel
cycle cost, and total energy cost.
The important fuel management techniques available in the MOVE Code are 1) Batch irradiation in which the entire core is
re-reactor is divided into equal-volume radial zones. Fuel is discharged from the central zone, fuel in the other zones is moved one zone in-ward and fresh fuel is charged to the outer zone. 3) Bidirectional
irradiation in which fuel moves axially inside pressure tubes from one end of the reactor to the other end, with fuel moving in opposite directions in adjacent channels. Also available are continuous outin and continuous graded irradiations.
The important poison management techniques available in the MOVE Code are 1) Uniform removal of an arbitrary poison distri-bution, 2) Radial zone removal of an initially arbitrary poison dis-tribution, 3) Axial bank removal of an initially arbitrary poison distribution, and 4) Poison removal to maintain a specified constant power density.
The MOVE Code treats cylindrical reactors with azimuthal symmetry, whose reflector can be represented by a reflector savings, and whose behavior can be represented by 150 regions, 10 axial by
15 radial. Up to five radial zones of arbitrary dimensions can be
used, and up to five different fuel types can be specified at any one time, one per radial zone.
The neutron behavior model used in the FUEL Code has been checked by making a comparison of its predictions with experimental data on the irradiation of natural uranium metal in the NRX Reactor. The uranium and plutonium nuclide concentration predictions agree very well with the experimental values. In the comparison of reacti-vities, there is a constant discrepancy of about 0. 6% in reactivity, which may be due to uncertainties in fission product yield data. If this discrepancy is removed, there is excellent agreement between the FUEL Code predictions and experiment.
The FUELMOVE Code was used to study the effect of various fuel and poison management techniques on the CANDU reactor, which is a D 0 moderated and cooled, 200 Mwe power reactor designed to use natural uranium fuel and the bidirectional fueling technique. This study showed the important relationship between neutron economy, fuel burnup, and control requirements. With bidirectional fueling, the fuel cost and control requirement are minimum, and fuel burnup and neutron economy maximum. With batch irradiation, the exact opposite is true. The discontinuous outin irradiation results in per-formance which is intermediate between the two extremes presented
by the batch and bidirectional techniques. The use of bidirectional fuel management permits a fuel cost of about 1. 1 mills/kwh at between
1. 0 and 1. 3% enrichment, based on A. E. C. prices and $60/kg
fab-rication cost. Batch irradiation fuel costs are over 2. 0 mills/kwh while the discontinuous outin fuel costs are intermediate between these.
C HAPTER II
INTRODUCTION
The main objective of this work has been to develop a general systematic method for evaluating the effect of various fuel and poison management techniques on large thermal nuclear power systems in various stages of design or operation, and to illustrate the capability of this method by application to a specific reactor design. The method has been incorporated into the new nuclear reactor depletion code,
FUELMOVE.
The approach taken to this problem by the FUELMOVE Code is best illustrated by contrast with other reactor depletion codes. Proba-bly the best known are the CUREBO system of General Electric (A21),
and the TURBO system of Westinghouse (C21). These systems, which are for the IBM 704 Computer, have been extended and rewritten for the Philco TRANSAC computer as the KARE system (A22) and TNT-1 (C22) respectively. They are similar in the following respects. First, their mesh spacings are usually substantially less than a neutron mi-gration length. Secondly, fuel burnup is calculated on a point-by-point basis. These systems are therefore capable of burnup calculations with very detailed flux shapes. In certain burnup studies, however, this detail is neither necessary nor desirable. In particular, surveys of parameters such as enrichment do not require detailed flux shapes, provided the gross flux shape is accurate enough to yield the correct
average leakage and power distribution.
The FUELMOVE Code, in contrast to the CUREBO and TURBO systems, uses mesh spacings which are generally the same order of size as the migration length. Also, fuel burnup is calculated on a flux-time basis rather than by point-by-point depletion. The result of this is that the FUELMOVE Code can perform burnup calculations in 1/10
to 1/20 of the computer time required by the more elaborate systems. The FUELMOVE Code does not attempt to obtain the flux fine-structure that is necessary for detailed studies of hot spots or the effect of indi-vidual control rods. Its major merit is that it is capable of evaluating the fuel burnup and gross power shapes of a large number of potential fuel and poison management techniques, and to do this with a minimum
of computer time expenditure. Its comparative accuracy is such that it is able to eliminate from further study all but one or two of the most promising from a group of potential fuel and poison management tech-niques being studied under a given set of conditions.
The starting point in the development of FUELMOVE has been the nuclear reactor burnup code FUELCYC which was developed by R. T. Shanstrom (S41) in a previous phase of the Fuel Cycle Study
Project at MIT. In the current phase of the study, emphasis has been placed on the fuel cycle as a part of the overall power system, rather than as a separate entity. This has led to consideration of the type of compromises that are necessary between fuel costs and fixed (capital) costs in the design of an optimum nuclear power system.
The neutron behavior model of FUELMOVE is similar to that of FUELCYC. The principal changes are in the treatment of fission products, the addition of (optional) burnable poison, more flexibility with regard to both thermal and resonance disadvantage factors, and simpler preparation of input data. The condensed Crout reduction technique developed by Shanstrom for the solution of the spatial flux equations in FUELCYC has been retained in FUELMOVE. Because it is both convenient and conservative of computer time, the FUEL-MOVE Code has been divided into two separate codes, the FUEL Code and the MOVE Code. In the FUEL Code, the flux-time dependence of nuclide concentrations and fuel properties is computed for a specified type and enrichment of fuel. This information plus geometrical data for the given reactor is subsequently used by the MOVE Code which computes spatial flux shapes and power densities during fuel burnup, obtains the discharged fuel properties and burnup and computes fuel
poison management techniques which are written into the MOVE Code. The common bases for comparison of the results of various fuel and poison management studies will now be developed, since this has been of some influence in the writing of FUELMOVE.
Generally, fuel and poison management studies on a particular reactor type will be based on a specific unit cell design. This will presumably have been evolved through the normal design compromises between safety, structural design, heat removal, reactivity and cost
considerations. The assumption implied here is that a specified unit cell design is an adequate common starting point in a fuel and poison management survey.
A given unit cell design generally has a maximum permissible power density associated with it. This may be imposed by one or a combination of factors such as a central fuel temperature limit, a
corrosion or film boiling limited cladding surface temperature, a maxi-mum permissible heat flux, or a limit imposed by the rate of fission product release into the coolant. For example, in design of the CANDU
reactor (L61), thermal output has been limited to a local linear power density of 537 watts/cm of fuel rod length. In any case, this type of limit will be a common factor in the study. Another parameter which may impose a limitation is the enthalpy rise of the coolant between inlet and outlet of the coolant channel, but this also depends upon coolant flow rate, and is therefore not the type of limit that might be generally applied in an analysis of fuel and poison management tech-niques. Therefore, only the limits imposed by a maximum permissible power density will be considered in this work.
Because comparisons will generally be made on the basis of energy cost, the unit cost data must be the same for each case, and should be as representative as possible of the cost situation that will prevail during operation of the reactor.
Additional common bases for comparison of fuel and poison management techniques will depend on the purpose of the study. If its purpose is part of the design study for a new reactor, then all compari-sons should be based on peak-power-density-limited output from systems
operating at equal net power. If it involves changes to be made in a currently operating system, at current net output, comparisons will be based on fuel cost, and the effect of fueling down-time on total
cost, since all other factors will be nearly constant. If a currently operating system is to be operated at increased output, by improving the power density distribution, comparisons will be based on peak-power-density-limited situations at constant core volume.
The above serves to introduce the following classifications of fuel and poison management studies, into one of which most studies will fall, depending upon its basic purpose.
(1) Fixed core volume, fixed output. Into this group fall
burnup and fuel cycle cost surveys which generally are not limited by peak power density considerations. This study type is a convenient starting point for the other two study types.
(2) Fixed core volume, variable output. Into this group will fall those fuel and poison management studies aimed at
increasing the output of a given reactor core. The output will be determined by the peak-to-average power density ratio, since the peak power density is specified. This study is best accomplished by normalizing the applicable results of the pre-vious study classification (1) to the specified peak power density.
(3) Fixed output, variable core volume. Into this group will fall all initial design studies which have a specified output and a
specified peak power density limitation. The core volume will be adjusted to yield the specified output and will be governed by the peak-to-average power density ratio, since the peak value
is specified. This study is also best started using results from the first study classification.
In the writing of the FUELMOVE Code, an attempt has been made to keep relative degrees of approximation and/or model sophistication at a consistent level in each part of the code so as to produce accurate results in a minimum of computer time. Because of uncertainties in basic nuclear data, a high degree of model sophistication and
compu-tational accuracy is unjustified for a survey code such as FUELMOVE. Certain factors not treated by the FUELMOVE Code may influence reactor design and fuel cycle optimization. For example, the coolant temperature and flow rate may affect the local maximum permissible power density. Also, local variations in power density due to control rods or lattice heterogenerities may be important. The effects of different fuel rod diameters and lattice spacings can be studied by treating these variations individually as different types of fuel.
To lend coherence and consistency to the studies performed in this work, a particular reactor design is studied. The 200 mwe CANDU reactor which uses D20 moderator and coolant was chosen. This
reactor is capable of essentially continuous fueling at full power and is therefore capable of being operated using virtually any practical fueling technique.
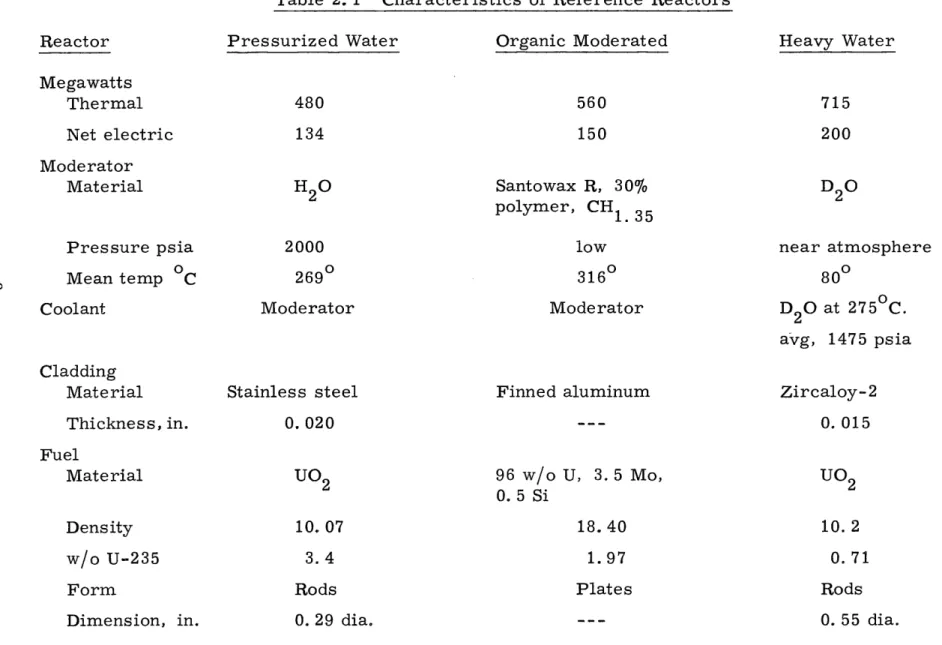
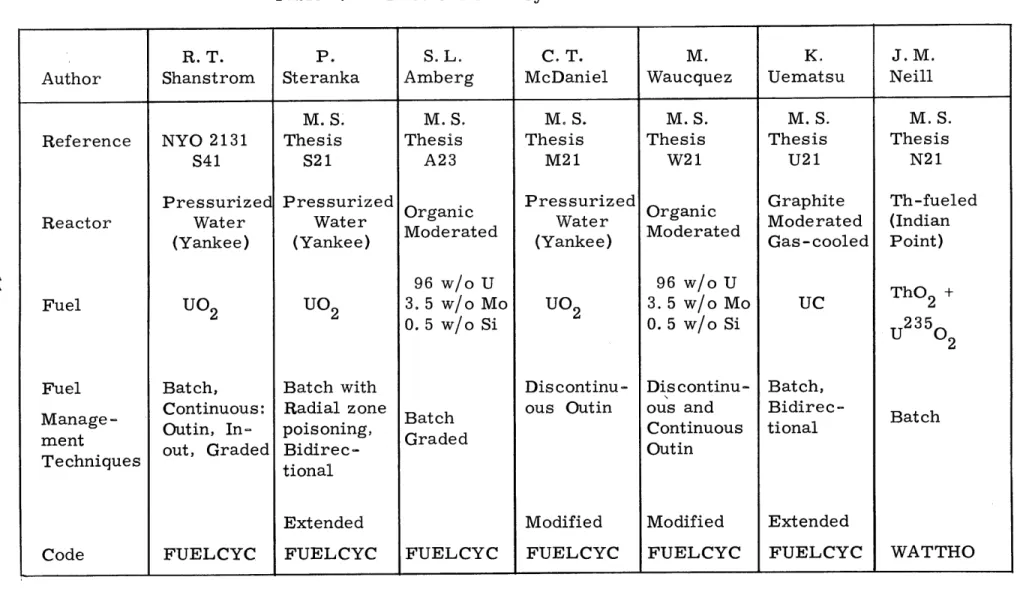
The CANDU reactor is the third of a sequence of reactors having progressively better neutron economy which have been studied by the MIT Fuel Cycle Project at the request of the AEC. The other two reactors are (1) the pressurized water reactor (Yankee) andIthe organic moderated reactor. The basic characteristics of the three reactors are listed in Table 2.1. Table 2.2 lists the theses which have been done at MIT on the Fuel Cycle Study Project.
The principal results of these theses have been summarized in two papers in Nuclear Science and Engineering (S22, B21).
Table 2. 1 Characteristics of Reference Reactors
Pressurized Water Organic Moderated Heavy Water
Megawatts Thermal Net electric Moderator Material 480 134 560 150 H20 Santowax R, 30% polymer, CH1.3 5 Pressure psia Mean temp C 2000 2690 Moderator low 3160 Moderator near atmosphere 800 D20 at 2750C. avg, 1475 psia Cladding
Material Stainless steel
Thickness, in. Finned aluminum 0.020 Zircaloy-2 0. 015 Fuel Material Density w/o U-235 Form UO 2 10.07 96 w/o 0. 5 Si U, 3. 5 Mo, 18.40 3.4 Rods 1.97 Plates Dimension, in. Reactor Coolant 715 200 D20 UO 2 10.2 0.71 Rods 0. 29 dia. 0. 55 dia.
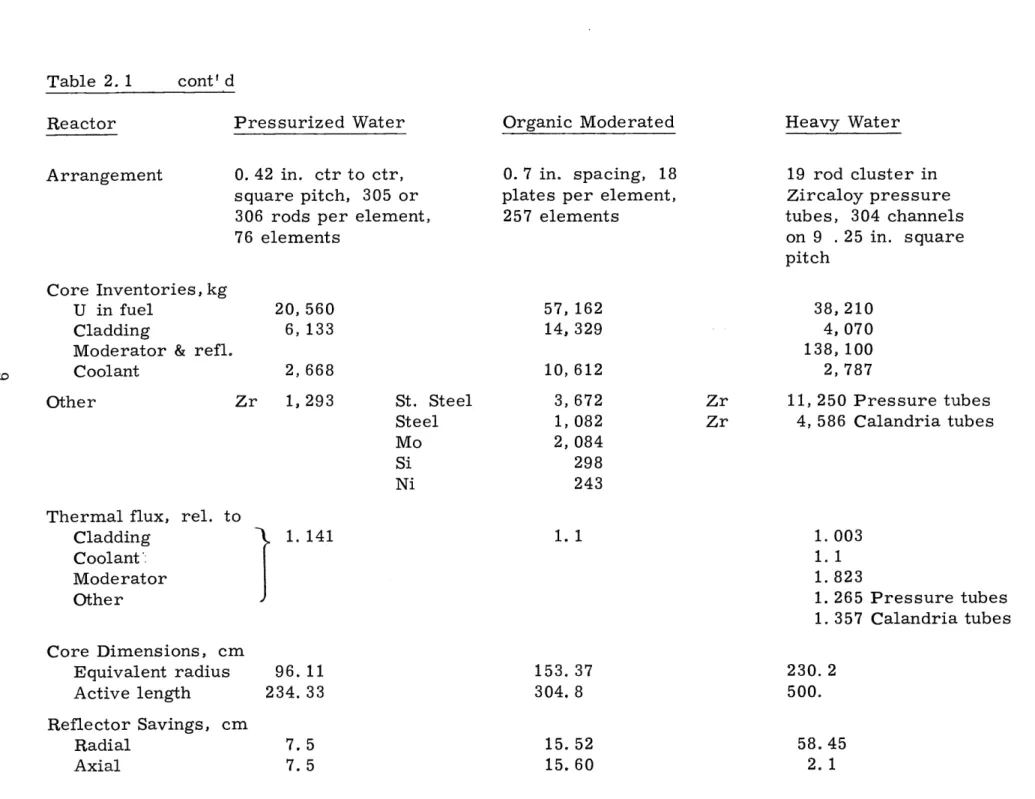
Table 2. 1 cont' d Reactor Arrangement Pressurized Water 0. 42 in. ctr to ctr, square pitch, 305 or
306 rods per element, 76 elements
Organic Moderated
0. 7 in. spacing, 18
plates per element,
257 elements Heavy Water 19 rod cluster in Zircaloy pressure tubes, 304 channels on 9 .25 in. square pitch Core Inventories, kg U in fuel Cladding
Moderator & refl. Coolant
Other
Thermal flux, rel. to
Cladding Coolant; Moderator Other Core Dimensions, cm Equivalent radius Active length Zr 1,293 St. Steel Steel Mo Si Ni
I1.
141
96. 11 234. 33 3, 1, 2, 672 082 084 298 243 Zr Zr 1. 1 153. 304. 11, 250 Pressure tubes 4, 586 Calandria tubes 1. 003 1. 1 1. 823 1. 265 Pressure tubes 1. 357 Calandria tubes 230. 2 500. 37 8 20,560 6, 133 2, 668 57, 162 14, 329 10, 612 38,210 4, 070 138, 100 2,787Table 2. 1 cont' d
Reactor Pressurized Water Organic Moderated Heavy Water
D, diff. coeff. , cm 0.2755 0. 604 1.002
'2", Fermi age, cm 2 51.5 81. 5 143.5
e, Fast fission factor 1.0584 1.053 1. 0173
p8, U-238 res. escape prob. 0. 738 0. 729 0. 8925
B2, Geometric buckling m-2 6.93 2.903 1. 08
Avg. Power Density kw/1 70.6 24. 86 8.60
Avg. Specific Power kw/kg U 23. 3 9. 8 18. 7
pMOD' resonance escape probability for structural
Table 2. 2 Previous Fuel Cycle Theses at M. I. T.
R. T. P. S. L. C. T. M. K. J. M.
Author Shanstrom Steranka Amberg McDaniel Waucquez Uematsu Neill
Reference Reactor Fuel Fuel Manage -ment Techniques Code NYO 2131 S41 Pressurized Water (Yankee) UO 2 Batch, Continuous: Outin, In-out, Graded FUELCYC M. S. Thesis S21 Pressurized Water (Yankee) UO 2 Batch with Radial zone poisoning, Bidirec-tional Extended FUELCYC M. S. Thesis A23 Organic Moderated 96 w/o U 3. 5 w/o Mo 0. 5 w/o Si Batch Graded FUELCYC M. S. Thesis M21 Pressurized Water (Yankee) UO 2 Discontinu-ous Outin Modified FUELCYC M. S. Thesis W21 Organic Moderated 96 3. 5 0. 5 w/o U w/o Mo w/o Si Discontinu-ous and Continuous Outin Modified FUELCYC M. S. Thesis U21 Graphite Moderated Gas-cooled UC Batch, Bidirec-tional Extended FUELCYC _____________ .1 I .8 4 ___________ M. S. Thesis N21 Th-fueled (Indian Point) ThO + 2 U2350 Uat02 Batch WATTHO I.
C HAPTER III
SUMMARY
A. FUELMOVE CODE DESCRIPTION
1. Introduction
The FUELMOVE Code is a two-dimensional, two-group fuel depletion code written for the purpose of studying the effect of fuel and control poison management on nuclear power systems. The code source language is FORTRAN, for use on IBM 704, 709, 7090 or Philco TRANSAC computers which have 32K fast memories.
The approach to the problem of fuel and poison management is as follows. The homogenized reactor unit cell properties are evalu-ated as a function of flux-time. Then, representing fuel by its flux-time and fuel transfer by flux-flux-time transfer, the reactivity and power histories of nuclear fuel can be obtained for various fuel and poison
management techniques. This data is then used to evaluate fuel cycle, and total energy costs. Because the above computation falls naturally into two separate parts, the FUELMOVE Code is written in two sections:
1. The FUEL Code calculates the unit cell properties as a function of flux-time and transfers the results to magnetic tape and/or punched cards.
2. The MOVE Code, using the output of the FUEL Code, calculates macroscopic core properties such as flux and power density during operation, moves fuel in various specified ways, adjusts control poison for criticality, and when spent fuel is discharged, computes burnup and also energy cost.
The objective of the FUELMOVE Code is to provide the means of evaluating the fuel burnup and gross power shape histories of a large
number of potential fuel and poison management techniques, and to do this with a minimum of computer time expenditure. In order to
mini-mize computer time, an attempt is made to maintain a comparable level of accuracy between numerical methods and the neutron behavior model, so that the magnitude of error from these sources will be less than that due to the uncertainties in basic nuclear data. As typical examples of computer time expenditure using an IBM 7090, the FUEL Code will obtain complete flux-time histories of different reactor unit cells at the rate of one to two per minute and the MOVE Code will use
about one minute of time in computing the reactor core properties during irradiation and final energy costs for batch irradiation, using a 7 X 7 mesh size.
An outline of the basic features and calculational techniques of each part of the FUELMOVE Code will now be given, followed by a summary of code capabilities and limitations.
2. The FUEL Code
The basic steps in the FUEL Code computation of fuel properties as a function of flux-time are outlined below.
1) The necessary input and control data are read in.
2) From the specified material concentrations and the energy dependence of cross sections which is written into the code, the neutron energy spectrum below 0.45 ev is obtained by
solving the Wilkins equation.
3) Using this thermal spectrum, plus the energy dependence of
neutron cross sections, thermal-spectrum- averaged cross sections are obtained.
4) Resonance escape probabilities are computed from resonance integrals, nuclide concentrations and resonance disadvantage factors.
5) Using thermal plus resonance reaction rates, the changes in
nuclide concentrations in a specified flux-time interval are obtained from a fourth-order difference solution of the ma-terial balance equations.
6) The thermal spectrum, average cross sections and
reso-nance escape probabilities are evaluated, and the re-quired properties at this flux-time step are computed.
7) Steps 5 and 6 are repeated a specified number of times, so
that all properties in the desired flux-time range are evaluated.
8) The fuel properties at specified flux-times are put onto
punched cards and/or magnetic tape for subsequent use by the MOVE Code.
3. The MOVE Code
The MOVE Code uses the flux-time properties from the FUEL Code plus input data specifying core geometry to obtain the fuel, flux, and power density behavior during fuel burnup for a specified fuel and poison management technique.
The MOVE Code uses two-dimensional diffusion theory in an axially symmetric cylinder, with two groups of neutron leakage, fast and thermal.
The fuel management techniques written into the MOVE Code are:
1) Batch Irradiation of fuel which is fixed in place in the core.
Criticality is maintained by the use of control poison.
2) Discontinuous Outin Irradiation in which the reactor core is divided into a number of equal-volume radial zones. When the reactor which is operated batchwise ceases to be critical with all the control poison removed, the fuel in the central zone of the reactor is discharged and the fuel in the other zones is moved one zone inward, with new fuel being charged to the now vacant outermost zone.
3) Discontinuous Bidirectional Irradiation in which the fuel in a
given axial channel is divided into a number of equal lengths. When the reactor, which is operated batchwise, ceases to be critical with all of the control poison removed, fuel is pushed axially, and in opposite directions in adjacent channels, until
one of the lengths of fuel is discharged. This discharged fuel may be recharged to the adjacent channel, or new fuel can be charged.
4) Continuous Bidirectional Irradiation in which fuel moves at a constant axial velocity along a channel from one end of the reactor where it was charged to the opposite end where it is discharged. Fuel moves in opposite directions in adjacent channels, and the charging rate is adjusted so as to main-tain criticality without the use of control poison.
5) Continuous Outin Irradiation in which fuel rods are charged
to the outside of the reactor core, are moved radially in-ward and are discharged from the central axis of the reactor. The fuel charge rate is adjusted so that the reactor is just critical without the use of control poison.
6) Continuous GradedIrradiation in which fuel rods are
irradi-ated while fixed in place in the reactor. They are replaced individually so that every region of the reactor contains fuel elements distributed uniformly in exposure between the fresh and discharge burnup condition. The fuel charge rate is adjusted to maintain criticality without the use of control poison.
The poison management techniques written into the MOVE Code are:
1) Uniform removal of control poison with an arbitrary spatial
distribution. The magnitude is varied for reactivity control. 2) Radial zone poison removal of an arbitrary initial shape.
The magnitude is computed for initial criticality. Poison is removed starting at the bottom of the outermost zone and progressing axially upward. When poison has been removed from one zone, removal starts on the next zone toward the center.
3) Axial bank poison removal of an arbitrary initial shape. The
magnitude is computed for initial criticality. Poison is then removed, starting at the bottom of the core, and is removed axially, the height of the control rods being uniform radially.
4) Poison removal for constant power density. The spatial distribution of the poison is determined by a desired input power density shape. Burnup proceeds until the approach of a zero or negative poison condition causes a change to a specified alternate poison removal technique.
5) A constant fixed poison, arbitrary shape. This poison can
be used in conjunction with those mentioned above, except that it is not removable. Its purpose is solely that of power density shaping.
6) Uniform removal of a poison with specified relative spatial
distribution whose magnitude is varied for reactivity control. When the poison has been completely removed, removal is started on additional control poison whose specified shape and magnitude has been held constant up -to this point. Re-moval of this latter poison can take place uniformly, by radial zone or axial bank removal, as outlined above.
The MOVE Code obtains the thermal flux shape in the following manner. The neutron balance in any region of the reactor is expressed in finite difference form in terms of the flux in that region and the four adjacent regions. Some of the parameters in the balance equation are dependent upon the properties and hence the flux-time of the fuel in that region, while other parameters depend upon the geometry of the region. A system of linear equations, one for each region, is hereby obtained, and these can be solved by an iterative Crout Reduction tech-nique, to obtain the flux in each region. In order that this flux be the correct flux, however, the neutron balance on the whole reactor mtist be such that the reactor is just critical. In the batch-type irradiations, this means that the correct control poison must be used, and in the con-tinuous irradiations, the fuel charging rate must be adjusted so as to just maintain criticality.
Actually, before the above procedure can be applied, it is necessary to know the flux-time in each region of the reactor so that the properties and hence. the flux coefficients in the system of equations can be obtained. There are two general methods of doing this. In
batch-type irradiations, the flux-times everywhere will be zero at the start-of-life. Hence, the fluxes can be obtained by solving the system of equations using the properties at zero flux-time. If these fluxes are assumed to remain constant for a specified time, the flux-times at this new time are obtained directly. Batch irradiation proceeds step-by-step, with the new flux-time in each region being obtained by adding the new flux-time increment to the old flux-time. When the reactor
ceases to be critical without control poison, part, or all of the fuel is discharged, and the flux-times at discharge are used to obtain the nuclide concentrations and burnup of the spent fuel, and fuel costs can then be obtained.
In the continuous irradiations, a somewhat different approach is taken when evaluating flux-times in each region. If a character-istic flux-time of fuel discharged is specified, all flux-times in the reactor can be related to this number in a manner which depends upon the particular fueling technique, and which requires knowledge of the spatial flux shape. Hence, a double-it erative process is required, in which an assumed flux shape is used with an initial characteristic flux-time estimate. The inner iteration is performed to obtain the correct flux shape corresponding to the given characteristic flux-time estimate. The outer iteration is performed to obtain the characteristic flux-time which corresponds to a just-c ritical reactor. As before, the discharge flux times are used to obtain fuel burnup and fuel cost.
4. The Limitations of FUELMOVE
There are two basic reasons for the limitations to the FUEL-MOVE Code. The first of these is the fact that because of the large mesh spacing, it is impossible to follow local flux and power density variations which may be due to lattice heterogeneities and control rods. Hence, the detailed effects of various control rod removal programs
cannot be adequately treated, although their gross effects can.
The second basic limitation is imposed by the range of validity of the assumption that fuel behavior during irradiation can be adequately represented as a function of the single variable, thermal flux-time. This is a valid assumption provided that resonance reaction rates are
either small compared to thermal, or can be adequately predicted. The major cause of potential difficulty with resonance reaction rates is the behavior of P, the fast non-leakage probability. This quantity is assumed to be a constant in the computation of fuel properties during irradiation,
and in large power reactors this is a valid assumption.
The FUELMOVE Code will therefore be limited in applicability to large reactors in which the majority of fissions occur at thermal
energies, whose spatial characteristics are adequately represented by up to 150 regions, 10 radial by 15 axial, and whose reactor unit cell
B. THE EVALUATION OF THE NEUTRON BEHAVIOR MODEL
The neutron behavior model of the FUEL Code was evaluated by comparing its predictions of the irradiation behavior of natural uranium metal NRX fuel rods, with actual measurements of nuclide concentrations and reactivity changes which were obtained as the result of the cooperative efforts of scientists at Chalk River, Canada, and Harwell, England.
Good agreement between experimental nuclide concentrations data and concentrations predicted by the FUEL Code was found for U 235, Pu239
240 241 242
and Pu2. Experimental concentrations of Pu and Pu however, increased somewhat more rapidly with flux-time than predicted by the MOVE Code, witlout adjusting any cross-sections. For these nuclides, better agreement between experimental data and the FUEL Code was ob-tained by modifying the treatment of resonance absorption of Pu 240, which is handled in the FUEL Code by the Crowther-Weil technique (C42). When the cross-section for resonance neutrons in uranium metal fuel was changed from the true value of 1152 bifa (barns per initial fissile atom) to an ad-justed value of 230 bifa, good agreement between experiment and the FUEL Code was obtained for all nuclides, as shown in Figure 3. 1. Table 5. 4, p. 176, shows, however, that even with the true cross-section of 1152 bifa,
agreement between experiment and prediction is still satisfactory.
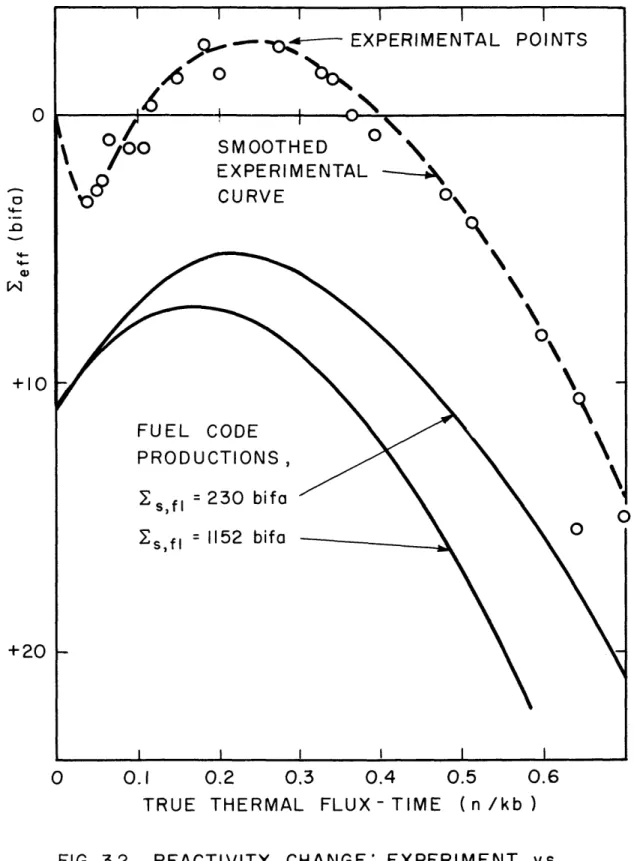
Shown in Figure 3. 2, is the comparison of reactivity change in bifa between the experimental data and FUEL Code predictions, using the origi-nal value of fuel scattering cross-section (1152 bifa) and the changed value
(230 bifa). Both predicted values are lower than the observed values by about 8 bifa. The discrepancy which is apparent here has also been noted by the Canadian group at Chalk River (W41), using a neutron behavior model which is different from that of the FUEL Code. There is a presumption,
therefore, that the models may not be wholly responsible for the discrepancy. Because of the correspondence in shape after the initial discrepancy, there is a possibility that a short term effect is to blame, possibly inaccu-racies in the yields of the Sm group fission products. A one-year time lapse between end of irradiation and reactivity measurement may also have some bearing on the discrepancy.
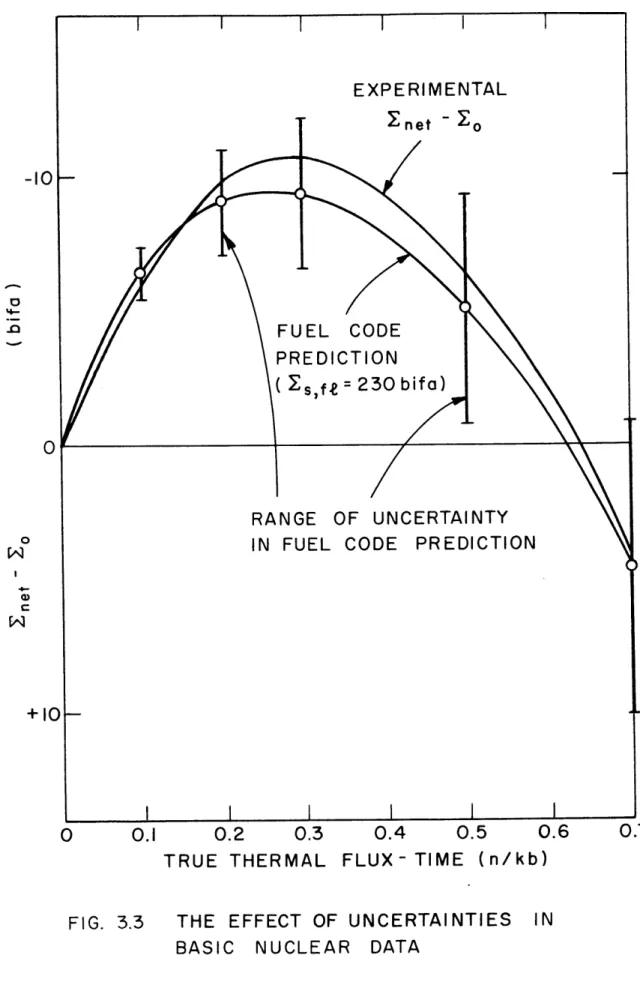
When the initial discrepancy is removed, as shown in Figure 3. 3, there is excellent agreement in reactivity shape. Also shown on this
0.4 0.3 - INm vz v Es~ft =230 bifa 0.2 -0 t 239 LPu ui ~ U235 P -J AU >) 0.1 < 0.08 z EXPERIMENTAL~ cr 0.06 POINTS C- O U235 CHANGE + Pu2 3 9 0.04 -+P 0.4 A Pu2 4 0 0.03 - 0 Pu2 41 Pu 240 xlO 0.02 Pu241 x 100 0.015 0 0.2 0.4 0.6 0.8 FLUX - TIME (n/kb)
FIG. 3.1 FUEL CODE NUCLIDE
CONCENTRATIONS COMPARED
WITH EXPERIMENTAL ANALYSIS
SMOOTHED EXPERIMENTAL CURVE 0 FUEL CODE PRODUCTIONS, +10 +20 230 bifa 1152 bifa 0.1 0.2 0.3 0.4 0.5 0.6
TRUE THERMAL FLUX - TIME (n /kb
)
FIG. 3.2 REACTIVITY CHANGE: EXPERIMENT vs
FUEL CODE PREDICTION
0 s,,Sf I
Es,f
= 0 0 0'%0\
0\
EXPERIMENTAL 2net - 20 FUEL CODE PREDICTION ( Es,fe = 230 bi RANGE OF UNCERTAINTY IN FUEL CODE PREDICTION
0 0.1 0.2 0.3 0.4 0.5 0.6
TRUE THERMAL FLUX- TIME (n/kb)
FIG. 3.3 THE EFFECT OF UNCERTAINTIES IN
BASIC NUCLEAR DATA
-10 0 *-0) C 0.7
graph is the range of uncertainty in the FUEL Code prediction due to uncertainties in basic nuclear data used in the Code. This large range of uncertainty indicates that if the FUEL Code is given adequate data on initial conversion ratio and the Pu240 disavantage{actor, that un-certainties in basic nuclear data will be more dominant than neutron behavior model errors.
C. THEI RESULTS FROM THE STUDY OF FUET AND POTSON
MANAGEMENT TECHNIQUES 1. Introduction
The FUELMOVE Code has been used in a study of possible fuel and poison management techniques in the CANDU reactor, which is the 200 mwe, D20 moderated and cooled, pressure tube power reactor presently under construction at Douglas Point, Ontario. This reactor is being designed specifically to use natural uranium oxide fuel and the bidirectional fueling technique.
2. FUEL Code Results
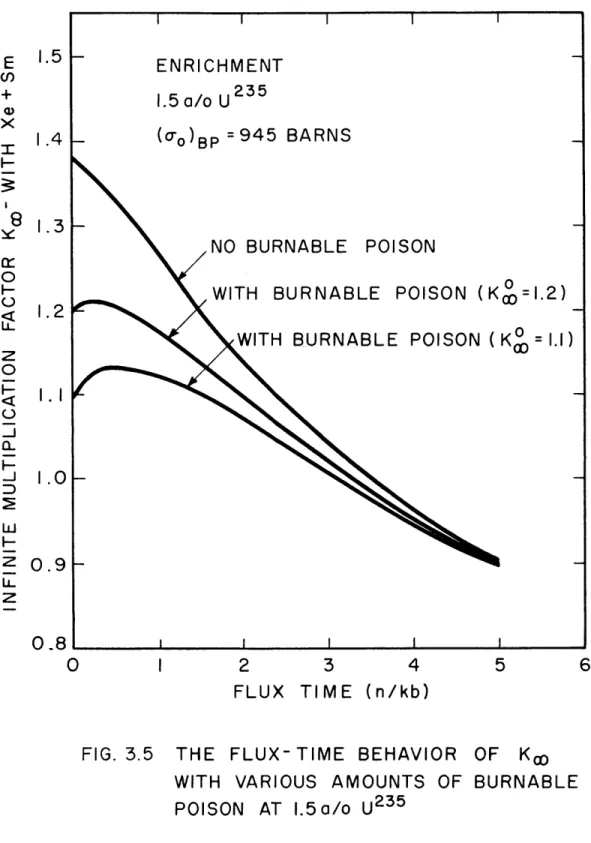
The FUEL Code was used to obtain the various properties re-quired by the MOVE Code in its calculation. These properties were obtained at certain discrete enrichments from natural to 2.5 a/o. One of the significant ways of summarizing these results is given in Figure 3.4, which shows k, as a function of flux-time for various enrichments. The k, is defined here as the production rate of thermal neutrons
divided by the absorption rate of thermal neutrons. In addition to this, a study of the potential usefulness of burnable poison was performed, using Li6 (a- = 945b) as the burnable poison. Initial Li concentration
was adjusted to obtain initial k.,'s of 1.1 and 1.2 for various discrete enrichments from 1.3 to 2.0 a/o. The resulting flux-time behavior at
1.5 a/o is shown in Figure 3.5. 3. The MOVE Code Results
The common bases for comparison of various fuel and poison management techniques will depend upon the objective of the study. If
a new reactor system is being designed, the comparison of techniques should be on the basis of equal power output from reactor cores oper-ating at some specified limit, such as a maximum permissible power density limit. The comparisons in this work have been made on this basis.
The important fuel management techniques studied in this work are bidirectional, batch and discontinuous outin irradiation, and the summary given below will be in that order.
E Cl) 0 0 0
U-z
-z
1.6 1.5 1.4-K 00 (-4 1.3 C5 EN 1.2 -0 0 l.O 0' o to L 1.01 0.9-0.8 1 1 I 0 I 2 3 FLUX FIG. 3.4 VARIATION 4 TIME 5 6 (n/kb) OF KOD 7 DURINGBURNUP, CANDU REACTOR UNIT
e V Ef P < (I -p)>)(2- E xe + C5 Xxe, max
)
- Xe Fraction BURNED RICHMENT C 5 NAT 0.90 1.0 /o 0.885 1.5 /o 0.87 2.5 /o 0.846
I 2 3 4 5
FLUX TIME (n/kb)
FIG. 3.5 THE FLUX-TIME BEHAVIOR
WITH VARIOUS AMOUNTS OF BURNABLE
POISON AT 1.5a/o U2 3 5 E <) x 9 0 0 z 0 -J D E
z
'.5 1.4 1.3 1.2 1.1 1.0 0.9 0.8L 0 OF KcoThe actual CANDU reactor will use bidirectional fuel manage-ment with the reactor divided into two radial zones. In order to flatten the power distribution, the fuel in the inner zone is irradiated to about
1.35 times the burnup of the outer zone. An average burnup of 8850 MWD/T
is predicted (H4 2) when operating at a maximum power density of 17.0 kw/1.
The MOVE Code predictions of 9,080 MWD/T and 17. 5 kw/1 are 2.5 % and 3% higher than the reference design values. Figure 3.6 shows a contour plot of the relative power density in the reference design, as predicted by the MOVE Code.
An enrichment survey for the continuous bidirectional fueling
technique in CANDU was performed, with the radial variation of discharge burnup specified in one of three ways: uniform discharge burnup, uniform
axial velocity of the fuel, or with the radial variation adjusted to obtain minimum peak power density. The results of this survey are summarized in Figures 3.7, 3.8, and 3.9. Figure 3.7 shows the variation of the peak-to-average power density ratio. In general, the vertical differences
among the three curves are due to differences in the radial flatness in the three methods of fueling, whereas the variation with enrichment is
due to the inherent axial flatness which is characteristic of the enrichment. Figure 3.8 shows the average burnup as a function of enrichment. The important points to notice here are the burnup penalties associated with the increased flatness obtained with Vz uniform or ed for minimum power density, and the fact that the percentage burnup penalty decreases with increasing burnup. Shown in Figure 3.9 are the fuel cycle costs which have a broad minimum in the range between 1.0 a/o and 1.5 a/o
enrichment. The sensitivity of these costs to the method of specifying discharge burnup should be noted at each enrichment. The fuel costs for natural uranium are very dependent upon leakage, which increases when the power distribution is flattened. Costs will also be most sensi-tive at natural enrichment to changes in the amount of absorption in
structural materials such as pressure tubes and fuel cladding.
The fuel and power distribution behavior was investigated for the period following the onset of bidirectional fueling. Due to the flatness of the power distribution at the end of batch irradiation, the problem of maintaining the peak-to-average power density ratio at a value less than
CENTER
FIG. 3.6 CONTOUR
RADIAL MESH POINT PLOT OF
CANDU REFERENCE
THE RELATIVE
DESIGN
i i d const. 2 1-const. 0d, min. pd. 0
Ur
Li 0 u 0 u 0 STEADY-STAT BIDIRECTIONAL NAT CONTINUOUS FUELING 1.0 1.3 -15 1.5 ENRICHMENT (a/o)FIG. 3.7 THE PEAK-TO-AVERAGE POWER DENSITY
RATIO IN THE CANDU REACTOR
VARIOUS ENRICHMENTS AND RADIAL
SPECIFICATIONS OF DISCHARGE FLUX-TIME
CANDU REACTOR -25 -- 2
z
I5 WJ 0 Lii 0 10 0.5 AT I i 3 -I I III
I
I-d const Vz const REFERENCE DESIGN 0d,min pd 0 r') 0 0~
z
m w 0 w NAT 1.0 1.3 1.5 ENRICHMENT (a/o) FIG. 3.8 AVERAGE BURNA FUNCTION OF
OF SPECIFYING
FLUX- TIME
UP IN THE CANDU REACTOR AS ENRICHMENT FOR VARIOUS WAYS
THE RADIAL SHAPE OF DISCHARGE
30 20h CANDU REACTOR: STEADY- STATE CONTINUOUS BIDIRECTIONAL FUELING IO-0 0.5 I I
CANDU REACTOR: STEADY -STATE CONTINUOUS BIDIRECTIONAL FUEL ING In 0 C) w -min pd a Vz const 0 d const NAT 1.0 ENRICHMENT 1.3 1.5 0/0
NET FUEL CYCLE COST IN THE CANDU
REACTOR AT VARIOUS ENRICHMENTS AND
RADIAL SPECIFICATIONS OF DISCHARGE
FLUX - TIME 3 2--COST BASIS '2 COST BASIS O 0 d 0 FIG. 3.9 I I I I I I I
the steady-state ratio is not important until about half the fuel in the initial batch loading is discharged. Even then, the peaking is not severe, although it exceeds the steady-state value by about 10% for a short period.
The important variables considered in batch irradiation, in addition to enrichment, are the spatial distribution and removal of control poison, the use of zones of different enrichment and the use of burnable poison. It became quickly evident for the relatively high enrichments required in batch irradiation, that the best poison
removal technique would have to be similar to uniform poison removal, since in axial bank and radial zone poison removal, excessive peaking occurs in the regions from which control poison has been removed. A fair degree of flattening can be obtained and maintained if the outer radial regions have less control poison. The use of zones of different enrichment is not justified on a fuel cost basis, since a single optimum enrichment will yield cheaper fuel costs. The fuel cycle cost is shown in Figure 3.10 for batch irradiation. The enrichment for minimum fuel cycle cost is apparently somewhat higher than 1.75 a/o, although it is doubtful that this high an enrichment would be practical due to the large excess reactivity.
The use of burnable poison is not justified as a means to reduce the total cost of control rods, since burnup losses cost more than any potential savings in control costs. However, the use of burnable poison is definitely justified for reactors which cannot use an optimum enrich-ment because of control limitations. This can be seen in Figure 3.1 1 in which fuel cycle cost is plotted against control poison requirement. It is apparent that use of burnable poison would effect substantial fuel cost savings in reactors in which fuel enrichment is limited by a maximum control requirement to a value substantially below an opti-mum enrichment, in this case 1.75 a/o.
The important problems to be considered with Discontinuous Outin Irradiation are the choice of enrichment, the choice of the number of radial zones, whether to use axial inversion of the fuel, how to control reactivity, and finally, how best to start up the reactor. The choice of the number of zones will be based on the degree to which better fuel
CANDU REACTOR BATCH IRRADIATION -- o h UNIFORM POISON -- COST BASIS I BASIS 2 1.5 ENRICHMENT 2.5 2.0 a/o
FIG. 3.10 NET FUEL CYCLE COST AS A
FUNCTION OF ENRICHMENT 6 (n E U) o 0 - 2 I F )I 0.5 COST 1.0 I I I I I S5 4 [-3 [
CA BA -U)
m
0o 0 0 LU 1.0 2.0 3.0 4.0MAXIMUM CONTROL POISON (cm-1
5.0
X 103) 6.0
FIG.3.11 GRAPH
POISON
ILLUSTRATING THE USE OF BURNABLE IN CONTROL LIMITED REACTORS
3.4 -3.2 h 5 a/o 3.0 2.8 1.3a/o + B.P' NDU REACTOR rCH IRRADIATION 15 a/o . -A1.3a/o 1.75a/o _ I.