HAL Id: hal-02608656
https://hal.inrae.fr/hal-02608656
Submitted on 16 May 2020
HAL is a multi-disciplinary open access archive for the deposit and dissemination of sci-entific research documents, whether they are pub-lished or not. The documents may come from teaching and research institutions in France or abroad, or from public or private research centers.
L’archive ouverte pluridisciplinaire HAL, est destinée au dépôt et à la diffusion de documents scientifiques de niveau recherche, publiés ou non, émanant des établissements d’enseignement et de recherche français ou étrangers, des laboratoires publics ou privés.
To cite this version:
R.S. Guthi. Wastewater treatment plant of the future: development of process for carbon capture and valorisation. Environmental Sciences. 2018. �hal-02608656�
WASTEWATER TREATMENT PLANT OF THE FUTURE:
DEVELOPMENT OF PROCESS FOR CARBON CAPTURE
AND VALORISATION
Report of PM3E Master Thesis undertaken at Irstea Lyon-Villeurbanne,
from 1
stMarch – 31
stAugust 2018.
Master Student
Company Tutor
School Tutor
Raja Sekhar Guthi
Raja-sekhar.guthi@
imt-atlantique.fr
Florent Chazarenc
[email protected]Yves Andres
[email protected]
ABSTRACT
Wastewater treatment using activated sludge process is a mature technology and has been in use for over 100 years. It is an energy intensive process, requiring considerable electrical energy for aeration to eliminate organic pollutants. In addition to creating energy demand and contributing to carbon dioxide emissions, it represents a high operating cost for the plant operators.
However, the organic pollutants represent a source of energy. Organic matter can be captured at the start of the treatment train and directed towards an anaerobic digester to considerably increase the biogas production. Innovative processes exist, which have to be tested in pilot scale before they are scaled up and implemented in existing WWTP. It can decrease the overall energy footprint of wastewater treatment and has the potential to be a source of energy.
A variation on conventional activated sludge process, called A-B process is a promising process to capture the organic matter at the head of the WWTP. Different technologies exist for capturing this organic matter as the first unit operation in the treatment train, such as chemically enhanced primary treatment and high rate activated sludge. With this guiding principle, “CAPTURE” project was launched in which this internship work was conducted.
The objective of this internship was to study the biological option to capture carbon by performing pilot scale experiments. A 3m3 bio-reactor present in Irstea’s research platform was
chosen for this study. This reactor was originally conceived to study extended aeration processes and hence needed considerable modification. The associated pumps and pipes were replaced to deliver high flowrates required. Its aeration system was tested
In the absence of a suitable secondary clarifier, and to proceed during the delay in procuring one, the reactor run as a Sequencing Batch Reactor. The reactor was fed with raw wastewater under real conditions, and its performance was measured after 4 days of continuous functioning. Parameters of interest are the capacity of aeration, removal efficiency of the reactor and settling properties of the sludge.
Firstly, the reactor’s capacity to oxygenate was measured – i.e., its volumetric mass transfer coefficient (KLa) – as 7.9 g O2 / h for an air flow rate of 290 NL/min in fresh water.
Performance of the reactor was measured as 37% of COD removal. Column settling experiments were performed with the mixed liqueur from the reactor to have data on the settling characteristics. This data is a key input in the design of a secondary clarifier.
Overall, the performance of the reactor is not satisfactory as the react phase of the SBR cycle was not sufficiently long for expected levels of carbon capture to occur. Should the aeration time be increased, the overall rate of the system will diminish and will no longer represent a high rate system. With these learnings, the next phase of the project will test a continuous fed reactor with a dedicated clarifier.
T
ABLE OF CONTENTS1.
I
NTRODUCTION... 5
2.
P
RESENTATION OF THE COMPANY... 5
2.1. The Group ... 5
2.2. Lyon-Villeurbanne Centre ... 6
2.3. REVERSAAL Department ... 6
3.
P
RESENTATION OF THE PROJECT... 7
3.1. Context ... 7
3.2. From WWTPs to WRRPs ... 7
3.3. Project Capture ... 8
3.3.1 Introduction 8 3.3.2 Main Stake Holders 9 3.3.3 Project Planning 10 3.4. Scope of the Internship ...10
4.
W
ORKU
NDERTAKEN... 11
4.1. Bibliography ...11
4.1.1 Wastewater Characteristics in France 11 4.1.2 COD Fractionation 11 4.1.3 The Water-Energy Nexus 12 4.1.4 Principle of carbon capture and valosiration in WRRP 13 4.1.5 Principle of Activated Sludge 14 4.1.6 Principle of A-B process 15 4.1.7 Research on HRAS as A-Stage 15 4.2. Methodology ...17
4.2.1 Internship Objectives 17 4.2.2 FEYSSINE Research Platform 17 4.2.3 Project Planning 18 4.2.4 Project Support Team and Communication 19 4.2.5 Reactor 19 4.2.6 SBR (Sequencing Batch Reactor) 20 4.2.7 Volumetric Mass Transfer Coefficient (KLa) 21 4.2.8 Column Settling Characteristics 22 4.3. Results of Works Undertaken ...23
4.3.1 KLA of the reactor 23 4.3.2 SBR Performance 23 4.3.3 Settling Characteristics 23 4.4. Future works ...25
4.4.1 SBR to CSTR (Continuous Stir-Tank Reactor) 25 4.4.2 Lamellar Settler Sizing 26 4.4.3 Modelling 26 4.5. General Conclusions ...26
5.
R
EFERENCES... 27
6.
A
PPENDIXES... 28
6.1. Organogram of Irstea Lyon-Villeurbanne Centre ...28
6.2. Technical Note #1: KLa – Theory and Measurement ...28 6.2.1 Principle Volumetric Mass Transfer Coefficient 28
6.2.2 Experiment Methodology 29
L
IST OFA
BBREVIATIONSAMERC Agence de l’eau Rhône Méditerranée
Corse
CAS Conventional Activated Sludge
BOD Biological Oxygen Demand
CEPT Chemically Enhanced Primary Treatment
CHP Combined Heat and Power
COD Chemical Oxygen Demand
CSTR Continuous Stir Tank Reactor
HDT Hydraulic Detention Time
HRAS High Rate Activated Sludge
MLSS Mixed Liqueur Suspended Solids
SBR Sequencing Batch Reactor
SS Suspended Solids
VSS Volatile Suspended Solids
WWTP Waste Water Treatment Plant
1. I
NTRODUCTIONThis report presents the 6-month master thesis undertaken as a part of M.Sc in Project Management for Environment and Energy Engineering. The internship offer was a part of a French national project titled ‘CAPTURE’ to develop an energy neutral wastewater treatment plant.
As an intern, I was involved in the project CAPTURE from its beginning. The primary task was to put in place a pilot scale experimental set-up to understand one of the two processes identified of having the potential to recover organic carbon.
The report is divided into 4 parts. The research institute, the department and its divisions are detailed in ‘Presentation of the company’. The context, challenge and innovative aspects are explained under ‘Presentation of the Project’. This is followed by detailed description of the tasks performed in ‘Work Undertaken’. The final section of the report where the outcomes are discussed is ‘Results and Discussion’.
2. P
RESENTATION OF THE COMPANY 2.1. THE GROUPIrstea (National Research Institute of Science and Technology for Environment and Agriculture) is a French public and technical institute in joint supervision under two ministries – the Ministry of Research and the Ministry of Agriculture. This institute was created in 1981 under the name of CEMAGREF (National Centre of Agricultural Mechanization, Agricultural Engineering, Water and Forests) and has now 14 research units spread around nine centres in France. It is thematically organized around three research departments: waters, ecotechnologies and territories.
Irstea comprises of about 1550 staff, of which 1100 are engineers and researchers, doctoral students and post-doctoral students. In 2015, the annual budget of Irstea was €109.5 million.
Figure 1 : Location of the Irstea Centres
The main goal of Irstea is to expand the research in the fields of water, ecosystems, territories and biodiversity in partnership with public institutions (AFB, water agencies, Ministry of Ecology and sustainable development and local authorities), private actors (ERDF, Compagnie Nationale du Rhône, Suez Environnement, Véolia, Saur, etc.,) and universities. The objectives are to valorize and disseminate scientific results and offer practical and sustainable solutions to environmental problems.
2.2. LYON-VILLEURBANNE CENTRE
The Lyon-Villeurbanne center is composed of two research units:
RiverLy: This department is specialized in water resources, flood risks prevention,
maintenance and management of river-beds and impacts of climate change on the
quality and quantity of water resources using tools to model rain and hydrological
processes.
REVERSAAL (Reduce reuse recycle resources from wastewater): This department
studies the treatment processes of domestic waste water in order to improve the quality
of water bodies, reuse resources and valorization technologies.
Both the research units are supported by administration department and a lab department. The Regional Director of Irstea Lyon-Villeurbanne is Mr. Pascal BOISTARD. He oversees the research departments as well as the general services, as shown in the organigram, in 6.1.
2.3. REVERSAALDEPARTMENT
Department of REVERSAAL conducts applied research on existing purification processes in order to improve performances and designs of the infrastructures. The aim is to
provide to engineers, constructors, operators and contractors the information they need to improve wastewater treatment. It is further organised into three themes of research:
Reduce: Reduce the impact of treated discharge, led by Jean-Marc Choubert, who is also the head of the department.
Reuse: Studies of reusing treated wastewater for non-potable applications, led by Pascal Molle.
Recover: Projects of recovering resources such as heat, energy and nutrients during waste water treatment, led by Florent Chazarenc.
The project for which I have undertaken my PM3E Master Thesis internship is within this department under the theme ‘Recover’. The project, titled ‘Capture’ is detailed in Section 3.3.
3. P
RESENTATION OF THE PROJECT 3.1. CONTEXTDomestic wastewater treatment in Europe is now an extremely mature industry and has its primary objective to safeguard public health. Wastewater Treatment Plants (WWTPs) are designed to meet this objective by reducing harmful pollutants (Ref: Section 4.1.1) to receiving water bodies.
However, the most widely used technology – Activated Sludge – consumes substantial amounts of electrical energy (Jimenez, et al., 2015). It is estimated that about 3% of the annual electrical energy was used for wastewater treatment in USA (Gu, Xu, & Liu, 2017). Some promising technological advancements have been successfully demonstrated to meet objectives of wastewater treatment, all the while consuming drastically lesser energy than their peers, or, in some cases, even energy positive (Meerburg, et al., 2015).
Additionally, some valuable elements such as phosphorous is present in substantial quantities in wastewater. Phosphorous is an important component of our fertilizers, currently mined from ever dwindling mines. There is a drive to upgrade existing WWTPs to energy and nutrient recovery plants, and rechristening them to Wastewater Resource Recovery Platforms (WWRPs)
3.2. FROM WWTPS TO WRRPS
A variety of resources can be recovered from wastewater, the most obvious one being water itself. Treated water, depending on its quality, can be used for a wide variety of non-potable uses – such as watering golf courses, irrigating crops producing food destined for animals or producing bio-fuel, and finally specific industries. However, such uses are heavily regulated that considers public health risks and public acceptance.
The second main resource with good potential for recovery is energy – heat (in cold climate regions) and chemical energy. As wastewater is entering is around 15 °C, it can be used to run heat exchangers and/or heat pumps used for public swimming pools, for instance, or even district heating. Organic matter is generally biologically oxidized into carbon dioxide expending electrical energy. New processes are being developed to produce more biogas
either from sludge or directly from raw wastewater, which represents a new source of energy from which is conventionally considered as waste.
Finally, nutrients such as nitrogen and phosphorous (considered as pollutants in waterbodies, but essential for plant growth) can be recovered and applied on farms as a replacement from synthetic fertilizers.
These technologies that enable recovery of water, energy and nutrients represent a paradigm shift in the design and functioning of Waste Water Treatment Plants (WWTPs). It justifies WWTPs to renamed as Wastewater Resource Recovery Platforms (WRRPs), to represent better their function.
Figure 2 Waste Resource Recovery Platforms - an illustration [Ref: State of the Art Compendium Report on Resource Recovery from Water (IWA Publishing)]
3.3. PROJECT CAPTURE 3.3.1 INTRODUCTION
Energy is one of the main resources present in wastewater that can be harvested in the form of biogas production. Current WWTPs do produce biogas, but remain net energy consumers. The potential energy recoverable is discussed in Section 4.1.3.
Project CAPTURE was launched with an objective to develop an energy neutral WWTP by multiple players who are presented in Section 3.3.2. St.Fons, Lyon is the chosen WWTP for the full scale demonstration of WRRP.
3.3.2 MAIN STAKE HOLDERS
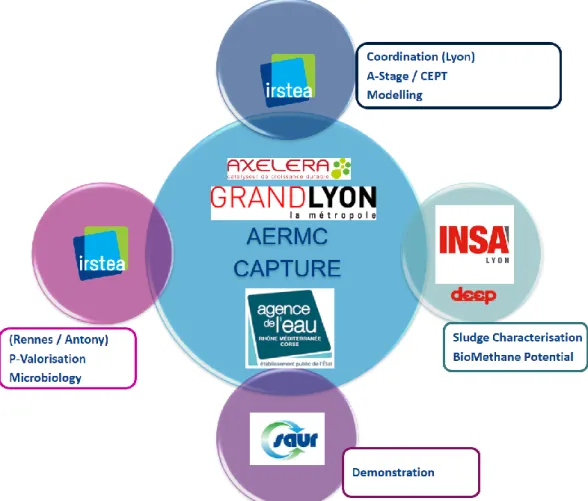
With the aim of developing the next generation wastewater treatment plant that can recover some of the resources present in it, notably energy, five different organisations have come together and launched a project titled ‘CAPTURE’. The five main stakeholders of this project are presented in Figure 3, and described below :
Irstea Lyon-Villeurbanne: The project’s home and coordinating centre. Also to perform pilot scale tests on CEPT and HRAS at its research platform ‘Feyssine’.
INSA Lyon: Academic partner and specializes in characterisation of sludge and its BMP measurements.
SAUR: Industrial partner, the utility which is the current operator of Lyon’s largest WWTP in Saint Fons.
GrandLyon & AERMC: The city office of Lyon (GrandLyon), and the regional water body AMERC (Agence de l’eau Rhone Mediterranee Corse) are the regulatory supporters.
Irstea Rennes/Antony: Specialists from other centres to look at the microbiology of HRAS and study valorisation of phosphorous in the context of this project.
Figure 3 Stakeholders of Project CAPTURE
3.3.3 PROJECT PLANNING
The project manager of CAPTURE is Florent CHAZARENC, Research Director at Irstea Lyon-Villeurbanne centre. The project began on March 1st 2018, and the project kick-off
meeting was held on 2nd May. The total duration of the project is 4 years.
The final objective of the project is to upgrade the existing WWTP at St.Fons (1 million PE), Lyon to an energy neutral facility. The studies performed at Irstea have as the final objective to aid the upgrade the St.Fons WWTP to a WRRP.
3.4. SCOPE OF THE INTERNSHIP
The scope of the internship is to extend the understanding of COD capture through biological methods (detailed in Section 4.1.7) by performing experiments in pilot scale. The experimental hall is situated adjacent to Feyssine WWTP, with access to real raw wastewater continuously.
4. W
ORKU
NDERTAKEN 4.1. BIBLIOGRAPHY4.1.1 WASTEWATER CHARACTERISTICS IN FRANCE
Concentration of pollutants present in domestic wastewater vary geographically by country, or even by region. They also vary seasonally and diurnally. Table 1 presents wastewater influent characteristics based on a survey conducted on municipal wastewater (a mixture of domestic and industrial wastewater and water from diffuse sources).
Table 1 Wastewater Characteristics in France [Ref: M.N. Pons, EWA 2004]
COD BOD5 SS N P (mg/L) Mean 634 268 302 52 9.3 Median 592 245 267 51 9 Standard deviation 315 137 170 23 3.8 4.1.2 CODFRACTIONATION
Chemical Oxygen Demand (COD) is a bulk parameter that represents the organic pollutants in wastewater. Understanding the composition of this parameter for understanding treatment mechanisms. It can be classified into four major components based on bio-degradability and solubility – soluble or particulate (insoluble).
Soluble non-biodegradable COD, or Soluble Inert COD;
Particulate non-biodegradable COD;
Soluble biodegradable COD, or Readily Biodegradable COD;
Particulate biodegradable COD, or Slowly biodegradable COD.
Both the properties of biodegradability and solubility can be combined and visualized in Figure 4. The soluble biodegradable fraction (SS) is sometimes referred to as “Readily Biodegradable” fraction and particulate biodegradable (XS) fraction as “Slowly Biodegradable” fraction.
Figure 4 COD Fractionation
The difference between soluble and particulate matter is the size of the particles, or molecules. In reality the particle size in wastewater is a continuum and no universal definition exists to separate soluble and particulate matter. Usually particles smaller than 0.45 µm are considered soluble and larger than 1.2 µm are considered particles. Occupying the space in-between the two is a colloidal fraction. This colloidal COD fraction poses a particular challenge to carbon capture by both chemical and biological methods.
4.1.3 THE WATER-ENERGY NEXUS
Wastewater can be treated to a sanitized, low impact waste for <0.6 kW kL-1 (N < 5
mg-N L-1, P < 1 mg-P L-1) (Foley, Haas, Hartley, & Lant, 2010). Most common treatment technology
in use is Conventional Activated Sludge (CAS) (Meerburg, et al., 2016), has been in use for more than 100 years. However, this technology consumes substantial amount of electrical energy and – approximately 50% of it for aeration.
However, energy is present in domestic wastewater in the form of organics far exceeds the energy required to treat it, as illustrated in Figure 5. Hence an energy neutral treatment plant is theoretically possible.
Figure 5 Domestic Wastewater’s energy content
4.1.4 PRINCIPLE OF CARBON CAPTURE AND VALORISATION IN WRRP
The principle of carbon capture followed by valorisation in an anaerobic digester represents a pillar of the WRRP. In the digester, biomethane will be produced which can be used to run a Combined Heat and Power (CHP) plant or can be injected in the natural gas grid after treatment. The electricity and heat generated can be used to drive the various processes in the treatment facility.
Based on the energy balance presented in Section 4.1.3, there is enough chemical energy present in wastewater than energy required to treat it. Therefore, the main task of the project CAPTURE is to study the different processes to capture organic matter at the head of the WWTP. These processes are to be studied at full scale.
At least three processes exist for capturing carbon in domestic wastewater and redirect it to anaerobic digestion, they are:
Chemically Enhanced Primary Treatment (CEPT)
High Rate Activated Sludge (HRAS)
Microscreening
BioMethane Potential (BMP) of the sludge produced by the processes under study is an important parameter as all organic matter does not have the same anaerobic biodegradability. Research on anaerobic digestion and CHP are not part of the project. Finally, their impact on downstream processes, as the overriding objective is to treat the wastewater to meet effluent guidelines.
4.1.5 PRINCIPLE OF ACTIVATED SLUDGE
The activated sludge process uses microorganisms to feed on organic contaminants in wastewater. These aerobic microorganisms grow when supplied with oxygen, and form particles that can settle to the bottom of the tank, leaving a relatively clear liquid free of organic material and suspended solids.
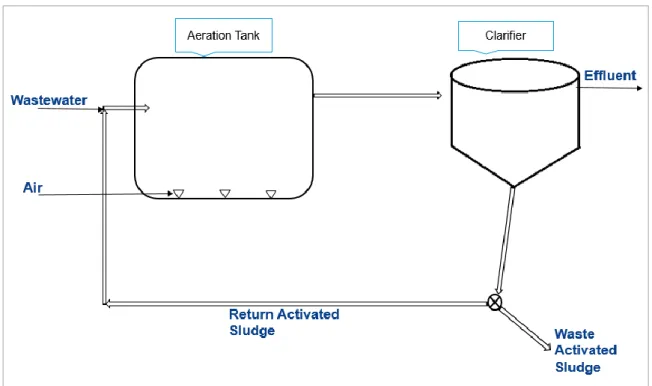
Figure 6 shows a schematic of a Conventional Activated Sludge (CAS) process with an aeration tank followed by a clarifier. In this continuous fed reactor, the wastewater enters from the left, passes through the reactor (also called aeration tank). In this reactor, aerobic bacteria either assimilate the organic pollutants or consume them as food.
It is followed by a clarifier where solids (flocs) are allowed to settle by gravity. The sediment contains mainly settled solids (called sludge) is recycled into the reactor, and the rest ‘wasted’ for further treatment. The supernatant is treated water, called effluent, leaves the clarifier for further treatment, or into a receiving water body.
Figure 6 Schematic Representation of Activated Sludge Process
The important component of activated sludge process is the return of the sludge, i.e., the aerobic microorganisms to the aeration tank, increasing their retention time in the aeration tank. Up to 50% of energy required to run a plant with this technology is spent on aeration (Kinyua, et al., 2017).
Three important parameters that describe the activated sludge process are:
Hydraulic Detention Time (HDT) – the average amount of time wastewater spends in the reactor;
Sludge age – the average detention time of solids in the reactor;
Table 2 Parameters of Activated Sludge Sysytem
HDT Sludge age F/M ratio
(hours) (days) kgBOD5/kg VSS.d
High-Rate 2 – 4 < 1 > 1.0
Conventional 8 – 12 2 – 5 0.8 – 1.0
Extended Aeration 15 – 20 > 15 0.6 – 0.8
4.1.6 PRINCIPLE OF A-B PROCESS
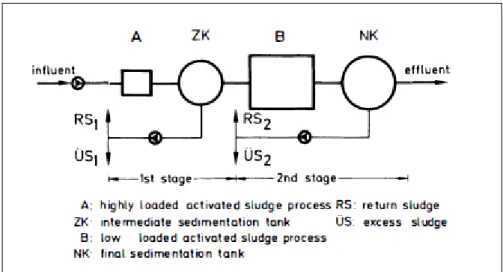
A-B Process is variation on CAS, which constitutes two activated sludge plants in series. The first stage is a high rate activated sludge (HRAS), with sludge loads in the range of 3 – 6 kg BOD/kg MLSS.day. The second stage, B-stage is a low loaded activated sludge plant with sludge loads in the range of 0.15 – 0.30 kg BOD/kg MLSS.day. A general flow sheet of A-B process is shown in Figure 7.
Figure 7 General flow sheet A-B process (Versprille 1984)
The COD removal taking place in an activated sludge plant is characterized by a fast removal of a relatively big part (up to 70 % of influent BOD removal in 30 minutes (Versprille 1984)) of the organics from wastewater within the first few minutes. This phenomenon is the basis for the development of the A-B process.
4.1.7 RESEARCH ON HRAS AS A-STAGE
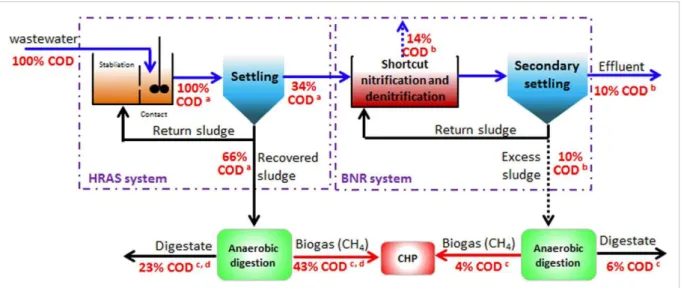
Figure 8 shows the COD mass balance of using HRAS based on a meta study (Wan et al., 2016). According to this study, up to 43% of COD present in wastewater can be recovered as biogas. The final objective of the Project Capture is to attain similar carbon redirections.
Figure 8 COD flow in A-B process with HRAS as A-Stage (Wan et al., 2016)
A bibliographic review on the current research on the topic of carbon capture towards an energy neutral wastewater treatment is presented in Table 3. It shows that research articles exist over the whole range of reactor sizes possible, different F/M ratios and % COD capture achieved.
Source Scale COD to Primary Sludge
F/M Ratio
gBOD/kgTSS.d Summary
Meerburg
et al., 2015 0,002 m3 40 % 3,6 – 4,6
Sludge age and F/M ratio to be optimized ; energy recovery 15% gCODCH4/gCODinf
Jimenez et
al., 2015 0,260 m
3 50 – 80 % 1,95 – 1,97 EPS plays an important to capture
particulate and colloidal COD.
Wett et al.,
2007 2 500 m3 55 - 65 % -
Article on an energy positive
WWTP in Strauss, Austria
(implements A/B + on-line
ammonia measurement) De Graff et al., 2016 2 760 – 3 500 m3 24 - 48 % 2,2 - 3,5 Optimisation of A-Stage in Netherlands; Case study of 4 large WWTPs
4.2. METHODOLOGY
4.2.1 INTERNSHIP OBJECTIVES
The main objective of the internship was to deepen the understanding of high-rate activated sludge process by performing experiments with raw wastewater in a pilot scale reactor. The following parameters are to be well understood by means of performing experiments under real conditions using raw wastewater:
Aeration capacity required
Settling characteristics of the produced sludge
Performance of the reactor
F/M ratio that can be attained.
The above parameters are vital in designing the full-scale energy neutral plant and best understood by running pilot-scale experiments. The aeration capacity required is vital for the reactor design and the settling characteristics of the produced sludge is vital for the design of a settler.
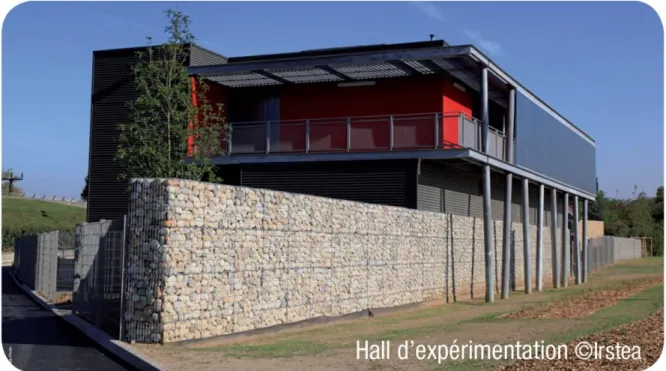
4.2.2 FEYSSINERESEARCH PLATFORM
The Feyssine research platform is located adjacent to the wastewater treatment plant Feyssine (Lyon), show in Figure 9. This WWTP is owned by the city of Lyon, and operated by the utility SUEZ Environnement. The research platform has direct, pumped access to wastewater at various stages of its treatment such as – raw wastewater, pre-treated wastewater, return activated sludge, and finally the effluent of the WWTP. The state-of-the-art research platform has the following equipment:
Semi-industrial (3m3) reactors to study activated sludge process, its variants;
Pilot scale treatment / constructed wetlands
Membrane treatment blocks
The semi-industrial reactor has been picked to study HRAS process. Continuous flow experiments are planned – i.e., the pilot reactor is to be operated as a CSTR (Continuous Stirred Tank Reactor).
Figure 9 Feyssine Research Platform
4.2.3 PROJECT PLANNING
The Internship kicked-off with performing a literature review on high-rate activated sludge process, and also on general challenges of the wastewater treatment industry. The following plan was drawn-up to meet the 6-month internship’s objectives.
The plan for the internship period, presented as a Gantt Chart at the start of the internship is shown in Figure 10.
Figure 10 Gantt chart for the internship period
The 6-month internship started off with familiarizing with various concepts and technologies in wastewater treatment – i.e., bibliographic review, with a focus on HRAS systems used for carbon capture. It was followed by measurements to quantify the aeration capacity of the biological reactor.
Once the volumetric mass transfer coefficient has been calculated, experiments of A-Stage process with raw wastewater were started. Parallel to this central activity was the analysis of performance of the reactor, and the settling characteristics of the mixed-liqueur. The final task is dedicated to drafting the report and documenting the work undertaken.
4.2.4 PROJECT SUPPORT TEAM AND COMMUNICATION
Experiments with raw wastewater were conducted in the experimental hall inside FYESSINE. Two technicians of Irstea work full-time in that facility, who built the experimental set-up – one taking care of the hydraulic connections, and the other the electrical/automation aspects. All required hydraulic and electrical tasks had to be broken down to a series of activities and regularly followed upon, verbally.
Irstea being a French organisation, all communications – written and verbal – take place in French language. Monthly meetings were held at the department level. Project progress meetings were held once a week and occasional meetings were held with other subject matter experts in Irstea, and with managers from the project’s industrial partner – Saur.
4.2.5 REACTOR
The dimensions of the reactor (a cuboid) available for use at the research platform are presented in Table 4, and a schematic with associated equipment is shown in Figure 11. It is located in the experimental hall of FEYSSINE research platform (see Section 4.2.2).
Table 4 Dimensions of the reactor.
Dimensions
Length 172 (cm)
Width 100 (cm)
Depth 167 (cm)
Volume 2.9 m3
Figure 11 The 3m3 Bio-Reactor
This reactor and its clarifier were originally conceived for testing extended aeration systems, working as a continuous fed reactor. For the current project, this set-up has to be adapted to run a high-rate system. For the reactor it entails replacing the pumps, the aeration system and the associated command and control systems.
However, the clarifier associated to the reactor is an order of magnitude smaller to be working with a HRAS process. A new clarifier is needed, however the lead-times associated
to procuring such as equipment exceed 6 months. Hence, a decision was made to use the reactor in a Sequencing Batch Reactor (SBR) mode, detailed in the Section 4.2.6.
4.2.6 SBR(SEQUENCING BATCH REACTOR)
A sequencing batch reactor is operated in an intermittent (or batch) manner, as opposed to a continuous operation. The same tank acts both as a biological reactor and as a sedimentation tank. The four phases of SBR are as shown in Table 5.
Table 5 Four main phases of an SBR cycle and their duration.
Stage Time (min)
Fill (& React)* (Alimentation) 27
React (Aération) 3
Settle (Décantation) 90
Draw (Vidange) 14
Total 137 (2h 17min)
* The fill cycle stops when a set water level is attained in the tank (approx. 27 min) During the fill-phase, the waste water pump runs at its maximum flow rate of 3.7 m3/hr.
Two air compressors also run operate, generating air flow rate around 250 NL/minute. These compressors run for an additional three minutes after the pump stops so that approx. 30 minutes of aeration is achieved, which constitutes the React phase. During the Settle phase, the tank is at rest and there is no fluid flow.
The Draw phase is started by the opening of a solenoid valve, and the supernatant discharges via gravity flow by means of a floating device without disturbing the settled sludge. A schematic representation of this experimental set-up is presented in Figure 12.
Figure 13 Representation of the 4 phases of SBR
The reactor was started by filling the tank with activated sludge to 1/6th of its volume,
followed by raw wastewater. The activated sludge acts as inoculation with necessary bacterial mass. The automatic control system was setup to switch from one phase of SBR to another. All measurements were performed after 4 continuous days of functioning of the reactor, with 200 L of mixed-liqueur wasted per day. The COD removal efficiencies are presented in Section 4.3.2.
4.2.7 VOLUMETRIC MASS TRANSFER COEFFICIENT (KLA)
The bacteria used in activated sludge process are aerobic, i.e., they thrive in the presence of oxygen dissolved in water. As the aerobic bacteria consume the substrate, the dissolved oxygen levels drop, which needs to be maintained at a desired level to keep the aerobic bacteria alive.
Dissolved oxygen levels are maintained via a system of air compressors and diffusers to send atmospheric air bubbles through the reactor volume. As the air bubbles ascend towards the surface, gas-liquid mass transfer between the bubble surface and the liquid in the reactor (interface diffusion) takes place. Figure 14 Shows one of the two diffusers that are installed in the reactor.
Figure 14 Diffuser used in the reactor`
Activated Sludge reactor efficiencies are strongly linked to the reactor’s ability to maintain dissolved oxygen levels. This ability is measured by Volumetric mass transfer coefficient (KLa) is an important physical property of an aerated reactor. It quantifies the
effectiveness of the aeration system of the reactor. It is measured in fresh water and expressed at standard conditions of temperature and pressure. The procedure is detailed in Appendix 6.2, and summary results presented in Section 4.3.1
4.2.8 COLUMN SETTLING CHARACTERISTICS
As invoked in Section 4.2.5, a new clarifier must be procured so that the reactor can work as a continuous fed reactor (CSTR). With the reactor working as an SBR, settling characteristics of the produced sludge were measured by performing column tests. This data is ultimately used for designing the required clarifier.
A column of 15cm diameter and > 2m in height was constructed for this project. The interface (sludge blanket layer) height in the column is noted at one-minute intervals for 90 minutes. The experiments were repeated on three consecutive days and the mixed-liqueur’s
corresponding solids concentration is measured. Results of these experiments are presented in Section 4.3.3
4.3. RESULTS OF WORKS UNDERTAKEN 4.3.1 KLA OF THE REACTOR
KLa in freshwater and at 20 C was found to be 7.9 gO2 h-1 at air flowrate of 290 NL/min.
The measurement methodology and results are presented in Annex 6.2.
4.3.2 SBRPERFORMANCE
The reactor performance is the COD removal efficiency over a period of 24h. As the reactor was fed intermittently with raw wastewater, and as its characteristics change significantly over the day, composite samples were taken over a day. Two automatic samplers were programmed to take a samples of
Influent, at the middle of the Fill-phase
Effluent, at the middle of the Draw-phase.
COD was measured using WTW Cell tests and the results obtained are presented in Table 6. As it can be seen, the removal efficiency is not as high as expected from bibliographic review. It is noted that the influent has almost 50% more COD than during non-summer months of operation. Table 6 SBR Performance* COD [mg.L-1] Influent 778 Effluent 494 Removal Efficiency 37 %
*Performance measured at F/M ratio of 0.3 gBOD5/gVSS.day
A possible reason for low removal efficiency observed is that there is not enough oxygen supply available for the sludge to capture or oxidise the readily bio-degradable fraction of the COD. This hypothesis is supported by low dissolved oxygen (DO) levels observed during react-phase (~ 0.8 mg O2.L-1).
4.3.3 SETTLING CHARACTERISTICS
The experimental set-up, along with the evolution of the solid-liquid interface is shown in Figure 15. The settling plots are presented in Figure 16 and the corresponding solids concentration of the three series are presented in Table 7.
Figure 16 Interface Settling Curves
Table 7 Solids Concentration of Settling Experiments
TSS [g.L-1]
Series 1 2.6
Series 2 2.9
Series 3 3.1
The settling occurs in two distinct phases – hindered settling and compression settling, with a transition phase in-between the two. It can be seen from Figure 16 that the duration of hindered settling is around 30 minutes. It is observed that with increasing concentration of solids, the settling speed decreases. This is because as there are more solids, there is more hindrance to the settling.
4.4. FUTURE WORKS
4.4.1 SBR TO CSTR(CONTINUOUS STIR-TANK REACTOR)
As the St. Fons’ WWTP design is that of a continuous flow reactor, experiments shall be performed with a continuous fed reactor to be as close real conditions as possible. The envisioned experimental set-up is shown in Figure 17.
Figure 17 Schematic of Experimental setup with Lamellar Settler
4.4.2 LAMELLAR SETTLER SIZING
A Lamellar settler is a solid-liquid separator that occupies much lesser surface area and space than a classical clarifier. It works by reducing the velocity and turbulence of the wastewater stream.
4.4.3 MODELLING
Mathematical modelling is a powerful technique to predict the outcomes of processes when some parameters are changed. Wastewater treatment process modelling allows prediction of full scale models based on results from pilot-scale experiments. Simba, developed by inCTRL solutions, is a powerful research oriented wastewater treatment modelling software which shall be used to model HRAS.
4.5. GENERAL CONCLUSIONS
The PM3E Master Program covers a wide variety of topics, and it especially helped me appreciate the links between the energy and environment. Most of the developing world needs wastewater treatment plants but that means increased energy use if we do not change the legacy technologies,
Courses ranging from biological wastewater treatment to bio gas helped me in understanding the context of my internship project. French language and culture courses helped me be more at ease in a working environment that is predominantly French.
5. R
EFERENCESFoley, J., Haas, D., Hartley, K., & Lant, P. (2010). Comprehensive life cycle inventories of alternative wastewater treatment systems. Water Research, 44, 1654-1666. doi:https://doi.org/10.1016/j.watres.2009.11.031
Ge, H., Batstone, D. J., Mouiche, M., Hu, S., & Keller, J. (2017). Nutrient removal and energy recovery from high-rate activated sludge processes – Impact of sludge age. Bioresource
Technology, 245, 1155-1161. doi:https://doi.org/10.1016/j.biortech.2017.08.115
Graaff, M. S., Brand, T. P., Roest, K., Zandvoort, M. H., Duin, O., & Loosdrecht, M. C. (2016). Full-Scale Highly-Loaded Wastewater Treatment Processes (A-Stage) to Increase Energy Production from Wastewater: Performance and Design Guidelines.
ENVIRONMENTAL ENGINEERING SCIENCE, 33, 571-577. doi:10.1089/ees.2016.0022
Jimenez, J., Miller, M., Bott, C., Murthy, S., Clippeleir, H. D., & Wett, B. (2015). High-rate activated sludge system for carbon management – Evaluation of crucial process
mechanisms and design parameters. Water Research, 87, 476-482.
doi:https://doi.org/10.1016/j.watres.2015.07.032
Meerburg, F. A., Boon, N., Van Winckel, T., Pauwels, K. T., & Vlaeminck, S. E. (2016). Live Fast, Die Young: Optimizing Retention Times in High-Rate Contact Stabilization for Maximal Recovery of Organics from Wastewater. ENVIRONMENTAL SCIENCE &
TECHNOLOGY, 50, 9781-9790. doi:10.1021/acs.est.6b01888
Meerburg, F. A., Boon, N., Winckel, T. V., Vercamer, J. A., Nopens, I., & Vlaeminck, S. E. (2015). Toward energy-neutral wastewater treatment: A high-rate contact stabilization process to maximally recover sewage organics. Bioresource Technology, 179, 373-381. doi:https://doi.org/10.1016/j.biortech.2014.12.018
Meerburg, F. A., Vlaeminck, S. E., Roume, H., Seuntjens, D., Pieper, D. H., Jauregui, R., . . . Boon, N. (2016). High-rate activated sludge communities have a distinctly different structure compared to low-rate sludge communities, and are less sensitive towards environmental and operational variables. WATER RESEARCH, 100, 137-145. doi:10.1016/j.watres.2016.04.076
Miller, M. W., Elliott, M., DeArmond, J., Kinyua, M., Wett, B., Murthy, S., & Bott, C. B. (2017). Controlling the COD removal of an A-stage pilot study with instrumentation and automatic process control. WATER SCIENCE AND TECHNOLOGY, 75, 2669-2679. doi:10.2166/wst.2017.153
Rahman, A., Meerburg, F. A., Ravadagundhi, S., Wett, B., Jimenez, J., Bott, C., . . . Clippeleir, H. D. (2016). Bioflocculation management through high-rate contact-stabilization: A promising technology to recover organic carbon from low-strength wastewater. Water
Research, 104, 485-496. doi:https://doi.org/10.1016/j.watres.2016.08.047
Rahman, A., Yapuwa, H., Baserba, M. G., Rosso, D., Jimenez, J. A., Bott, C., . . . Clippeleir, H. D. (2017). Methods for quantification of biosorption in high-rate activated sludge
systems. Biochemical Engineering Journal, 128, 33-44.
6. A
PPENDIXES6.1. ORGANOGRAM OF IRSTEA LYON-VILLEURBANNE CENTRE
6.2. TECHNICAL NOTE #1:KLA –THEORY AND MEASUREMENT 6.2.1 PRINCIPLE VOLUMETRIC MASS TRANSFER COEFFICIENT
Gases present in the atmosphere such as nitrogen, oxygen, carbon dioxide, methane, are soluble in water. Solubility expressed as mass of dissolved gas per unit volume, generally in mg.L-1. Solubility of gases in liquids is governed by
Henri’s law,
The partial pressure of the gas in the atmosphere
The temperature
Concentration of impurities in the water (e.g., salinity, suspended solids, etc.,) The principle of activated sludge is the biological degradation of organic matter in wastewater by aerobic heterotrophic bacteria. They do so by consuming dissolved oxygen (DO).
The rate of gas transfer is proportional to difference between existing concentration and equilibrium concentration of the gas in the solution.
rm =kg A (Cs – C)
Where:
rm = rate of mass transfer
kg = coefficient of diffusion for gas
A = area through which gas diffuses
Cs = saturation concentration of gas in solution C = concentration of gas in solution
Expressing it in terms of concentration:
dc/dt = rc =kg A/V (Cs – C)
dc/dt =KLa (Cs – C)
Where:
dc/dt = rate of change of concentration of dissolved oxygen. KLa = ; a proportionality factor that groups all the physical effects
Cs and C = Saturation concentration and instantaneous concentration. 6.2.2 EXPERIMENT METHODOLOGY
Figure below presents a schematic drawings of the experimental set-up.
Figure 18 Schematic for Volumetric Mass Transfer Coefficient (KLa) Measurement Do we number figures in the Appendix?!
Step 1: Fill the reactor (3 m3) with fresh water
Step 2: Install 3 oxygen sensors in three different locations along the diagonal of the tank.
Step 3: Leave the air compressors on for the whole night to allow the DO concentration to reach saturation point. Turn them off and note the DO saturation achieved, along with temperature and atmospheric pressure. There should also be a mass flow meter that gives instantaneous air mass flowrates in Normal Conditions (0C, 1 atm).
Step 4: After the overnight aeration, the following morning note the atmospheric pressure and water temperature in the tank, and of course the DO meter readings (Cs-overnight)
Step 5: Add 3g of Cobalt Chloride (a catalyst0 and 150 g of Sodium Sulphate (Oxygen scavenger) per m3. They are added as solution for better mixing.
Step 6: Add the above two solutions in the tank and mix well. Measure and note the conductivity of the tank.
Step 7: Additionally, note the atmospheric pressure and water temperature in the tank. Step 8: when the DO concentration reaches 0 mg/L, start the air compressors, and record DO levels every 20 seconds for the first 5 minutes and every 60 seconds for the next 25 minutes.
Step 9: Repeat starting from Step 5, two more times at least. No need to add Cobalt Chloride. Note Temperature of the water, Atmospheric pressure and conductivity of the water before each run.
6.2.3 CALCULATION METHODOLOGY
The difference between saturated DO level from theoretical tables at these conditions and measured value is the effect of hydrostatic pressure – i.e., of super-saturation. It is calculated with the equation below:
∆P = (Cs-overnight / Cs-table - 1)*P
This pressure effect is used a correction to estimate Cs for each trial. This corrected for Cs is used as the saturation concentration to which the recorded data (from step 8) would stabilize to at after extended aeration. As shown in Figure 19, the DO concentration increases logarithmically.
C(t) = Cs – (Cs – C0)*exp(-kLa*t)
Rearranging;
Figure 19 Sample DO concentration evolution
From the recorded DO concentrations, values between 20% and 80% of corrected Cs are plotted as Ln(Cs – C(t)) vs time. A sample graph is presented in the Figure 20. Slope of the linear regression line of Figure 20 is -kLa, with units [minute-1].
Figure 20 Sample treated DO concentration data
The obtained kLa value is corrected to standard temperature of 20 °C, using the following
equation Where,
θ
is taken as 1.024. (Typically 1.015 – 1.040). kLa(T) = kLa20°C * θ(T-20)Table 8 Summary of KLa Results
![Figure 2 Waste Resource Recovery Platforms - an illustration [Ref: State of the Art Compendium Report on Resource Recovery from Water (IWA Publishing)]](https://thumb-eu.123doks.com/thumbv2/123doknet/15041535.691805/9.892.149.834.392.914/resource-recovery-platforms-illustration-compendium-resource-recovery-publishing.webp)
![Table 1 Wastewater Characteristics in France [Ref: M.N. Pons, EWA 2004]](https://thumb-eu.123doks.com/thumbv2/123doknet/15041535.691805/12.892.104.799.402.525/table-wastewater-characteristics-france-ref-m-pons-ewa.webp)