HAL Id: hal-03088561
https://hal.archives-ouvertes.fr/hal-03088561
Submitted on 26 Dec 2020HAL is a multi-disciplinary open access archive for the deposit and dissemination of sci-entific research documents, whether they are pub-lished or not. The documents may come from teaching and research institutions in France or abroad, or from public or private research centers.
L’archive ouverte pluridisciplinaire HAL, est destinée au dépôt et à la diffusion de documents scientifiques de niveau recherche, publiés ou non, émanant des établissements d’enseignement et de recherche français ou étrangers, des laboratoires publics ou privés.
Mantle and Crustal Sources of Magmatic Activity of
Klyuchevskoy and Surrounding Volcanoes in Kamchatka
Inferred From Earthquake Tomography
Ivan Koulakov, Nikola Shapiro, Christoph Sens-schönfelder, Birger Luehr,
Evgeny Gordeev, Andrey Jakovlev, Ilyas Abkadyrov, Danila Chebrov, Natalia
Bushenkova, Svetlana Droznina, et al.
To cite this version:
Ivan Koulakov, Nikola Shapiro, Christoph Sens-schönfelder, Birger Luehr, Evgeny Gordeev, et al.. Mantle and Crustal Sources of Magmatic Activity of Klyuchevskoy and Surrounding Volcanoes in Kamchatka Inferred From Earthquake Tomography. Journal of Geophysical Research : Solid Earth, American Geophysical Union, 2020, 125 (10), �10.1029/2020JB020097�. �hal-03088561�
This article has been accepted for publication and undergone full peer review but has not been through the copyediting, typesetting, pagination and proofreading process which may lead to Koulakov Ivan (Orcid ID: 0000-0002-0327-4416)
Shapiro Nikolai, M. (Orcid ID: 0000-0002-0144-723X)
Sens-Schönfelder Christoph (Orcid ID: 0000-0002-0150-9365) Gordeev Evgeny (Orcid ID: 0000-0002-4849-5052)
Jakovlev Andrey (Orcid ID: 0000-0002-4850-8239) Bushenkova Natalia (Orcid ID: 0000-0002-8792-9060) Droznina Svetlana, Ya. (Orcid ID: 0000-0003-2358-5999) Senyukov Sergey, L. (Orcid ID: 0000-0002-7378-9095)
Mantle and crustal sources of magmatic activity of
Klyuchevskoy and surrounding volcanoes in
Kamchatka inferred from earthquake tomography
by
Ivan Koulakov1,2,3*, Nikolay M. Shapiro4,5, Christoph Sens-Schönfelder6, Birger G. Luehr6, Evgeny I. Gordeev3, Andrey Jakovlev1,2, Ilyas Abkadyrov3, Danila V. Chebrov7, Natalia Bushenkova1, Svetlana Ya. Droznina7, Sergey L. Senyukov7, Angelika Novgorodova1, and
Tatyana Stupina1
* Corresponding author: email: KoulakovIY@ipgg.sbras.ru
1. Trofimuk Institute of Petroleum Geology and Geophysics SB RAS, Prospekt Koptyuga, 3, 630090, Novosibirsk, Russia (KoulakovIY@ipgg.sbras.ru ; JakovlevAV@ipgg.sbras.ru ; BushenkovaNA@ipgg.sbras.ru ; StupinaTA@ipgg.sbras.ru; NovgorodovaAM@ipgg.sbras.ru ).
2. Novosibirsk State University, Novosibirsk, Russia, Pirogova 2, 630090, Novosibirsk, Russia
3. Institute of Volcanology and Seismology FEB RAS, Piip Boulevard, 9, 693006, Petropavlovsk-Kamchatsky, Russia (gordeev@kscnet.ru; aifgf@mail.ru).
4. Institut des Sciences de la Terre (ISTERRE), UMR CNRS 5375, Université Grenoble-Alpes, Grenoble, France (nikolai.shapiro@univ-grenoble-alpes.fr ).
6. GFZ German Research Centre for Geosciences, Telegrafenberg, 14473, Potsdam, Germany (sens-schoenfelder@gfz-potsdam.de, ase@gfz-potsdam.de).
7. Kamchatkan Branch of Geophysical Survey RAS Piip Boulevard, 9, 693006, Petropavlovsk-Kamchatsky, Russia (danila@emsd.ru; dsv@emsd.ru; ssl@emsd.ru). Citation: Koulakov I., N. Shapiro, C. Sens-Shoenefelder, B.G. Luehr, E.I. Gordeev, A.V. Jakovlev, I. Abkadyrov, D.V. Chebrov, N. Bushenkova, S.Ya. Droznina, S. Senyukov, A. Novgorodova, and T. Stupina (2020), Mantle and crustal sources of magmatic activity of Klyuchevskoy and surrounding volcanoes in Kamchatka inferred from earthquake tomography, J. Geophys. Res., Solid Earth (submitted)
Revision at Journal of Geophysical Research (2020JB020097R) August 2020
Abstract
Klyuchevskoy and surrounding volcanoes in central Kamchatka form the Northern Group of Volcanoes (NGV), which is an area of particularly diverse and intensive
Pleistocene-Holocene volcanism. In this study, we present a new seismic tomographic model of the crust and uppermost mantle beneath NGV based on local earthquake data recorded by several permanent and temporary seismic networks including a large-scale experiment that was conducted in 2015-2016 by an international scientific consortium. Having an unprecedented resolution for this part of Kamchatka, the new model reveals many features associated with the present and past volcanic activity within the NGV. In the upper crust, we found several prominent high-velocity anomalies interpreted as traces of large basaltic shield volcanoes, which were hidden by more recent volcanic structures and sediments. We interpret the mantle structure to reflect asthenospheric flow up through a slab window below the Kamchatka-Aleutian junction that feeds the entire NGV. The interaction of the hot asthenospheric material with fluids released from the slab determines the particular volcanic activity within the NVG. We argue that the eastern branch of the Central Kamchatka Depression, which is associated with a prominent low-velocity anomaly in the uppermost mantle, was formed as a recent rift zone separating the NGV from the Kamchatka Eastern Ranges.
Key words: Seismic tomography, crust, mantle, subduction, volcanism, Klyuchevskoy Group of Volcanoes, Shiveluch, Kizimen, Central Kamchatka Depression
Key points (140 characters):
We present a new high-resolution seismic model of the crust and upper mantle beneath the Northern Group of Volcanoes in Kamchatka
The volcanoes of the Northern group are fed by an asthenosphere flow ascending from a slab window below the Kamchatka-Aleutian junction
Eastern branch of the Central Kamchatkan Depression is a rift separating the Northern Group of Volcanoes from the Eastern Ranges
1. Introduction
Klyuchevskoy and surrounding volcanoes in central Kamchatka form the Northern Group of Volcanoes (NGV), which is an area with exceptionally active and diverse manifestations of Pleistocene-Holocene volcanism (Figure 1b). The central part of the NGV includes a cluster of 13 densely located active and dormant volcanoes called the Klyuchevskoy Volcanic Group (KVG). Three volcanoes of the KVG, Klyuchevskoy, Bezymyanny and Tolbachik have completely different eruption regimes and compositions, and are all considered among the most active volcanoes in the world (e.g., Laverov, 2005; Ponomareva et al., 2007; Fedotov et al., 2010). Some of the KVG volcanoes episodically manifest seismic and/or fumarolic activity, others are considered as dormant or extinct, but all of them may potentially represent serious volcanic hazard. KVG volcanoes are also known for their very intense and diverse seismic activity (e.g., Senyukov 2013; Senyukov et al., 2015) that includes long episodes of tremors (e.g., Droznin et al., 2015; Gómez-García et al., 2018; Soubestre et al., 2018, 2019) and many swarms of long-period earthquakes (Shapiro et al., 2017a; Frank et al., 2018). Besides KVG, in this study, we consider two other active volcanoes: Shiveluch to the north and Kizimen to the south, as well as a number of extinct volcanic structures, such as
Zarechny and Kharchinsky volcanoes to the north, Nikolka to the south, as well as Shish and Tumrok volcanoes to the east. More details about characteristics of these volcanoes will be given in the next section.
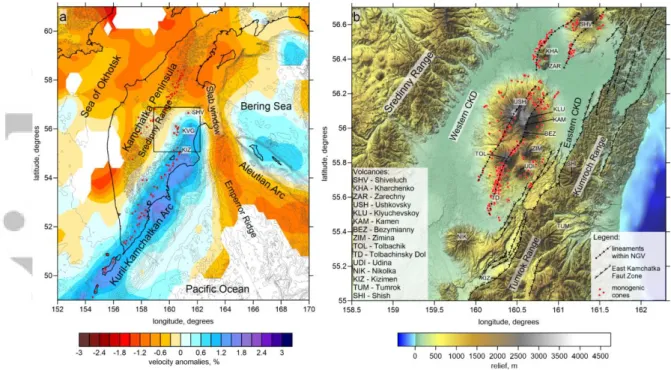
The feeding systems of volcanic arcs in subduction zones usually involve multilevel magma sources located at different depths in the crust and the mantle wedge (Dobretsov et al., 2012). Therefore, investigation of deep crustal and mantle structures beneath active volcanoes is an essential element for understanding the basic principles of volcano-magmatic systems. Compared to other areas of Kamchatka, the KVG is relatively well studied. A number of previous geophysical studies have provided comprehensive view to the deep structures on scales ranging from the uppermost crust (1s km) to the whole mantle (1000s km). The shape of the subducting Pacific plate has been consistently revealed from several regional seismic tomography studies using global and regional databases (Gorbatov et al., 2001; Jiang et al., 2009; Koulakov et al., 2011a). Figure 1a presents one of such models by Koulakov et al. (2011), in which the slab at 150 km depth is clearly traced as a high-velocity anomaly, which abruptly ends right below the location of the Shiveluch volcano.
The area of NGV is covered by 25 telemetered seismic stations of the permanent network operated by the Kamchatkan Branch of the Geophysical Survey (KBGS) (e.g., Chebrov et al., 2013) shown by black diamonds in Figure 2. The data of this network have been processed in real time by the staff of KBGS. For decades of continuous recording, it provided the information about hundreds of thousands of crustal and slab-associated
earthquakes and millions of P and S wave picks. This information has been used in a number of tomography studies that mostly recovered structures in the crust at the vicinity of the Klyuchevskoy volcano, where the distributions of the permanent stations is densest (e.g., Slavina et al., 2001; Khubunaya et al., 2007; Lees et al., 2007; Koulakov et al., 2011b, 2013). Continuous seismograms from the KBGS network were also used in the first seismic
ambient-noise study of the NGV region (Droznina et al., 2017).
The resolution of crustal structures beneath the southern part of KVG has been considerably enhanced after installing a temporal network consisting of 20 stations around the Tolbachik summits and along the Tolbachinsky Dol in 2013-2014. The merged data of this temporary network data with the KBGS catalogues have been used to build a high-resolution seismic tomography model of the crust beneath KVG (Koulakov et al., 2017). This has allowed for identifying three different feeding mechanisms of three major active
volcanoes of KVG: Klyuchevskoy, Bezymyanny, and Tolbachik. Some improvement of the upper crustal structures was achieved after deployment of local seismic networks on
Bezymianny (Ivanov et al., 2016) and Udina (Koulakov et al., 2019). To date, the majority of studies focused on the KVG, while tomographic investigation of Shiveluch, Kizimen, and
other volcanoes located outside KVG, were ineffective due to the limited resolution of seismic datasets collected by stations of the permanent and previously deployed temporary networks.
Structures in the mantle wedge are important to link the processes occurring in the subducting slab with the manifestations of volcanism on the surface. The data corresponding to regional and slab-related seismicity recorded by the permanent KBGS network have been used in several studies mostly oriented to studying the mantle wedge (e.g., Gorbatov et al., 1997, 1999; Nizkous et al., 2006; Koulakov et al., 2016). However, as was mentioned by Koulakov et al. (2016), these models suffered from a relatively sparse and strongly uneven distribution of seismic stations of the permanent network. This led to a trade-off between velocity structures and deep source coordinates, which might bias the resulting tomography models. In this sense, the structure of the mantle wedge beneath the NGV was one of the weakest elements in the hierarchy of multiscale tomography models of Kamchatka. To close this gap, a large-scale experiment named KISS (Klychevskoy Investigation - Seismic
Structure of an Extraordinary Volcanic System) was initiated in 2015 to cover the entire area of the Northern group of volcanoes with more than 100 stations operating simultaneously (Shapiro et al., 2017b). Recently the data of the KISS network were used to investigate the upper crustal structure beneath the KVG using the ambient noise tomography in two
independent studies (Green et al., 2020; Egorushkin et al., 2020) In this study, we present the first results of body wave tomography based on the KISS data that allowed us to enhance the resolution of the structures in the entire crust and mantle beneath NGV. In particular, this work provides a fundamentally new model of the mantle wedge that sheds light on the deep sources of the NGV volcanism.
2. Volcanic and Tectonic activity in NGV
NGV in Kamchatka combines diverse manifestations of recent volcanism. In particular, NGV includes several giant volcanic edifices some of which are among the largest ones in Eurasia. During the last 300-400 Ka, ~6200 km3 of volcanic material was deposited here, of which almost a half erupted along Pleistocene-Holocene (less than 50 Ka) (e.g., Melekestsev, 1980).
The NGV is located inside the broad Central Kamchatkan Depression (CKD) having the size of 280x130 km, which was formed in Late Pleistocene and Holocene. Some authors
suggest that subsidence in such a large area is caused by the accumulation of a significant amount of volcanic rocks leading to isostatic compensation of the crust (Melekestsev, 1980). According to another point of view, the CKD is a rift zone, in which the subsidence occurs due to the back-arc extension of the crust (Alexeiev et al., 2006). This hypothesis is in agreement with geological observation related to the extension of the onshore Kamchatka island arc (Kozhurin & Zelenin, 2017). The extension rate over mid-late Quaternary time is estimated between 1.5 and 3 cm/year based on geological data (Kozhurin & Zelenin, 2017) and numerical modeling (Schellart et al., 2007). One of the major geological structures accommodating this extension is the East Kamchatka Fault Zone (EKFZ) (Kozhurin et al., 2006), which includes many normal faults located at the eastern edge of the CKD (Figure 1c). Geological manifestation of the extensional regime is much less pronounced at the western edge of the CKD (Kozhurin & Zelenin, 2017). At the same time, another important fault zone nearly parallel to the EKFZ and hidden by recent volcanic deposits might be located just beneath the KVG. The existence of this Tolbachik-Bezymianny-Klyuchevskoy fault zone (TBKFZ) is suggested by alignment of several major volcanoes and numerous fresh
monogenetic cones (Ermakov & Vazheevskaya, 1973; Melekestsev et al., 1991; Churikova et al., 2015). The presence of this fault within the KVG is also supported by recent results of seismic tomography (Ivanov et al., 2016; Koulakov et al., 2017).
According to another concept, the CKD was formed in Eocene-Pliocene as a fore-arc basin when the subduction occurred more to the west, and the Sredinny Range acted as the main volcanic arc (Portnyagin et al., 2005; Avdeiko et al., 2007; Pevzner et al., 2017). The subduction and the volcanic front migrated to the east a few million years ago following the Miocene–Pliocene collision of the Kronotsky arc terrane (Alexeiev et al., 2006; Lander & Shapiro, 2007; Avdeiko et al., 2007; Pedoja et al., 2013).
To the east of the NGV, the CKD is bounded by the tectonic Tumrok and Kumroch ranges composed of Upper Mesozoic and Lower Cenozoic sedimentary and volcanic rocks. These ranges are the northward prolongation of the East Volcanic Front, which in its southern parts hosts Pleistocene and Holocene volcanoes originated due to the presently occurring Kuril-Kamchatka subduction. The northernmost active volcano in the East Volcanic Front is Kizimen located within the Tumrok range. Further to the north, along the Tumrok and Kumroch Ranges, no present-day volcanic activity is reported. However, there is some limited information about recent volcanic activity, such as a Mid- to Upper-Pleistocene
Tumrok volcano (Luchitsky, 1974) and a large Late-Pleistocene volcano Shish in the Kumroch Range (Ermakov & Matveev, 2017).
The subducting Pacific Plate is located at approximately 150 km depth below the NGV, which is considerably deeper than usually observed in volcanic arcs. Based on results of the regional tomography (Koulakov et al., 2011a), the slab beneath the NGV is steeper compared to other segments of the Kuril-Kamchatka Arc to the south. Another major result from this tomography model shown Figure 1a is that the NGV is located at the vicinity of the edge of the subducting Pacific Plate. To the northeast, a clear slab window between the Kamchatkan and Aleutian subduction zones is observed, which is also confirmed by a surface-wave tomography and the distribution of seismicity (Levin et al., 2002, 2005). The northernmost volcano of the NGV, Shiveluch, is located right above the edge of the plate. The presence of the slab window is considered as one of the main causes of the exceptionally diverse and intensive volcanic activity in the NGV(Yogodzinski et al., 2001), as it brings additional asthenospheric flow from below the plate, increasing the temperature below the arc (Park et al., 2002). One of possible manifestations of such asthenospheric flow is provided by a particular pattern of the upper-mantle seismic anisotropy observed near the slab edge (Peyton et al., 2001). Another reason for exceptional diversity and intensity of volcanic activity within the NGV might be the presence of the Emperor Ridge, which is a volcanic chain in the Pacific Ocean ending with the presently active Hawaiian hot spot (e.g., Park and Rye, 2019). Subduction of this chain of seamounts could cause a particularly high amount of volatiles and melts below the arc (Portnyagin et al., 2005; Dorendorf et al., 2000).
The major volcanoes of the NGV are shown in Figure 1b. The central part of NGV is occupied by the Klyuchevskoy volcanic group (KVG). Age estimations indicate that its basement was formed in Early- to Middle- Pleistocene times (e.g., Churikova et al., 2015). Besides three main active volcanoes (Klyuchevskoy, Bezymianny and Tolbachik), in KVG there are ten large volcanic edifices considered as dormant or extinct, as well as a number of smaller volcanogenic structures and monogenic cones.
The main volcano of the group, Klyuchevskoy (4835 meters altitude), is the tallest active volcano in Eurasia. During approximately 6000 years of its evolution, it has formed an almost ideal symmetrical cone showing that no catastrophic explosive eruptions or collapses ever occurred here. The Klyuchevskoy is active almost permanently producing moderate explosive and effusive eruptions from the summit crater and some of numerous flank vents
(e.g., Khrenov et al., 1991; Ozerov et al., 1997). The lavas are mostly composed of high-Mg basalts with some content of andesibasalts (e.g., Khrenov et al., 1989, 1991; Ozerov, 2000). According to Koulakov et al. (2017), Klyuchevskoy volcano is fed directly from the mantle sources through a vertical conduit, which is clearly traced by seismicity throughout the crust. The mantle source right below Klyuchevskoy is revealed as an anomaly with high Vp/Vs ratio at a depth of 30-35 km (Koulakov et al., 2011b, 2013, 2017), where strong and frequent deep long-period seismicity occurs (Shapiro et al., 2017a).
Bezymianny volcano is located at a distance of only 10 km from Klyuchevskoy, but has completely different eruption style and composition. It is mostly composed of medium-K calc-alkaline andesite with some partitions of dacites and basaltic andesites
(Bogoyavlenskaya et al., 1991). There is geochemical evidence that magmas of the
Bezymianny and Klyuchevskoy volcanoes interact with each other at some depth and evolve to reducing the compositional difference (Ozerov et al., 1997). Bezymianny is a relatively young and small volcano developed over the past ~4700 years (Braitseva et al., 1991). During the evolution of Bezymianny, several catastrophic eruptions took place; the strongest one occurred approximately 2100 yrs BP, after about 800 years of dormancy, as was
identified from deposits of coarse andesitic ash to the west of the volcano (Braitseva et al., 1995). After a ~1000 years of dormancy period, it resumed in 1955-1956 and produced a catastrophic Plinian type eruption causing a sector collapse that destroyed a significant part of the edifice (Gorshkov, 1959; Belousov & Belousova, 1998). After this eruption, Bezymianny has been producing almost yearly moderate explosive eruptions normally lasting for dozens of minutes to hours and ejecting ash up to the altitudes of 10-20 km (Girina, 2013). These eruptions lead to forming a new dome that gradually fills the caldera originated after the 1956 eruption (e.g., van Manen et al., 2010).
The third active volcano of the KVG is Tolbachik, which is actually a composite of two merged Ostry (Sharp) and Plosky (Flat) Tolbachik stratovolcanoes having altitudes of 3682 m and 3140 m, respectively, and a fissure area of 40 km length called Tolbachinsky Dol. The development of both stratovolcanoes started in the Late Pleistocene on an older large basaltic shield volcano (e.g., Churikova et al., 2015). The present volcanic activity of Tolbachik occurs as Hawaiian type eruptions of voluminous basalts originating along a fissure area starting from the summit of Plosky Tolbachik and continuing along Tolbachinski Dol. A prehistoric effusive eruption occurred 6,500 years BP led to forming a large caldera in the summit area of Plosky Tolbachik and caused a sector collapse of Ostry Tolbachik (e.g.,
Churikova et al., 2015). Later, the caldera was completely filled by outflowing lavas, which formed a flat plateau. During historical time, the largest eruption of Tolbachik occurred in 1975-1976 that led to forming several cones and voluminous lava flows in areas of the Northern and Southern Vents in the Tolbachinsky Dol (Fedotov, 1984). The estimated total volume of this eruption was ~2.3 km3 of basaltic lava that covered an area of ~50 km2
(Fedotov et al., 1991). The most recent fissure eruption of Tolbachik occurred in 2011-2012 and produced approximately 1 km3 of low-viscous basaltic lava that spread out to distances of
dozens kilometers from the vents (Belousov et al., 2015). The composition of the basalts in these eruptions varied from tholeiitic series (high MgO) to less primitive alkali-type (high Al basalts), which is interpreted by some authors as evidence of several magma sources feeding the eruptions of Tolbachik (e.g., Churikova et al., 2015). This is supported by the tomography model ([Koulakov et al., 2017) constructed with the data of a local seismic network in the area of Tolbachik, that revealed some structures of low-velocity and high-seismicity directed to the northeast toward the Klyuchevskoy volcano and to the southeast to the Tolud area, characterized by the seismicity in the lower crust.
Besides the main three active volcanoes, the KVG includes several large dormant and extinct volcanoes. To the west of Klyuchevskoy, there is a giant massif composed of two merged basaltic stratovolcanoes: Ushkovsky and Krestovsky with the altitudes of 3943 m and 4108 m, respectively (Churikova & Sokolov, 1993). The total volume of this massif is larger than that of all other volcanoes in KVG. These two volcanoes were formed
approximately 50,000-60,000 years BP, and at the initial stage, they developed as large shield volcanoes (Flerov & Ovsyannikov, 1991; Flerov et al., 2017). Presently, Krestovsky is
considered as extinct, whereas Ushkovsky manifests some moderate seismic and fumarolic activity (Ovsyannikov et al., 1985). The latest massive eruption in prehistorical time occurred ~6600 years BP along southeast oriented fissures at the foot of Ushkovsky that resulted in the formation of a series of cinder cones. The only eruption known in historical time occurred in 1890 in the summit area of Ushkovsky (Siebert & Simkin, 2013).
Zimina is another massif of extinct volcanoes with highest point of 3081 m located in the eastern part of KVG, which consists of several merged stratovolcanoes, namely
Ovalnaya, Ostraya and Malaya Zimina. In the lower part, this massif is composed of late Pleistocene basalts, but the main stratovolcanoes are composed of younger andesites and dacites (Flerov et al., 2019). There is no information about any recent eruption activity of
Udina volcanic massif located in the southeastern edge of KVG is composed of two stratovolcanoes Bolshaya and Malaya Udinas having andesitic and dacitic composition (Maksimov, 1976). There is no information about any recent magmatic eruption of these volcanoes; therefore, before 2017 they were considered as completely extinct. However, starting from December 2017, an increased seismic activity started to be recorded below this massif, which continues till now (Saltykov et al., 2018; Kugaenko et al., 2020). The data of a local temporary seismic network installed during this unrest have demonstrated that the seismicity is localized below Bolshaya Udina (Koulakov et al., 2019). Furthermore, these data were used to build a tomographic model that demonstrated a presence of an active magma reservoir beneath this volcano at a depth of less than 6 km (Koulakov et al., 2019).
Beyond the KVG, our study area also includes two more active volcanoes: Shiveluch to the north and Kizimen to the south. Shiveluch (~3300 m altitude) is the northernmost active volcano of Kamchatka and is one of the most active in the world (Melekestsev et al., 1991). Shiveluch is an isolated complex of several embedded cones and calderas
demonstrating complex history of violent explosive eruptions of this volcano (e.g., Belousov et al., 1999). In Holocene, Shiveluch dominantly produced medium-K and high-Mg
andesites; however, there were at least two episodes of basaltic eruptions 3600 and 7600 years BP (Volynets et al. 1997). In historical time, there were at least two catastrophic eruptions of plinian type in 1854 and 1964, which caused dome collapse and devastating debris avalanches (Gorshkov & Dubik, 1970; Belousov, 1995). Furthermore, numerous dome-associated events produced pyroclastic flows and ejected high ash plumes to the atmosphere posing problems to the aviation in the Pacific region (van Manen et al., 2012). The seismicity beneath Shiveluch was monitored by three permanent stations of KB GS; however, no detailed information about the deep structure beneath this area is available (Gorelchik et al., 1995).
Between KVG and Shiveluch, there is a complex of two extinct volcanoes:
Kharchinsky and Zarechny. Both of them are strongly eroded and mostly covered by recent sediments of the Central Kamchatkan Depression. Kharchinsky is a basaltic shield type volcano with some rare intrusions of andesibasalts (Volynets et al., 1998). Although Zarechny volcano appears to be embedded to Kharchinsky, it has completely different morphology and composition. It is classified as Somma-Vesuvian type having a large horseshoe caldera and a small cone inside. The composition of Zarechny is dominated by andesites similar to those in Shiveluch (Volynets et al., 1998).
To the south, our study area is limited by Kizimen (2485 m), an active stratovolcano of dominantly andesitic composition having a similar structure to Bezymyanny or Mount Saint Helen prior to their collapses (Melekestsev et al., 1995). Formation of Kizimen started approximately 12,000 years ago and occurred through at least three strong eruption series in Holocene (Braitseva et al., 1995). In historical time, two eruption episodes were recorded in 1928 and 2010-2013 (Auer et al., 2018). Kizimen is the northernmost active volcano of the Eastern Volcanic Front of Kamchatka (EVF). The continuation of EVF is the Tumrok and Kumroch Ranges, which do not contain any present volcanic activity (Figure 1b). However, on these ranges, there are two large extinct volcanoes of likely late Pleistocene age: Tumrok (Luchitsky, 1974) and Shish (Ermakov & Matveev, 2017).
The final site in this overview, Nikolka, is located in the southern part of the Central Kamchatkan Depression. Morphologically, Nikolka is an extinct, strongly eroded shield volcano dominantly composed of high-Al basalts (Laverov, 2005). There is not any information about Holocene eruption activity of this volcano.
3. Data description and algorithm
To enhance our knowledge about the crustal and mantle structures beneath KVG and surrounding areas, we have created an international consortium including several research groups from Russia, France, and Germany and initiated the KISS experiment (Shapiro et al., 2017b). In August 2015, we deployed a network consisting of 83 seismic stations in harsh natural conditions presuming utilization of light helicopters and off-road trucks. The
temporary network included 30 sensors Trillium Compact (period of up to 120 s), six Guralp CMG-6T (30 s period), eight Guralp-CNG-6TD (30 s period), nine CME-4111 (30 s period) and 30 Mark L-4C-3D with the nominal period of 1 s, which can be extended up to 20 s. All stations recorded three-component seismograms with the sample rate of 100 Hz. More details on the network are described in (Green et al., 2020). The network operated until July 2016. However, some stations shut down before the end of the experiment. A few stations were vandalized by bears; one station was destroyed by a lahar during the Klyuchevskoy volcano eruption; some of the stations stopped because of technical problems caused by frost or flooding. Nevertheless, the data of 77 temporary stations provided records for considerably long periods that in summary enabled very good data coverage. In addition to the temporary
KISS stations, in the same area, there were 25 permanent stations operated by KBGS, which provided in total more than 100 stations working simultaneously (Figure 2).
All data for the experimental period have been archived at the GEOFON data center (Shapiro et al., 2015) along with experiment and data preparation reports. The arrival times of the P and S waves from the local seismicity were manually picked using the DIMAS software (Droznin & Droznina, 2011), which is routinely used by KBGS to analyze data of tectonic and volcanic seismicity in Kamchatka. In Figure 3, we present a snapshot of this program demonstrating the picking process. It can be seen that for some events, the arrival phases could be identified in most station records, which provided more than 100 picks per event. The distribution of seismicity within the area is highly non-homogeneous. Most events in KVG occur in a dense cluster beneath the Klyuchevskoy volcano at a depth of around 30-35 km. To make the data more homogeneous, we made some selection of events. We primarily used the earthquakes located in the slab and in other parts of the KVG, different from the seismicity cluster beneath the Klyuchevskoy volcano. For the KISS experiment, we
processed 1122 events and picked 34,293 P and 32,998 S-phases. On average, it provided 60 picks per event.
Besides the KISS data, we have used other available data for the same area such as: data of the permanent network mostly related to the slab seismicity and data of the previous temporary network installed around Tolbachik in 2014-2015, which was used in the previous tomography study by Koulakov et al. (2017). When selecting the data for tomography, we used several criteria: (1) the events should be located at distances of less than 150 km from the center of the network (160.5°E longitude and 55.9°N latitude); (2) the total number of P and S picks per event should be equal or larger 10; (2) the time residuals after the location of sources in the starting 1D model should not be larger than 2 s. In total, for tomography, we selected 95,132 P and 96,524 S-picks from 7,464 events. The distributions of the events and the ray paths for the combined dataset are shown in Figure 4.
To perform the tomographic inversion, we used the LOTOS code for local earthquake tomography (Koulakov, 2009a). At the preliminary step, the code determines the absolute location coordinates of the sources using the grid-search method. Then the calculations are conducted iteratively by subsequent repeating the steps of inversion and source relocations in the updated 3D models. At this stage, we use another algorithm of source location that is based on the bending ray tracing method initially proposed by Um and Thurber (1987).
The models of the P and S wave velocities were parameterized by a set of nodes distributed in the study area according to the data coverage. In the map view, in areas where the ray density is larger than a certain threshold (0.1 of the average value), the nodes are installed with the regular spacing of 5 km. In the vertical direction, the node spacing depends on the ray density, but should not be smaller than 3 km. This grid does not allow us to resolve some fine details that were previously restored using more local tomography models (e.g., Koulakov et al, 2017). To reduce the effect of the grid geometry on the results, we performed inversions in four differently oriented grids (with basic orientations of 0°, 22°, 45° and 66°). Then, we averaged the results and created a regularly spaced 3D velocity model, which was used in the next iteration to update the source locations.
The new feature of the inversion procedure in this study is that instead of the velocity perturbations, we use the slowness anomalies as unknown parameters. This appears to be more effective for studying the areas with large depth ranges, where the reference velocity varies considerably. Indeed, when using the velocity anomalies, the elements of the
sensitivity matrix is proportional to 1/V02, where V0 is the reference velocity. This means that
for the mantle compared to the crust, the elements of the matrix appear to be almost twice smaller, which leads to smoother and lower amplitude anomalies recovered at greater depths. In the present scheme, when slowness anomalies are used, the matrix elements for the mantle and crustal nodes have similar values.
For the inversion, we used the LSQR method (Paige & Saunders, 1982; Nolet, 1987), which effectively solve large systems of linear equations with corresponding sparse matrices. The amplitudes and the flattening of the models are controlled by additional equations that minimize the values of anomalies in the nodes and differences between anomalies in
neighboring nodes. The weighting coefficients for these damping equations are set based on the results of synthetic modeling. In the case of using slowness instead of velocity, the values of these coefficients appear to be larger (in our case, 50 for smoothing of both P and S wave models). In our case, we did not implement the amplitude damping. In addition to the slowness parameters, we simultaneously invert for the source corrections (three parameters for the coordinates and one parameter for the origin times). The algorithm allows also including the station corrections to remove the effect of shallowmost structures directly below stations. However, in our case, we did not use this option. In total, we performed five iterations of subsequent inversions and source relocations.
4. Tomography results
Prior to considering the results of experimental data inversion, we present several tests showing the robustness and the resolution limitations of the obtained models. First, we
performed several synthetic tests that allow us to not only assess the resolution, but also to determine optimal values of the controlling parameters for the inversion. The synthetic velocity model is created by superposition of the 3D anomalies to the 1D reference velocity model. For the existing source-receiver pairs, we calculate the travel times in the 3D synthetic model and perturb them with random noise (0.1 s and 0.15 s for the P and S data,
respectively). Then we “forget” all information about the velocity distribution, source
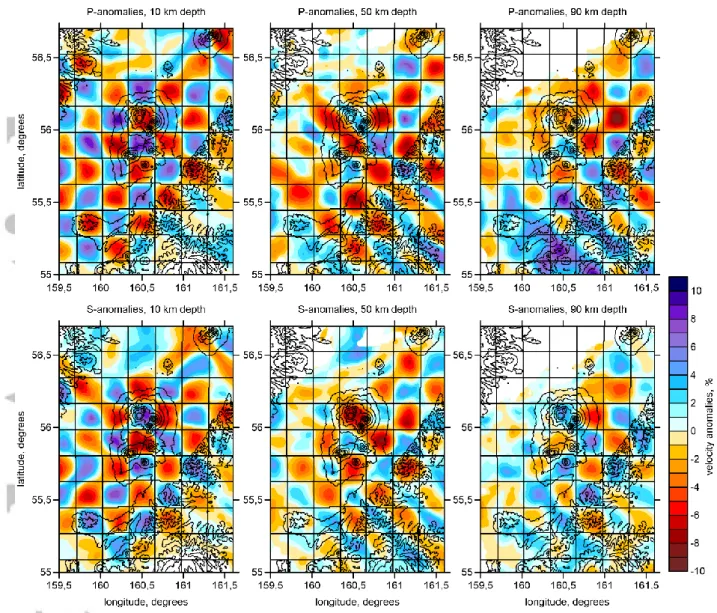
coordinates and origin times and perform the recovery of the model using the same workflow and same controlling parameters as in the case of the experimental data processing. In Figure 5, we present a checkerboard model with alternating anomalies having the lateral size of 20x20 km and amplitudes of ±5%. With depth, these anomalies change the sign at depths of 30 km, 70 km, 110 km etc. We present the results of this test at depths of 10 km, 50 km and 90 km corresponding to centers of the layers. It can be seen that the anomalies for both P and S wave models are correctly recovered in all layers in most parts of the study area, where the data are available.
In Figure 6, we show the locations of events in map view and in one vertical section during recovery of the checkerboard model presented in Figure 5. It can be seen that in the first iteration, corresponding to the locations of sources in the starting 1D velocity model, the mean error of determination of source coordinates is 7.53 km. After recovery of the 3D velocity models during five iterations, the mean error gradually decreased to 4.25 km. It can also be observed that most crustal events within the network are restored with high accuracy. At the same time, the mislocations for the remote and deep earthquakes remain large after performing the inversions. We can also observe some outliers that are caused by errors in the synthetic data and insufficient number of picks for such events. Nevertheless, as we see in Figure 5, these mislocations do not prevent recovering high-quality velocity models. As was shown by Koulakov (2009b), some negative effect of poorer locations of out-of-network events is totally compensated by a positive effect of a better ray coverage and a larger amount of data when such data are taken into consideration.
In another series of tests, we defined squared anomalies of 40x40 km and 30x30 km size in a vertical section, same as used for presenting the main results. In the direction across
the section, the anomalies have the length of 50 km. It can be seen that for both models, in the central part of the profile, the anomalies are correctly resolved down to ~150 km depth. This test can be compared with similar tests presented in Koulakov et al. (2016) based on data of the permanent KBGS network calculated using the same tomography algorithm. The difference is especially clear in the test of vertical resolution: in the present study, the inversion can recover 6 layers of opposite signs down to 150 km depth, which was not achievable in the previous studies. For the crustal structures, the resolution tests can be compared with those in (Koulakov et al., 2017), which shows that adding the KISS data has considerably improved the quality of the recovered models. Although the total amount of the KISS events and picks is smaller than those in the initial catalogue composed of data of the previous permanent and temporary networks, the high ratio of picks per event in the KISS dataset allows us to stabilize the inversion and to reduce the trade-off effect between the velocity and source parameters.
Another test, which is important for interpretation of the Vp/Vs variations in vertical sections, is presented in Figure 8. We consider two synthetic models defined by free-shaped synthetic anomalies with high Vp/Vs ratio representing ascent of fluids and melts from the slab. In Model 1 (left column), we set a continuous anomaly, whereas in the Model 2, a series of isolated anomalies фку сщтышвукув. The recovery results demonstrate that we have sufficient resolution to distinguish these two cases.
Another important test is aimed at assessing the influence of random errors in the data to the recovered models. This test consists of inversions of two independent subsets separated by a random criterion, such as using events with odd and even numbers (Odd/even test). If the data are dominated by noise, the restored anomalies would be also random and, thus, considerably different. We show the results of this test in Figure 7 in one horizontal and one vertical section. Although some minor features appear to be not identical, the general shapes of the main anomalies, which will be used for interpretation, look very similar. This can serve as another argument for the robustness of the derived results.
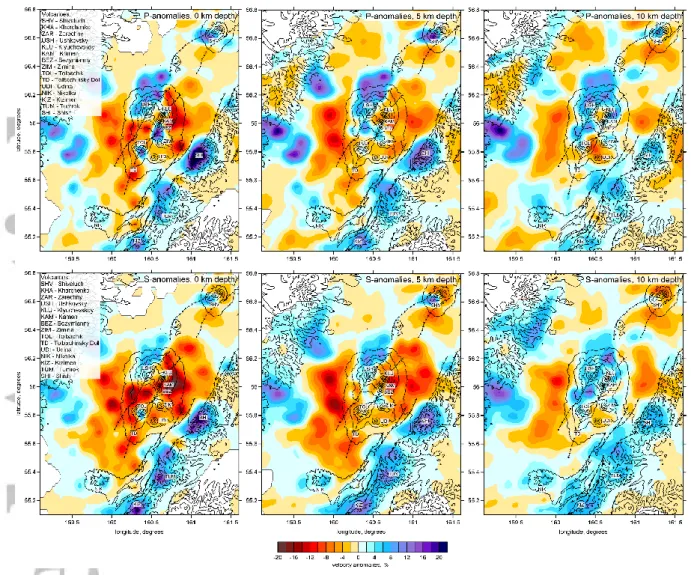
The main model derived from the inversion of the experimental dataset is presented in several horizontal and vertical sections. The Vp and Vs anomalies in the upper crust (0, 5 and 10 km depth) are shown in Figure 8. The velocity anomalies in the lower crust (15 km and 25 km) and at the bottom of the crust (35 km) are shown in Figure 9. The resulting P and S wave anomalies in the uppermost mantle (50 km depth) are presented in Figure 10. The velocity
anomalies together with the earthquake hypocenters are shown in Figure 11 in three vertical sections crossing the major volcanic centers. Finally, the distributions of the Vp/Vs ratio at the depth of 35 km and in three vertical sections are presented in Figure 12. Note that the Vp/Vs ratio is calculated by division of the independently derived resulting absolute values of Vp and Vs.
It can be seen that in this study, the independently calculated P and S wave velocity anomalies look strongly consistent with each other at all horizontal and vertical sections. This is different from many local-scale studies of volcanic structures, where the P and S wave anomalies often do not match each other, and are sometimes inversely correlated. In regional-scale tomography studies same types of geological structures are usually revealed in a similar way for the P and S wave velocities. For example, sedimentary basins always exhibit lower velocities, whereas strongly consolidated batholiths are usually associated with high-velocity anomalies. Therefore, good correlation of the calculated P and S wave velocity anomalies could be considered as another argument for the reliability of the results.
In the crust, the model is generally consistent with the previous study by Koulakov et al. (2017), because at shallow depths, the tomography is mostly controlled by the same subsets as used in the previous case. We also observe some correspondence with the new results of the ambient noise tomography (Green et al., 2020) and especially with (Egorushkin et al., 2020).
5. Discussion and Interpretation
5.1. Volcano-related structures in the crust
The upper crustal part of the derived tomography model is presented in three
horizontal sections in Figure 8; the lower-crustal structures are shown in sections at 15 and 25 km depth in Figure 9. In the upper crust, the P and S wave velocity anomalies show clear correlation with most of known volcanic structures. Within the KVG, the most prominent high-velocity anomaly, which is similarly expressed in the P and S wave models, is located beneath the Ushkovsky-Krestovsky composite volcano. At the depth of 10 km, almost the entire complex, except for the junction with the Klyuchevskoy volcano, is associated with a high-velocity body, but at a zero level, the high-velocity is only observed beneath the northwestern segment of the massif. The Ushkovsky-Krestovsky complex represents a giant
mass of consolidated basaltic material and forms the largest volcanic edifice within KVG. The observed high-velocity anomaly may represent the basement and crustal roots of this massif. Partly, this anomaly might be due to the gradual subsidence of the heavy body of the Ushkovsly-Krestovsky complex. On the other hand, this high-velocity structure, which is observed down to ~15 km depth, may be related to a widespread branching system of frozen conduits that brought a huge amount of basaltic magma to build this complex.
In the lower crust, at approximately 25 km depth (Figure 9), right below Ushkovsky, we observe a highly contrasted low-velocity anomaly that may represent the remnant of a former active plumbing system of this large complex. Based on the apparent link between this anomaly and the deep magma source beneath Klyuchevskoy marked by an intensive deep long-period seismicity cluster (see vertical section 2 in Figure 11), we can propose that the Ushkovsky volcano was previously fed from the same mantle source as presently provides magma to the Klyuchevskoy volcano. The existence of the still active magma source beneath Ushkovsky might explain the current activity of this volcano, which is not strong, but still observable (eruption in 1890, current fumarolic and seismic activity) (Ovsyannikov et al., 1985).
It is interesting to note that the high-velocity anomaly in the upper crust beneath Ushkovsky-Krestovsky is shifted northward in respect to the center of the massif. The northernmost margin of the anomaly appears to spread outside the limits of the KVG. We propose that this anomaly may represent the contour of an ancient shield volcano that existed here prior to the beginning of the development of the Krestovsky-Ushkovsky complex 50-60 Kyr BP (Flerov & Ovsyannikov, 1991). This hypothesis can be supported by findings of the Upper-Pleistocene basalts along the western and northern borders of the massif that are associated with the pra-Ushkovsky shield volcano (Flerov et al., 2017). Our model shows that this shield volcano might spread further to the north, but its traces are presently hidden by recent sediments of the Central Kamchatkan Depression.
In the shallow most section, the high-velocity anomaly is only visible at the
northwestern flank, whereas to the south, between the Ushkovsky and Tolbachik volcanoes, we observe a prominent low-velocity anomaly, which is similar in shape and amplitude in the P and S wave velocity models. This relatively thin low-velocity layer is probably associated with the accumulated volcanic deposits resulted from eruptions of the surrounding volcanoes.
Another high-velocity anomaly in the upper crust is associated with Tolbachik, which is another giant basaltic massif in KVG. At the same time, this anomaly appears to be much less prominent compared to that beneath Ushkovsky-Krestovsky. This seems not to support a hypothesis that the present edifices of the Tolbachik complex were built in Late Pleistocene over a large shield volcano, similarly as in the case of Ushkovsky-Krestovsky (e.g.,
Churikova et al., 2015). In our tomography result, we do not observe any anomaly that might be identified as a hidden part of this pra-Tolbachik volcano. Another possible reason for the smaller size of the Tolbachik-related high-velocity anomaly is the fact that this system is highly active and strongly perturbed with magma conduits that still remain hot and highly saturated with fluids. This gives an integral effect that lowers the seismic velocity in the crust. It is important that the area of Tolbachinsky Dol in the upper crust is associated with strong low-velocity anomalies both in the P and S models. These anomalies might be caused by magma conduits that remain hot in this zone after the large eruption of 2011-2012, or maybe related to earlier eruptions, such as one in 1975-1976.
The third large high-velocity anomaly is observed in the area of Zimina volcano, which is another large extinct volcanic massif in KVG. In contrast to Ushkovsky-Krestovsky and Tolbachik, the edifice of Zimina is composed of mainly andesitic and dacitic rocks (Flerov et al., 2019). At the same time, there are some evidences that this complex was built over an old basaltic volcano. In this case, in our tomography model, the high-velocity anomaly can be used to map the basement of this Pra-Zimina volcano.
Unexpectedly, beneath Udina, which was presumed structurally and compositionally similar to the Zimina complex (Maksimov, 1976), we detected a low-velocity anomaly both in the P and S wave models. Before the end of 2017, this volcano was considered as extinct, but then it started to manifest considerable seismic activity with earthquakes reaching the magnitude of ML=4.3 (Saltykov et al., 2018; Kugaenko et al., 2020). Installing a temporary
network allowed accurate locations of seismicity and the building of a velocity model that proved that a shallow magma source right below Bolshaya Udina is at an active state
(Koulakov et al., 2019). The authors of that study suggested that the magma has arrived from the Tolud field located to the south of Udina. However, our study demonstrates that prior to this unrest, in 2015-2016, when the KISS network operated, the low-velocity anomaly
already existed there, which may indicate that the activation of magma sources occurred right below Bolshaya Udina. On the contrary, we do not see any anomaly associated with the
Tolud field, which makes it doubtful originating large magma reservoirs there that might feed the Tolbachik eruptions.
In our model, we do not observe any prominent anomalies in the crust associated with the Kluchevskoy and Bezymianny volcanoes. One of the reasons might be the fact that our model is mostly oriented to revealing large regional-scale structures, and with the grid spacing of 5 km, it is not able to resolve relatively small crustal magma chambers and conduits that are presumed beneath these two young volcanoes. In this sense, the previous tomography models by Koulakov et al. (2011b, 2013, 2017), which were specially focused on the crustal anomalies at the vicinity of the Klyuchevskoy volcano and had much finer grid spacing, are more suitable for investigating these structures.
Around the KVG, we observe prominent low-velocity anomalies associated with the Central Kamchatkan Depression (CKD). Similar anomalies reaching to significant depths were identified by ambient noise tomography (Green et al., 2020). These anomalies were interpreted as sediments accumulated in the fore-arc and rift basin down to 8 km depth. Within this sedimentary basin, Green et al. (2020) identified a shallower layer with the bottom boundary at ~3 km depth with considerably lower velocities. Similar structures within the CKD were derived from deep seismic sounding performed in this area in the 1970s in (Anosov et al., 1974; Utnasin et al., 1974). It is unlikely that such amount of subsidence occurred merely due to isostatic compensation caused by the volcanic mass growing, as proposed by Melekestsev, (1980). Green et al. (2020) proposed that the CKD subsidence and accumulation of sediments occurred in two stages. The first stage was related to relatively slow formation of the fore-arc basin during Eocene-Pliocene, when Sredinny Range acted as the main volcanic arc (Avdeiko et al., 2007; Portnyagin et al., 2005). The second stage started a few MA ago, after major re-configuration of the subduction zones at the vicinity of the Kamchatka-Aleutian junction following the Miocene–Pliocene collisions of the Kronotsky arc terrane (Alexeiev et al., 2006; Lander & Shapiro, 2007; Avdeiko et al., 2007; Pedoja et al., 2013).
Outside KVG, there are also several crustal features that appear to be associated with volcano-related structures. For example, to the southwest of KVG, Nikolka, a large extinct shield volcano of basaltic composition, is associated with a prominent high-velocity anomaly. Similarly as in the case of Ushkovsky-Krestovsky, this anomaly is traced throughout the crust and may represent not only the body of the shield volcano, but also a well-developed branchy
system of frozen conduits that delivered the basaltic magmas from the mantle to the surface during the activity of Nikolka.
Note that the high-velocity anomalies are associated not only with basaltic volcanoes, but also observed beneath some active volcanoes with felsic compositions. For example, beneath the southwestern part of the Shiveluch, a prominent high-velocity anomaly is observed in the upper crust down to ~10 km depth. This is a typical andesitic volcano with violent explosive eruptions strongly disturbing the edifice and forming extensive deposits of pyroclasts in the surrounding areas (e.g., Belousov et al., 1999). Therefore, low velocity at shallow layers would be more expected than the high-velocity ones. Nevertheless, the existence of high-velocity bodies within volcanic edifices having predominant silicic composition is not uncommon. Similar features were observed in a number of andesitic volcanoes in the world: Mt. Vesuvius in Italy (Zollo et al., 1998), Redoubt volcano in Alaska (Kasatkina et al., 2014), Popocatépetl volcano in Mexico (Kuznetsov et al., 2014) and others. It means that beneath such volcanoes the magmatic intrusions may form voluminous
consolidated bodies reaching considerable depths that are expressed as high-velocity anomalies.
Beneath another active andesitic volcano, Kizimen, located at the southern margin of the study area, a dominant high-velocity structure is also observed. However, in this case, the high-velocity anomaly might not be directly associated with the ongoing magmatic activity of this volcano and rather reflects regional tectonic processes in this region. Kizimen is the northernmost active volcano in the East Volcanic Front (EVF). To the north of Kizimen, at the continuation of the EVF, beneath the Tumrok and Kumroch Ridges, we observe clear high-velocity anomalies in the upper crust that correlate with high topography along the ridges. We propose that these velocity structures are caused by an active tectonic uplift of this belt that brought up higher-velocity rocks from deeper crustal layers. Another factor to
increase crustal seismic velocity is the presence of extinct large volcanic systems along the Tumrok and Kumroch Ridges, such Shish and Tumrok volcanoes (Figure 8). Beneath Kizimen, the anomalies appear to be similar to those in other parts of the ridge. No distinct feature in the seismic model that could be associated with the ongoing eruption activity of this volcano is detected, probably due to lack of sufficient resolution of the tomography model in this part of the area.
5.2 Vp/Vs ratio is the indicator of volatiles beneath NGV
Figure 12 shows the distribution of the Vp/Vs ratio at the depth of 35 km and in three vertical sections. In the literature, the Vp/Vs ratio is usually associated with the presence of liquid phases: volatiles and melts (e.g., Takei, 2002). This is a major indicator, which is used in many seismic tomography studies at volcanoes to map the properties of magma reservoirs and conduits (e.g., Kasatkina et al., 2014; Koulakov et al., 2017; Kuznetsov et al., 2014).
Here, the major feature is an anomaly of high Vp/Vs ratio right below the
Klyuchevskoy volcano at depths around 35 km. This anomaly, which was revealed earlier in a number of previous tomography studies of the Klyuchevskoy volcano and surroundings (Koulakov et al., 2011b, 2013, 2017), coincides with an intense cluster of strong long-period seismicity (Shapiro et al., 2017a) that might be explained by an increased content of
oversaturated volatiles, mainly H2O and CO2 (Melnik, pers. comm.). In (Koulakov et al.,
2017), this anomaly was interpreted as a magma reservoir at the base of the crust connected with the Klyuchevskoy volcano by a straight conduit, which is clearly traceable by vertically aligned seismicity. This is interesting that in the results of time-lapse tomography studies of the evolving plumbing system beneath Klyuchevskoy (Koulakov et al., 2013), this anomaly remained unchanged, whereas the structures in the middle and upper crust were strongly variable in accordance with the eruption activity of Klyuchevskoy and Bezymianny. All the mentioned studies provided robust images of this anomaly at the base of the crust, but did not reveal any link of this anomaly with deeper structures. For the first time, this study allows us to trace the feeding system of Klyuchevskoy and other volcanoes of KVG down to the mantle.
In Section 2A-2B in Figure 12, we can see that below the crust, this anomaly appears to be connected with the slab through a series of anomalies of higher Vp/Vs ratio highlighted with blue dotted lines, which might represent a volatile flow escaping from the slab. It can be seen that the dehydrating zone of the slab producing these volatiles is located in the depth range from 100 to 150 km. The presence of three branches of anomalies going out from the slab may indicate different stages of the phase transitions occurring in the subducting lithosphere. The reliability of these structures is verified through a series of synthetic tests shown in Figure 8. These tests demonstrate fair vertical resolution allowing to distinguish cases of continuous and isolated anomalies and prove that the observed linear anomalies are not caused by vertical smearing.
In another projection shown in Section 4A-4B (Figure 12), we do not observe the roots of the volatile conduits. However, in this section, we clearly see how the anomaly of high Vp/Vs ratio is spread out laterally along the bottom of the crust. This can also be seen in the map at 35 km depth in Figure 12. This structure can indicate that part of the material from the main reservoir below Klyuchevskoy migrated horizontally and reached an area at the bottom of the crust below Tolbachik. Based on this observation, we can conclude that at least part of material for the Tolbachik’s eruptions ascend directly from the mantle source located straight below this volcano. This corroborates the hypothesis about possible inter-connection between magmatic feeding of main active KVG volcanoes (Fedotov et al., 2010). Another connection between the active KVG volcanoes can exist along the shallow part of the TBKFZ as suggested by the high Vp/Vs ratio anomaly seen in the top 10 km in Section 4A-4B. The anomalies of Vp/Vs ratio beneath Tolbachik can also be observed in another projection in Section 3A-3B. Similar to the profile 2A-2B, we detect three anomalies of high Vp/Vs ratio highlighted by dotted blue lines, going out from the slab in the depth interval from 100 to 150 km, which may represent volatile flow ascending from the dehydrating slab. At the same time, in this section, the flows do not join with each other, remain isolated and disappear at some depth. This might be a reason why these flows did not provide sufficient amounts of overheated volatiles to create a similar strong magma reservoir as one observed beneath Klyuchevskoy.
5.3 Feeding the NGV through the slab window
The P and S wave low-velocity anomaly in the mantle wedge beneath NGV observed in the horizontal section at the depth of 50 km in Figure 10 and in vertical sections in Figure 11 is elongated beneath the entire NGV from Shiveluch to Kizimen. In vertical section 1A-1B in Figure 11, it can be seen that this anomaly is slightly inclined having the deepest part beneath Shiveluch and then gradually becoming shallower to the south. We can also see that beneath Shiveluch, this anomaly has a deepest root reaching the bottom of the resolved area at ~120 km. As was earlier shown by Koulakov et al. (2011a), Shiveluch is located right above the edge of the subducting Pacific Plate. As seen in the regional tomography model shown in Figure 1a, further to the northeast, there is a window between the slabs
corresponding to the Kuril-Kamchatkan and Aleutian segments (see also Levin et al., 2002, 2005). Based on this information, we interpret the low-velocity “column” observed in Section
1A-1B beneath Shiveluch as a mantle flow ascending from below the Pacific Plate through the slab window, similarly as proposed by Park et al. (2002). This mantle upwelling
combined with the around-slab-edge asthenospheric flow might be the main cause of the recent tectonic deformations in the eastern CKD that will be discussed in the next sub-section. The high-velocity anomaly below 100 km depth at distance of 25-160 km along Section 1A-1B might represent colder material of the subducting Pacific Plate.
Figure 13 presents a schematic representation of the mantle flow beneath NGV. The hot material, which initially ascended beneath Shiveluch, then spread out along the bottom of the crust and reached the southern border of NGV and even Kizimen. At the same time, the tomography images in Section 1A-1B reveal another vertical anomaly beneath Kizimen, which can be considered as another ascending flow in the mantle wedge. This corresponds to the concept that the ascent of fluids and melts in the mantle wedge is not continuous, but is organized in a form of discrete “hot fingers” separated from each other at distances of ~100-150 km (Dobretsov & Kirdyashkin, 1997; Tamura et al., 2002), which is consistent with our case.
The low-velocity seismic anomaly originating from the Aleutian-Kamchatka slab window is spread to the southwestern direction along a narrow band. A possible explanation for this is that the asthenospheric flow is controlled by the particular pattern at the edge of the Kuril-Kamchatka subduction zone resulting in the material flowing along the slab (Peyton et al., 2001; Park, 2002; Levin et al., 2002). Another possible explanation is that the narrow low velocity anomaly at 50 km depth can correspond to the break of the slab remnant from the extinct subduction beneath the Sredinny range. The depth of 50 km is in agreement with the possible present-day location of this slab (Avdeiko et al., 2007). This finding appears to be in agreement with the receiver function results by Nikulin et al. (2010) revealing an anomalous body in the mantle wedge that was interpreted as a stacked slab fragment that served as a second magma source for KVG (Nikulin et al., 2012). The recent study by Park and Rye (2019) proposed that this structure appeared due to metasomatic underplating of the Hawaii-Emperor seamount chain underneath KVG causing detachment of a fragment of hydrated lithosphere that remained stranded due to its anomalous buoyancy.
5.4. Mantle sources for the rifting processes in CKD
One of the main contributions of the new dataset collected with KISS is the improved resolution of tomographic images in the uppermost mantle, which allow us to image
previously unknown details of the structure of the mantle wedge. Figure 10 presents the distribution of seismic velocities at 50 km depth. The main feature that appears both in P and S images is a large low-velocity anomaly aligned in a north – northeast direction and
confined between the EKFZ and the TBKFZ. The low-velocity anomalies are related to the presence of relatively hot mantle material beneath the eastern part of the CKD. We interpret this observation that the quaternary extension of the CKD (Kozhurin & Zelenin, 2017) has been driven from the mantle and localized in its eastern half between the KVG and the Kumroch and Tumrok ridges.The difference between the western and eastern parts of the CKD has been also revealed by a recent study of Green et al. (2020) based on ambient noise surface wave tomography of the upper crust. This tomography has shown much deeper sedimentary deposits (up to 8 km thick) beneath the western CKD compared to those beneath its eastern part. The distribution of seismic velocities in the uppermost mantle confirms interpretation of the western CKD as former long‐lived fore‐arc basin associated with the past subduction beneath the Sredinny Range (Avdeiko et al., 2007; Portnyagin et al., 2005). The eastern CKD appears as a much more recent active rift-type basin.
The new tomographic results augment the scenario for the tectonic development of the CKD proposed by Green et al. (2020) and add some new information on the history on
volcanic activity within the KVG, which is schematically illustrated in Figure 14. The western part of the CKD has been developed as a fore-arc basin associated with the former subduction below the Sredinny range (Figure 14a). The eastern edge of this basin was located approximately in the vicinity of the current location of the active KVG volcanoes or of the TBKFZ. The Sredinny range subduction stopped and the volcanic front migrated to the east a few million years ago following the Miocene–Pliocene collisions of the Kronotsky arc terrane as shown in panels b and c in Figure 14 (Alexeiev et al., 2006; Lander & Shapiro, 2007; Avdeiko et al., 2007; Pedoja et al., 2013). This major tectonic event resulted in the
reconfiguration of the subducting oceanic lithosphere: opening of the Kamchatka-Aleutian slab window and consecutive breaking and likely several episodes of detachment and loss of the relict slab (Figure 14c). As a result, an along-slab asthenospheric flow from the slab window in the south-west direction was initiated that was a likely origin of the opening of the rift-like basin east of the TBKFZ (Figure 14d). Note that the idea that the current width of the
east CKD basin (~40 km) is in agreement with an a few MA long extension and suggested extension rates between 1.5 and 3 cm/year (Schellart et al., 2007; Kozhurin & Zelenin, 2017).
At some point in Pleistocene, the rifting combined with the volatile-rich fluids, raising from the newly formed slab, resulted in the intense volcanism. At early stages, large shield volcanoes (such as KVG basement, Ushkovsky-Krestovsky, Older Tolbachik, Nikolka) were formed (Figure 14c). The locations of the Pleistocene Shish and Tumrok volcanoes in front of the KGV on the opposite sides of the eastern branch of CKD may indicate their common origin. A possible scenario is that before the beginning of the east CKD rifting episode, the Klyuchevskoy cluster of volcanoes was located much closer to the continuation of the EVF and might appear to be in the same group with Shish and Tumrok volcanoes. Following the crustal extension and formation of a recent rift basin, these groups were separated as shown in Figure 14d. As a result, the ongoing volcanic activity has focused in its western side along the TBKFZ, whereas the volcanoes in the eastern side stopped their activity.
6. Conclusions
We present a new seismic model of the crust and uppermost mantle beneath the Northern Group of Volcanoes (NGV) in Kamchatka. In this study, we combined the seismic data of all permanent and temporary networks ever operated in this area including the KISS network deployed in 2015-2016 by an international consortium. Although most parts of the study area were not inhabited and not accessible by any ground transportation, the joint efforts of many specialists from different institutes of Russia, Germany, and France made it possible to collect a large dataset necessary to develop new high-quality tomography models. The synthetic tests performed within this study have demonstrated exceptionally high
resolution that was previously achievable only in well instrumented areas, such as Japan or Indonesia. The derived tomography model demonstrates highly contrasted structures in the crust and the mantle wedge that shed light on tectonic history of the CKD and explains the particularly diverse and intense manifestations of volcanic activity in the NGV.
In the crust, we found several prominent anomalies that can be associated with current and previous volcanic activity. For example, a large high-velocity in the area of the giant basaltic complex of Krestovsky and Ushkovsky volcanoes may represent a hidden part of a large shield volcano. Similar, but smaller anomaly is observed beneath Zimina, which may
represent the basaltic basement on which this andesitic volcano was formed. High velocity anomalies in the upper crust mark the existence of large consolidated igneous bodies beneath other volcanoes, such as Shiveluch, Tolbachik, Nikolka and Kizimen.
The distribution of the Vp/Vs ratio reveals the major zones affected by the presence of volatiles ascending from the subducting slab. Figure 12 clearly indicates that such ascent is occurring beneath the TBKFZ and is not present beneath the EKFZ. This might explain why the volcanism is at present extinct east of the CKD. We note a particularly bright spot corresponding to a mantle reservoir right below the Klyuchevskoy volcano, which was already studied in several previous tomography studies. In this research, for the first time, we identified the connection of this anomaly with the slab. We observe a series of the high Vp/Vs anomalies suggesting several flows of volatiles escaping from the dehydrating slab in the depth interval of 100-150 km and forming a single conduit at shallower depths, which directs toward the magma reservoir beneath Klyuchevskoy.
We observe a remarkable correlation between a prominent elongated low-velocity anomaly in the mantle wedge and the major fault zones identified at the surface: the EKFZ and the TBKFZ that border the mantle anomaly from the east and the west respectively. These two major fault zones likely accommodate the recent extension of the eastern branch of CKD that in turn is likely caused by the upwelling of the hot mantle material brought by the around-slab-edge asthenospheric flow. Therefore, the eastern CKD most likely has been formed as recently active rift-type basin.
Overall, our tomographic model shows that the NGV volcanism developed after the major subduction reconfiguration following the Miocene–Pliocene collisions of the
Kronotsky arc terrane and has been fed by two sources: the rifting caused by the
asthenospheric flow from the Aleutian-Kamchatka slab window and the upwelling of the volatile-rich fluids from the slab, typical for subduction zones. Combination of these two sources likely explains the exceptional level of volcanic activity in the NGV region and the diversity of volcanic manifestations, especially the large number of basaltic shield volcanoes not typical for purely subduction volcanic chains. Our tomographic model also reveals the interconnected feeding system of the most NGV volcanoes through flow of magma and volatile rich fluids at the base of the crust along the TBKFZ. This supports the hypotheses proposed in previous studies [e.g., Fedotov et al., 2010] and may explain the observed
significant correlations between the eruptive activities of the major NGV volcanoes [Senyukov et al., 2017].
Acknowledgments
We thank Alexander Lander, Andrey Kozhurin, Tatiana Churikova and Boris Gordeychik for helpful discussions. This study was supported by the Russian Ministry of Education and Science (grant N 14.W03.31.0033), and by the European Research Council (ERC) under the European Union Horizon 2020 Research and Innovation Programme (grant agreement 787399-SEISMAZE). Scientists from IPGG were supported by the RFBR Grant #18‐55‐ 52003 and RSF Grant #20-17-00075. SSL is supported by the program NIOKTR АААА-А19-119031590060-3. Seismological data are available from the GEOFON data center of GFZ‐Potsdam (https://geofon. gfz‐potsdam.de/). Derived products from this publication, including travel times of P and S waves and the full folder of the LOTOS code that allows reproducing all the results of this research are presented in the file depositary: Koulakov Ivan. (2020, April 30). LOTOS code with the KISS data (Kamchatka) (Version LOTOS code, version for Windows OS). Journal of Geophysical Research, Solid Earth. Zenodo. http://doi.org/10.5281/zenodo.3778982
References:
Alexeiev, D. V., Gaedicke, C., Tsukanov, N. V., & Freitag, R. (2006). Collision of the Kronotskiy arc at the NE Eurasia margin and structural evolution of the Kamchatka-Aleutian junction. International Journal of Earth Sciences, 95, 977–993.
https://doi.org/10.1007/s00531-006-0080-z
Anosov, G. I., Balesta, S. T., Ivanov, B. V., & Utnasin, V. K. (1974). The main features of tectonic structure of the Klyuchevskoy Group of Volcanoes (Kamchatka) inferred from deep structure. Doklady AN SSSR, 219, 5, 1192–1195 (In Russian).
Auer, A., Belousov, A., & Belousova, M. (2018). Deposits, petrology and mechanism of the 2010–2013 eruption of Kizimen volcano in Kamchatka, Russia. Bulletin of
Volcanology, 80, 33. https://doi.org/10.1007/s00445-018-1199-z
Avdeiko, G. P., Savelyev, D. P., Palueva, A. A., & Popruzhenko, S. V. (2007). Evolution of the Kurile-Kamchatkan volcanic arcs and dynamics of the Kamchatka-Aleutian junction. In J. Eichelberger, E. Gordeev, P. Izbekov, M. Kasahara and J. Lees (Eds.),
Volcanism and Subduction: The Kamchatka Region. Geophysical Monograph Series
(Vol. 172, pp. 37–55). Washington, DC: American Geophysical Union. https://doi.org/10.1029/172GM04
Belousov, A. B. (1995). The Shiveluch volcanic eruption of 12 November 1964-explosive eruption provoked by failure of the edifice. Journal of Volcanology and Geothermal
Research, 66, 357–365.
Belousov, A. B., & Belousova, M. G. (1998). Bezymiannyi eruption on March 30,
1956 (Kamchatka): sequence of events and debris-avalanche deposits. Volcanology
& Seismology, 20, 29–49.
Belousov, A., Belousova, M., Edwards, B., Volynets, A., & Melnikov, D. (2015). Overview of the precursors and dynamics of the 2012–13 basaltic fissure eruption of Tolbachik Volcano, Kamchatka, Russia. Journal of Volcanology and Geothermal Research, 307, 22–37.
Belousov, A. B., Belousova, M. G., &Voight, B. (1999). Multiple edifice failures, debris avalanches and associated eruptions in the Holocene history of Shiveluch volcano, Kamchatka, Russia. Bulletin of Volcanology, 61, 324–342.