HAL Id: hal-01503611
https://hal.archives-ouvertes.fr/hal-01503611
Submitted on 7 Apr 2017
HAL is a multi-disciplinary open access
archive for the deposit and dissemination of
sci-entific research documents, whether they are
pub-lished or not. The documents may come from
teaching and research institutions in France or
abroad, or from public or private research centers.
L’archive ouverte pluridisciplinaire HAL, est
destinée au dépôt et à la diffusion de documents
scientifiques de niveau recherche, publiés ou non,
émanant des établissements d’enseignement et de
recherche français ou étrangers, des laboratoires
publics ou privés.
Authigenic 10Be/9Be ratio signature of the
Matuyama-Brunhes boundary in the Montalbano Jonico
marine succession
Quentin Simon, Didier Bourles, Franck Bassinot, Sébastien Nomade, Maria
Marino, Neri Ciaranfi, Angela Girone, Patrizia Maiorano, Nicolas Thouveny,
Sandrine Choy, et al.
To cite this version:
Quentin Simon, Didier Bourles, Franck Bassinot, Sébastien Nomade, Maria Marino, et al..
Au-thigenic 10Be/9Be ratio signature of the Matuyama-Brunhes boundary in the Montalbano
Jon-ico marine succession.
Earth and Planetary Science Letters, Elsevier, 2017, 460, pp.255-267.
Contents lists available atScienceDirect
Earth
and
Planetary
Science
Letters
www.elsevier.com/locate/epsl
Authigenic
10
Be/
9
Be
ratio
signature
of
the
Matuyama–Brunhes
boundary
in
the
Montalbano
Jonico
marine
succession
Quentin Simon
a,
b,
∗
,
Didier
L. Bourlès
a,
Franck Bassinot
c,
Sébastien Nomade
c,
Maria Marino
d,
Neri Ciaranfi
d,
Angela Girone
d,
Patrizia Maiorano
d,
Nicolas Thouveny
a,
Sandrine Choy
a,
b,
Fabien Dewilde
c,
Vincent Scao
c,
Gulay Isguder
c,
Dominique Blamart
c,
ASTER
Team
a,
1aCEREGEUM34,AixMarseilleUniv,CNRS,IRD,CollFrance,AixenProvence,France bIPGP,UniversitéParisDiderot,SorbonneParis-Cité,UMR7154CNRS,75238Paris,France
cLaboratoiredesSciencesduClimatetdeL’Environnement,UMR8212,LSCE/IPSL,CEA-CNRS-UVSQandUniversitéParis-Saclay,Gif-Sur-Yvette,France dDepartmentofEarthandGeoenvironmentalScience,UniversityofBariAldoMoro,E.Orabona4,70125Bari,Italy
a
r
t
i
c
l
e
i
n
f
o
a
b
s
t
r
a
c
t
Articlehistory:
Received2August2016
Receivedinrevisedform8November2016 Accepted28November2016
Availableonline15December2016 Editor:M.Frank
Keywords:
10Becosmogenicnuclide
authigenic10Be/9Beratio
Matuyama–BrunhesBoundary(MBB) high-resolutionoxygenisotopestratigraphy MIS19
GSSPstratotype
Geomagneticdipole moment(GDM)lowsassociatedwithpolarityreversalsorgeomagneticexcursions induce significantmodulation of the cosmogenic nuclide Beryllium-10 (10Be) production. Hence,the reconstructionofatmospheric10Beproductionratesfromnaturalarchivessuchasmarinesedimentary
sequences or ice cores constitutes a complementary approach, independent from paleomagnetic measurements, to decipher past GDM fluctuations.This is particularly important in the Montalbano Jonico succession(SouthItaly)since itis candidatetohost theGlobalStratotypeSection andPointof theMiddlePleistoceneStagebutwherethemagnetostratigraphicpositioningoftheMatuyama–Brunhes boundary (MBB) has not been available up to now. Thisstudy presents (1) original authigenic 10Be cosmogenicnuclideand9Bestableisotoperesults,and(2)newhigh-resolutionbenthic oxygenisotope
recordcoveringterminationIXandMarineIsotopeStage(MIS)19.Arobustchronologicalframeworkis establishedonthebasisof(i)ouroxygenisotopestratigraphy,usingthestronganalogiesbetweenMIS 1andMIS19cintermsoforbitalforcingandCO2level,and(ii)oneprecise40Ar/39Ardateobtainedin
the tephralayer V4.Theauthigenic 10Be/9Be ratiorecordmarksthe atmospheric10Beoverproduction
linkedtothedipolelowaccompanyingtheMBBtransition,withacharacteristictwofoldincreaseofthe
10Beproductionatthe endofMIS19candearly MIS19b.Thissignature issimilar tothosedescribed
inbothmarineandicecorerecords.The detailedchronostratigraphyconstrainedbya radiometrically-datedtephralayer(773.9±1.3 ka)withintheMBBinterval,makes itpossibletodiscussthestructure and toassess the timingof the 10Be-production changes, and thus the MBB geomagnetic variations,
with an unprecedented accuracy for a marine archive (sedimentation rates ∼80 cm/ka).These new cosmogenic nuclide productionsignatures provide the only missing constraint required for retaining the MontalbanoJonico succession as aglobal-scalecorrelation reference sectionfor the Early–Middle Pleistoceneboundary.
©2016TheAuthor(s).PublishedbyElsevierB.V.ThisisanopenaccessarticleundertheCCBY-NC-ND license(http://creativecommons.org/licenses/by-nc-nd/4.0/).
1. Introduction
Theidentificationofthemostrecognizablechronostratigraphic
marker in weathered continental deposits and in marine
sed-imentary sequences: the Matuyama–Brunhes boundary (MBB),
the last geomagnetic reversal, is a primary criterion for defining
*
Correspondingauthor.E-mailaddress:simon@cerege.fr(Q. Simon).
1 GeorgesAumaître,KarimKeddadouche.
theEarly–MiddlePleistoceneboundary.Alongwithpaleomagnetic measurements, analysis of the meteoric cosmogenic radionuclide beryllium-10 (10Be) in natural archives provides robust informa-tiononthegeomagneticdipolemoment(GDM)variationsthrough anon-linearinverserelationshipbetweenitsatmospheric produc-tion rate and the Earth magnetic field variability (e.g. Masarik and Beer, 2009). The 10Be nuclides are produced in the atmo-sphere by spallation reactions between highly energetic primary (mainly protons(H+) andalphaparticles (4He2+)) andsecondary (mainly neutrons) galactic cosmic ray particles and atmospheric
http://dx.doi.org/10.1016/j.epsl.2016.11.052
0012-821X/©2016TheAuthor(s).PublishedbyElsevierB.V.ThisisanopenaccessarticleundertheCCBY-NC-NDlicense (http://creativecommons.org/licenses/by-nc-nd/4.0/).
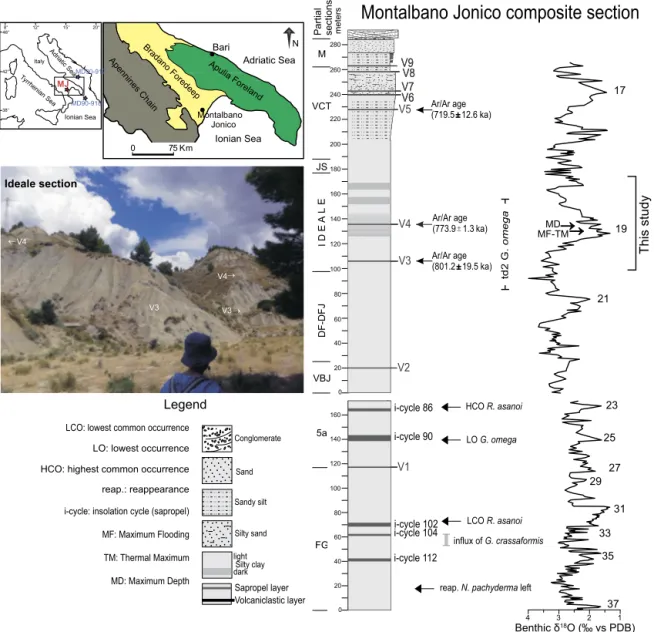
Fig. 1. LocationandlithostratigraphyoftheMontalbanoJonicosuccession(MJS).Mainlithologicalfeaturesofthecompositesectionobtainedbycorrelatingseveralpartial sections(FG-M).Chrono-biostratigraphicconstraintsareshownontherighttogetherwiththebenthicδ18Orecord(Ciaranfi et al., 2010; Maiorano et al., 2010; Girone et al., 2013).MarineIsotopeStagesareaccordingtoCiaranfi et al. (2010).AphotooftheIdealesectionincludingtheV3andV4tephralayersandthelocationofcoreMD90-917 andMD90-918usedfortheagemodelcomparison(seesection5)arealsopresentedonthelefthand-side.
nitrogen and oxygen atoms (Lal and Peters, 1967). The penetra-tion rate of these primary galactic cosmic ray particles into the atmospherevarieswithlatitudeasafunction ofthevertical cut-off rigidity, which quantifies the ability of charged particles to penetratethegeomagneticfield lines.Thus, large10Be-production increasesresultfromalowmagnetosphericshieldingduetoweak GDMstrengthasdemonstratedbynumerousstudiesregarding ge-omagnetic excursions and reversals (e.g. Carcaillet et al., 2003; Muscheleretal.,2005; Raisbecketal.,2006; Knudsenetal.,2008; Christletal.,2010;Ménabréazetal.,2012,2014;Valetetal.,2014; Horiuchietal.,2016;Simonetal.,2016a).
Since the Montalbano Jonico succession (MJS) is candidate to host the Global Stratotype Section andPoint (GSSP) ofthe Mid-dle Pleistocene, the clear recognition and precise positioning of the MBBare requisites because they condition the establishment ofcorrelationsattheglobalscale.Despitethoughtfulstratigraphic andpaleoenvironmentalinvestigationsthatadequatelysatisfymost of the recommendations indicated for a global boundary strato-type, the MJS suffers from an unsuccessful attempt to obtain a reliablemagnetostratigraphy(Sagnottietal.,2010).
In order to satisfy this only missing criterion and provide a direct, reliable and comparable position of the MBB in the MJS, analyses of authigenic 10Be and 9Be isotope concentrations (i.e. fraction dissolved or chemically precipitated and adsorbed onto settling particles)were carried out inthe Ideale section covering Marine Isotope Stages(MIS) 20–19(Fig. 1). Normalization of the authigenic 10Be cosmogenicnuclide by the authigenic 9Be stable isotope releasedfromcontinentalweatheringismandatory in or-der to minimize the environmental disturbances (Bourlès et al., 1989) and compare authigenic 10Be/9Be ratio records with geo-magneticvariability(seereferencesabove).
In this study, we present (1) original authigenic 10Be/9Be ra-tio results with an unprecedented accuracy for a marine archive
given the very high sedimentation rate of the MJS through MIS
20–19,and(2)newhigh-resolutionbenthicoxygenisotoperecord (120–200yearsresolution)fromTerminationIX(T.IXhereafter)to MIS19a.Inadditiontotheprecise40Ar/39Arageofatephralayer (i.e. V4), we use the orbital forcing and CO2 level analogy
be-tween MIS 1 and MIS 19c to fine-tune the new
δ
18O record toorbitaloscillationsandestablisharobustchronologicalframework.
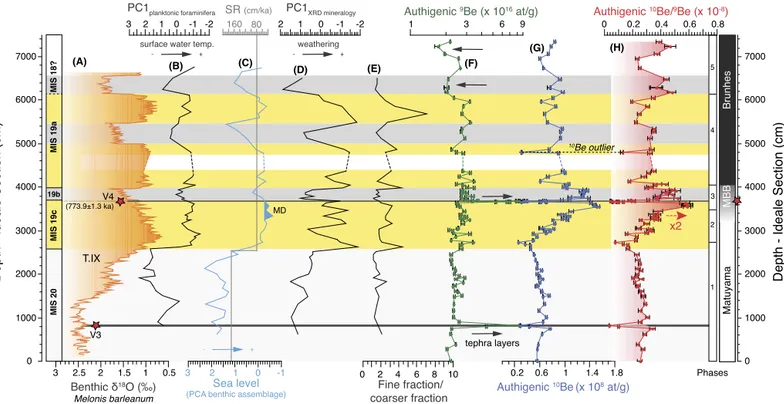
Fig. 2. Paleoenvironmental variationsandauthigenicberylliumisotopesresults.(A)TheoxygenisotoperecordfrombenthicforaminiferaMelonisbarleanum areexpressedas δ18OvsVPDB(h).Principalcomponentanalysesof(B)planktonicforaminiferataxa,(D)XRDmineralogicalcontentand(E)Finefraction/coarserfractionratio(0–8/>16 μm)
arefromMaiorano et al. (2016).(C)Therelativesealevelcurveisderivedfrombenthicforaminiferaassemblages(Stefanelli, 2003).Maximumdepth(MD)ishighlighted inthefigure.Thesedimentationrate(SR,grayline)ofthe Idealesectionisderivedfromtheagemodelfromthisstudy (seesection5andFig. 4).(F)Authigenic9Be
concentrationspresenttwolargespikescoevalwithtephralayersV4(3660 cm)andV3(820 cm).The10Be(decay-corrected)concentrations(G)andauthigenic10Be/9Be
ratios(H)presentsimilarvariationsdescribedinthetextbydistinctphases(from 1to5).Thesevariationsespeciallyincludeatwofoldincreasewithinthe3550–3950 cm interval(phase 3)associatedwiththeMatuyama–BrunhesBoundary(MBB).Paleoenvironmentalproxies(A–E)yieldcleardistinctionbetweenMarineisotopicstage(MIS)20, TerminationIX(T.IX),andsubstagesofMIS19(a–b–c).Theredstarsandblackbarsindicatethetwotephralocations.(Forinterpretationofthereferencestocolorinthis figurelegend,thereaderisreferredtothewebversionofthisarticle.)
authigenic10Be/9Be ratio(proxy ofatmospheric 10Be production)
changes within the newframe of the marine stable oxygen
iso-topestratigraphy, anddiscusstheir timing andglobalcorrelation. Thisoriginalstudyofthestructureandchronologyofthe10Be pro-ductionrateincreasecorrespondingtotheMBBintheMontalbano marineseries constitutesamajor prerequisite forgeological time scalecalibration.
2. GeologicalsettingoftheMontalbanoJonicoSuccession
TheMontalbano Jonicosuccession(MJS)cropsoutinthe Luca-niaBasin,aminorbasinoftheBradanoForedeep(BradanoTrough,
Casnedi,1988)betweentheApenninesChainandtheApulia Fore-land (Fig. 1). The Bradano Trough was emplaced in the Early Plioceneand underwentsignificant modifications during theLate PlioceneandtheEarlyPleistocene.Itsinner bordermoved north-eastwardwhileits outer marginspreadgradually overthe Apulia Forelandunits(Casnedietal.,1982).TheMJSwasdepositedduring theEarlyandMiddlePleistoceneinan upperslopetoinner shelf setting(Marinoetal.,2015andreferencestherein).Thewhole sec-tionrepresentstheregressivepartofathird-ordercyclewith sev-eralfourthandfifth-ordercyclesmainlydrivenbyclimatechanges (Ciaranfietal.,2010).
ThecompositesectionofMontalbanoJonico,about450 mthick, was reconstructed based onthe study ofseveral sections(FG-M,
Fig. 1), that are well exposed along the left Agri River badland. Itconsists ofupward coarseningdeposits formed by hemipelagic silty clays and, in its upper part, by sandy silts to sands. Nine
tephra layers (V1–V9) are interspersed in the MJS. They were
chemically and mineralogically characterized and correlated to othertephralayers fromsouth-centralItaly lacustrinesuccessions andmarinesequenceswithinaLower–MiddlePleistocene
Mediter-raneantephrostratigraphic frame (Petrosinoetal., 2015).The five sapropelhorizonsidentifiedinthelowerpartofthesection(Fig. 1) were correlated to insolation cyclesi-112, i-104, i-102, i-90, and i-86, in agreement with the Mediterranean sapropel stratigraphy (Ciaranfietal.,2010andreferencestherein).Stableoxygenisotope records (Fig. 1) combined with numerous biostratigraphical con-straints(e.g.calcareousnannofossil,planktonicforaminifera)were usedforastronomicalcalibrationoftheMJS,that coversthetime
interval between MIS 37 and MIS 16, i.e. 1.24 Ma to 0.64 Ma
(Ciaranfi et al., 2010; Marino et al., 2015). The MJS represents
a unique on-land continuous marine succession spanning such a
long time interval and, together with the astronomically tuned Vrica section, covers the entireCalabrian Stage (Maiorano et al., 2010).
3. EnvironmentalandlithologicalchangesintheIdealesection
As part ofthe composite succession, the Ideale section is the one straddlingMIS 19 within the Interval B of the MJS (Fig. 1), andiscandidatetohosttheGSSPoftheMiddlePleistocene(Head andGibbard,2015).This73.5 mthicksectionconsistsofdark-light grey silty clays withintercalated tephra layers V3 andV4. High resolution multidisciplinary studies demonstrated the occurrence ofglacial–interglacialphasesandofrapidcooling/drying episodes indicating(sub)millennial-scale climatevariabilityduringT.IX and overMIS 19(Bertini etal.,2015; Maioranoetal., 2016). TheMIS 19climaticvariabilityisexpressedbythelargeoccurrenceof halo-phyteandsteppetaxaintheIdealesectionduringMIS19b,while
MIS 19a and19c are rathercharacterized by woody and
moder-ate herbaceous taxa (Maiorano et al., 2016). Enhanced chemical
weathering has also been proved to develop in the neighboring
19interval,asindicated bytheprincipalcomponentanalysis per-formedonthemineralogical assemblage(Fig. 2D)andspecifically bya prominentincrease ofthekaolinitecontent(Maioranoetal., 2016). Grain size variations (Fig. 2E) observed through the
sec-tion also match climate phases with increased supply of finer
grain size fraction (mainly clay
<
4 μm and fine silt at the ex-penseofcoarser siltandsand) intothebasin,reflecting the exis-tenceofclimate-inducedtransgressive/regressivephases(Maiorano etal., 2016). Investigationsofmacroinvertebrate palaeocommuni-ties(D’Alessandroetal.,2003) andbenthicforaminifera(Stefanelli etal.,2005) indicateinnerto outershelf environmentswith spo-radictransitiontoupperslope.Therelativepaleodepthvariesfrom about100 mto200 mbetweenMIS20and19(Aielloetal.,2015) withalargerelativesealevel(RSL) risecorrespondingtoT.IXand amaximumdepthinMIS19c(Fig. 2C; D’Alessandroetal., 2003).Two RSL drops are observed along with major climatic changes
duringtheMIS19aoscillations,whileminorRSLvariationsare ob-servedduringMIS19c–b(Fig. 2C).
4. Materialsandmethods
TheIdealesection(Fig. 1)hasbeensampledevery20-cmfrom freshoutcrops afterremoving theuppermost10 cmsurfacelayer. A short interval in the upper part of the section has not been sampledduetovegetationcovering(Fig. 2).Thedepthscaleused in thisstudy is relative to the base of the Ideale section, set as the origin, i.e. 0 cm, that presents an unambiguous stratigraphic marker easily identified in the field (ground level atthe base of theoutcrop,seephotoinFig. 1).
Theauthigenicberylliumisotopeanalyses were carriedouton
103 samples, with variable resolution (from 10 to 280 cm), at
theCEREGENationalCosmogenicNuclides Laboratory(France) ac-cording to the chemical procedure established by Bourlès et al. (1989)andsummarizedbySimonetal. (2016b).Thenatural authi-genic9Be concentrationsweremeasured usingagraphite-furnace
Atomic AbsorptionSpectrophotometer (AAS)with adouble beam
correction(ThermoScientificICE3400®).Theassociated uncertain-ties(2σ)basedonthereproducibilityofquadruplicated
measure-ments andtheleast-square fittingbetweenmeasured absorbance
at each stages of the standard-addition method vary around av-erage values of 1.8%. The natural authigenic 10Be concentration
measurements were performed at the French AMS national
fa-cility ASTER (CEREGE).10Be sample concentrationsare calculated fromthemeasured spiked10Be/9Be ratiosnormalized totheBeO STD-11in-housestandard(1
.
191±
0.
013×
10−11;Braucheretal., 2015), and are decay-corrected using the 10Be half-life (T1/2) of 1.
387±
0.
012 Ma (Chmeleffetal., 2010; Korschineketal., 2010). The precision (from statisticaland instrumental uncertainties) of themeasured10Be/9BeratiosattheAMSvariesaroundanaverage value of2.1%. Theuncertainties (2σ)of thecalculated authigenic 10Be/9Be ratiosare derived fromanalytical errorpropagationand varyaroundanaveragevalueof5.6%(Table 1).Foroxygenstableisotopicstratigraphy,sedimentsweresampled from150to6,630 cm,ata
∼
20cmintervalresolution, represent-ingatotalof322samples.Stableisotopiccompositionswere mea-suredon the benthicforaminifera Melonisbarleanum tests pickedin the 315–355 μm size fractions. The analyses were performed
on a GV-Isoprime dual-inlet gas mass spectrometer at LSCE lab-oratory. All results are expressed as
δ
18O vs VPDB (inh
) with respecttoNBS19standard.Theinternalanalyticalreproducibility determinedfromreplicatemeasurements ofacarbonatestandard is±
0.
05% (1σ).5. Resultsandinterpretations
All authigenic 10Be and 9Be sample concentrations and cor-responding ratios are listed in Table 1. The new
δ
18O results presented inthisstudyare listed insupplementary material (Ta-ble S1).5.1. Authigenic9Be
The 9Be concentrations vary between1.7 and 8
.
4×
1016at/g (mean=
3.
03±
1.
37×
1016at/g). High 9Be concentration values reaching 8.
4×
1016at/g, nearly fourfold higher than the averagerange, are found within, or immediately above, the V3 and V4
tephralayers (Table 1; Figs.2Fand3A).These5and10 cmthick layers,respectively,arecomposedofsiltyyellowishgreysediments with clayey matrixcontaining badly preservedpumice fragments (Petrosinoetal.,2015) originatingfrompyroclasticeruptionsofthe
Vulture stratovolcano(located 100km northwestfrom the
Mon-talbanoJonicoarea,Fig. 3A).Suchunusual9Be-richconcentrations were onlyfound withinthesetwotephra layerssuggestingdirect inputs ofeasily soluble9Be that might be intrinsicinthe tephra particles.Notethatthedistinct9BeconcentrationoftheV5tephra layer(Fig. 3A),locatedabovetheIdealesection(Fig. 1),and chem-icallyclosetotheCampanianvolcanicfield products(Petrosinoet al.,2015) couldsupportaprovenanceinfluence.
No high 9Be concentrations are observed prior to the tephra deposition,whilehigh9Bevaluesonlyspanalimited20 cmthick interval (Fig. 3B), mostlikelydeposited within fewyears/decades following the V4 eruptive event. This supports: i) the low
geo-chemical mobility behavior of Be isotopes once scavenged onto
particlesanddepositedwithinthesedimentarycolumnand,ii)the limitedbioturbationmixingmainlyduetoveryhighsedimentation rates(Ciaranfietal.,2010).
Theauthigenic9BeinputsassociatedwithtephralayersV3and V4 arerelatedto directmantle inputsand/or verydense particle environmentsfollowingthefalloutofpyroclasticflow,contributing to modify drastically the concentrations, scavengingrates and/or mixingofdissolvedBeinthewatercolumn.Thus,itseems reason-able to excludethe tephra layers fromthegeomagnetic 10Be/9Be ratiointerpretationgiventhepeculiargeochemicalbehaviorof dis-solvedBeisotopeswithinthesespecificintervals(Figs. 2Fand3).
Outside thetephralayers,9Beconcentration variationsare rel-atively stable throughout the record ranging from 1.7 to 3
.
5×
1016at/g, with an average value of 2.
59±
0.
36×
1016at/g. Twolow 9Be concentration values at 6,190–6,290 cm and 7,240 cm
(Fig. 2F)correspondtomajorchangesindetritalinputs(Fig. 2D–E) associatedwiththeMIS19aabrupt
δ
18OoscillationsorMIS18 in-ception(Fig. 2A).5.2. Authigenic10Be
Theauthigenic10Be(decay-corrected)concentrationsvaryfrom 0.26 to 1
.
54×
108 at/g with an average value of 0.
77±
0.
30×
108 at/g. In contrast with 9Be variation, the 10Be concentrationspresent clear fluctuations within the sequence, which can be
grouped into five phases (Fig. 2G). From 0 to 2,730 cm depth
(phase 1), the 10Be concentrations havea meanvalue of 0
.
58±
0.
29×
108at/g and slightlydecreasetowarda minimum concen-tration of0.
26×
108 at/g at2,730 cm.Then, the10Be concentra-tionsincreaserapidlyto1.
10×
108 at/g at3,455cmdepth(phase 2).Withinthe3,550–3,950cminterval(phase3),the10Be concen-trations are maximal with an average of 1.
35±
0.
12×
108 at/g,nearly doubling the average value of the prior interval (mean
0
.
67×
108 at/g).Insidethat500 cmthicklayer,the3,659–3,730cm intervalyieldsasignificantdropin10Beconcentration correspond-ingtosedimentsdepositedimmediatelyabovetheV4tephralayerTable 1
AMSmeasurements,authigenic10Beand9Beconcentrationandauthigenic10Be/9BeratiooftheIdealesectionfromtheMontalbanoJonicosuccession.
Sample codes DepthMJS composite (m) DepthIdeale section (cm) Agemodel (ka) Sampleweight [g] Measured (10Be/9Be) ∗10−11 Authigenicdecay corrected10Be∗108 [at·g−1] Authigenic 9Be∗1016 [at·g−1] Authigenic 10Be/9Be ∗10−8 v5 227.60 12990 657.3 1.0014 0.01±0.000 0.04±0.00 3.35±0.07 0.01±0.00 NC431 171.10 7340 727.9 1.0039 0.27±0.005 0.84±0.02 2.17±0.03 0.39±0.02 NC430 170.10 7240 729.2 0.9991 0.25±0.005 0.79±0.02 1.69±0.07 0.47±0.04 NC427 168.30 7060 731.4 0.6946 0.16±0.003 0.74±0.02 1.97±0.02 0.37±0.02 NC426 167.20 6950 732.8 1.0007 0.19±0.005 0.60±0.02 2.56±0.03 0.23±0.01 NC424 165.10 6740 735.4 1.0031 0.21±0.004 0.65±0.01 2.64±0.01 0.25±0.01 NC421 162.60 6490 738.5 0.9999 0.30±0.006 0.92±0.02 2.09±0.02 0.44±0.02 NC419’ 160.60 6290 741.0 1.0036 0.24±0.012 0.75±0.04 2.04±0.09 0.37±0.05 NC419 160.60 6290 741.0 1.0036 0.24±0.007 0.75±0.02 2.04±0.09 0.37±0.04 NC418 159.60 6190 742.3 1.0015 0.32±0.006 0.97±0.02 2.03±0.06 0.48±0.03 NC417 158.30 6060 743.9 0.9159 0.24±0.005 0.81±0.02 2.33±0.02 0.35±0.02 NC416 157.30 5960 745.2 1.0010 0.20±0.004 0.62±0.01 3.19±0.01 0.19±0.01 NC415 156.30 5860 746.4 0.9993 0.28±0.005 0.86±0.01 2.81±0.02 0.31±0.01 NC413 154.60 5690 748.5 0.5365 0.12±0.003 0.67±0.01 2.74±0.06 0.25±0.01 NC411 152.60 5490 751.0 1.0004 0.23±0.004 0.72±0.01 3.22±0.03 0.22±0.01 NC409 151.10 5340 752.9 1.0033 0.31±0.005 0.96±0.02 2.72±0.03 0.35±0.02 NC408 150.40 5270 753.8 1.0008 0.30±0.005 0.93±0.02 2.67±0.04 0.35±0.02 NC407 148.90 5120 755.7 1.0013 0.30±0.005 0.93±0.02 2.90±0.05 0.32±0.02 NC404 146.40 4870 758.8 1.0005 0.24±0.005 0.75±0.01 2.23±0.02 0.34±0.01 NCJ34 145.80 4810 759.5 0.9997 0.10±0.003 0.31±0.01 2.46±0.05 0.12±0.01 NC403 145.60 4790 759.8 1.0032 0.30±0.005 0.90±0.01 2.80±0.07 0.32±0.02 NC402 141.40 4370 765.0 1.0010 0.31±0.007 0.97±0.02 2.78±0.03 0.35±0.02 NC401 140.95 4325 765.6 1.0025 0.32±0.005 1.01±0.02 3.22±0.04 0.31±0.01 NC400 140.20 4250 766.5 0.5175 0.12±0.003 0.73±0.02 2.58±0.05 0.28±0.02 NC322 139.10 4140 767.9 1.0013 0.19±0.004 0.61±0.01 3.45±0.05 0.18±0.01 NC320 138.50 4080 768.7 1.0012 0.34±0.006 1.06±0.02 2.46±0.05 0.43±0.02 NC319 138.25 4055 769.0 1.0013 0.32±0.006 1.00±0.02 2.77±0.03 0.36±0.01 NC317 137.80 4010 769.5 1.0015 0.31±0.006 0.97±0.02 3.01±0.08 0.32±0.02 NC316 137.50 3980 769.9 1.0020 0.33±0.006 1.03±0.02 3.45±0.06 0.30±0.01 NC315 137.20 3950 770.3 1.0017 0.42±0.009 1.32±0.03 2.76±0.02 0.48±0.02 NC314 137.00 3930 770.5 0.9998 0.43±0.007 1.36±0.02 2.70±0.08 0.50±0.03 NC313 136.70 3900 770.9 1.0009 0.40±0.007 1.25±0.02 2.80±0.02 0.45±0.02 NC312 136.40 3870 771.3 1.0019 0.42±0.007 1.30±0.02 3.01±0.08 0.43±0.03 NC311 136.05 3835 771.7 1.0014 0.41±0.008 1.29±0.03 2.70±0.04 0.48±0.02 NC310 135.65 3795 772.2 1.0010 0.41±0.008 1.28±0.02 3.39±0.07 0.38±0.02 NC309 135.45 3775 772.5 1.0020 0.34±0.009 1.08±0.03 2.94±0.06 0.37±0.02 NC308 135.20 3750 772.8 1.0035 0.44±0.007 1.39±0.02 2.68±0.04 0.52±0.02 NC307 135.00 3730 773.0 1.0017 0.34±0.007 1.08±0.02 2.92±0.06 0.37±0.02 MJ-XXII-4 134.85 3715 773.2 1.0014 0.30±0.006 0.95±0.02 3.08±0.02 0.31±0.01 MJ-XXII-3 134.67 3697 773.4 1.0005 0.21±0.006 0.66±0.02 3.72±0.07 0.18±0.01 NC306 134.55 3685 773.6 1.0013 0.22±0.005 0.69±0.01 3.34±0.06 0.21±0.01 MJ-XXII-2 134.48 3678 773.7 0.9994 0.11±0.004 0.34±0.01 7.97±0.19 0.04±0.00 MJ-XXII-2’ 134.48 3678 773.7 1.0013 0.11±0.004 0.35±0.01 8.06±0.21 0.04±0.00 MJ-XXII-2” 134.48 3678 773.7 1.0002 0.13±0.003 0.40±0.01 8.44±0.09 0.05±0.00 v4 134.30 3660 773.9 1.0005 0.10±0.002 0.30±0.01 5.28±0.11 0.06±0.00 MJ-XXII-1 134.30 3660 773.9 1.0004 0.19±0.004 0.60±0.01 6.82±0.11 0.09±0.00 MJ-XXII-1’ 134.30 3660 773.9 1.0020 0.20±0.004 0.62±0.01 6.61±0.12 0.09±0.00 MJ-XXII-1 134.30 3660 773.9 0.9997 0.23±0.004 0.71±0.01 6.97±0.09 0.10±0.00 MJ-XXI-5 134.29 3659 773.9 1.0007 0.22±0.004 0.70±0.01 5.25±0.04 0.13±0.01 NC304 134.20 3650 774.0 1.0020 0.45±0.008 1.41±0.02 2.48±0.07 0.57±0.04 NC303 133.80 3610 774.5 1.0004 0.47±0.008 1.47±0.03 2.50±0.06 0.59±0.04 NC302 133.50 3580 774.9 1.0010 0.47±0.008 1.47±0.02 2.51±0.07 0.59±0.04 NC301 133.20 3550 775.3 1.0010 0.49±0.008 1.54±0.02 2.63±0.04 0.58±0.03 NC298 132.25 3455 776.5 1.0014 0.35±0.012 1.10±0.04 2.88±0.07 0.38±0.03 NC295 131.45 3375 777.5 1.0013 0.32±0.006 1.00±0.02 2.64±0.05 0.38±0.02 MJ-XIX-4 131.44 3374 777.5 1.0003 0.29±0.011 0.92±0.03 2.66±0.07 0.34±0.03 NC293 131.00 3330 778.0 1.0016 0.34±0.006 1.07±0.02 2.85±0.03 0.37±0.01 MJ-XIX-1 130.89 3319 778.2 1.0000 0.33±0.008 1.05±0.02 3.00±0.08 0.35±0.02 MJ-XVIII-7 130.70 3300 778.4 1.0010 0.31±0.006 0.97±0.02 2.63±0.06 0.37±0.02 MJ-XVIII-6 130.51 3281 778.6 1.0005 0.30±0.006 0.96±0.02 2.76±0.05 0.35±0.02 NC290 130.30 3260 778.9 1.0023 0.33±0.006 1.04±0.02 2.76±0.08 0.38±0.03 NC289 130.15 3245 779.1 1.0016 0.26±0.005 0.81±0.02 3.18±0.03 0.26±0.01 NC285 129.45 3175 780.0 1.0033 0.27±0.005 0.84±0.01 2.79±0.08 0.30±0.02 NC280 128.30 3060 781.4 1.0006 0.20±0.008 0.61±0.03 2.55±0.02 0.24±0.02 NC280’ 128.30 3060 781.4 1.0006 0.20±0.006 0.62±0.02 2.55±0.02 0.24±0.02 NC278 128.20 3050 781.5 1.0024 0.26±0.006 0.83±0.02 2.51±0.03 0.33±0.02 NC276 127.90 3020 781.9 1.0019 0.21±0.004 0.67±0.01 2.14±0.04 0.31±0.02 NC274 127.60 2990 782.3 0.9997 0.24±0.004 0.76±0.01 2.27±0.05 0.34±0.02 NC273 127.30 2960 782.7 0.9999 0.22±0.004 0.70±0.01 2.31±0.03 0.30±0.01 NC271 127.00 2930 783.0 0.9993 0.16±0.003 0.49±0.01 3.19±0.08 0.15±0.01 NC265 126.40 2870 783.8 1.0011 0.18±0.004 0.56±0.01 2.42±0.03 0.23±0.01 NC260a 125.50 2780 784.9 1.0008 0.16±0.003 0.49±0.01 2.22±0.02 0.22±0.01 NC258a 125.00 2730 785.41 1.0035 0.08±0.002 0.26±0.01 3.39±0.05 0.08±0.00 (continued on next page)
Table 1 (continued) Sample codes DepthMJS composite (m) DepthIdeale section (cm) Agemodel (ka) Sampleweight [g] Measured (10Be/9Be) ∗10−11 Authigenicdecay corrected10Be∗108 [at·g−1] Authigenic 9Be∗1016 [at·g−1] Authigenic 10Be/9Be ∗10−8 NC257 124.70 2700 785.59 1.0013 0.12±0.003 0.36±0.01 2.73±0.01 0.13±0.01 NC256a 124.40 2670 785.77 1.0011 0.14±0.003 0.44±0.01 2.66±0.05 0.17±0.01 NC253c 123.60 2590 786.24 1.0022 0.14±0.003 0.45±0.01 2.69±0.08 0.17±0.01 NC250c 122.30 2460 787.01 1.0025 0.16±0.003 0.50±0.01 2.21±0.06 0.23±0.02 NC246 121.05 2335 787.74 1.0023 0.17±0.003 0.53±0.01 2.23±0.06 0.24±0.02 NC243 120.15 2245 788.27 0.9996 0.18±0.004 0.56±0.01 2.23±0.02 0.25±0.01 NC239 119.10 2140 788.89 1.0011 0.18±0.003 0.55±0.01 2.35±0.05 0.24±0.01 NC236 118.60 2090 789.19 1.0007 0.20±0.004 0.63±0.01 2.42±0.04 0.26±0.01 NC231 117.70 2000 789.72 1.0002 0.18±0.004 0.56±0.01 2.37±0.05 0.24±0.01 NC228 117.30 1960 789.96 0.9997 0.19±0.004 0.60±0.01 2.60±0.04 0.23±0.01 NC226 116.90 1920 790.19 0.9987 0.19±0.003 0.58±0.01 2.89±0.06 0.20±0.01 NC225 116.60 1890 790.37 1.0030 0.21±0.004 0.64±0.01 2.43±0.06 0.27±0.02 NC219 115.80 1810 790.84 1.0017 0.19±0.004 0.60±0.01 2.81±0.03 0.21±0.01 NC217s 115.25 1755 791.17 1.0017 0.18±0.004 0.57±0.01 2.37±0.06 0.24±0.02 NC215 115.00 1730 791.31 1.0007 0.17±0.003 0.53±0.01 2.29±0.01 0.23±0.01 NC208 113.95 1625 791.93 0.9998 0.20±0.004 0.63±0.01 2.42±0.06 0.26±0.02 NC206 113.70 1600 792.08 1.0010 0.20±0.004 0.63±0.01 2.53±0.02 0.25±0.01 NC201s 112.85 1515 792.58 0.9992 0.24±0.004 0.75±0.01 2.74±0.04 0.27±0.01 NC199 112.60 1490 792.73 1.0010 0.21±0.004 0.65±0.01 2.37±0.06 0.27±0.02 NC191 110.90 1320 793.73 0.9997 0.21±0.004 0.68±0.01 2.33±0.02 0.29±0.01 NC186 109.40 1170 794.62 1.0016 0.19±0.004 0.59±0.01 2.31±0.04 0.25±0.01 NC179 107.90 1020 795.50 1.0004 0.23±0.004 0.71±0.01 2.31±0.04 0.31±0.01 NC174 106.80 910 796.15 1.0013 0.21±0.004 0.65±0.01 2.59±0.05 0.25±0.01 v3 105.80 820 796.68 1.0017 0.09±0.002 0.29±0.01 8.39±0.05 0.03±0.00 MJE-4 105.70 810 796.74 1.0003 0.14±0.003 0.43±0.01 4.39±0.06 0.10±0.01 NC168 105.10 750 797.10 1.0007 0.25±0.005 0.77±0.01 2.24±0.05 0.34±0.02 NC161 103.90 630 797.80 1.0001 0.20±0.004 0.64±0.01 2.20±0.03 0.29±0.01 NC150 101.45 385 799.25 1.0006 0.18±0.003 0.58±0.01 2.43±0.03 0.24±0.01 NC145 100.40 280 799.87 1.0000 0.18±0.003 0.56±0.01 2.05±0.03 0.27±0.01 DFJ74 97.60 0 801.52 1.0015 0.17±0.004 0.55±0.01 2.20±0.05 0.25±0.02 Mean±std. Dev. 0.24±0.10 0.77±0.30 3.03±1.37 0.29±0.13
Fig. 3. AuthigenicBeisotopesignaturewithinthetephralayers.Resultsarepresentedondepthrelativetotephralayers.Negative(positive)valuesareforthedepthbefore (after)thetephralayerdeposition.(A)Authigenic9BeconcentrationofV3–V4–V5tephralayers.The9BesignatureforV3(orangediamonds)andV4(greencircle)presents
similarspikes,while9BeconcentrationfortheV5sample(bluesquare)issignificantlylower.(B)Resultsof10Be(blue),9Be(green)and10Be/9Beratio(red)aboveandbelow
theV4tephralayer.Thetotaldepthintervalrepresentsa3kadurationperiod.High9Beconcentrationscoevalwithsharp10Beand10Be/9Beratiodecreasesarefoundwithin,
andimmediatelyabove,thetephralayerprecludinganygeomagneticinterpretationofthe10Be/9Beratiointhisspecificlayer(highlightedbygreybar).(Forinterpretation
(Fig. 3B). This specific interval is arguably associated with erup-tionandpost-eruptionBe scavengingcondition changes and10Be dilutionby the rapidtephra deposition,not directly relatedwith atmospheric10Be productionchanges. Moreover, thecoarse grain size depictedby relatively highsand percentages inthis interval (Fig. 2E) likely resultsin lower scavengingefficiencyof dissolved 10Be(Simonetal.,2016b).Abovethisinterval,the10Be concentra-tionsvary aroundan average of0
.
84±
0.
20×
108 at/g (phases4 and5)exceptforoneoutlierat4,810 cmthatpresentsaverylow valueof0.
31×
108at/g.5.3.Authigenic10Be/9Beratio
The authigenic10Be/9Be ratios varybetween 0.04 and 0
.
59×
10−8 withan averagevalueof0.
29±
0.
13×
10−8 (Fig. 2H).Such lowaverage10Be/9Beratios(<
1×
10−8)correspondtotypical val-ues for environments experiencing high terrigenous inputs (e.g.Brownetal., 1992; Simonetal.,2016b).The10Be/9Beratiocurve mimics the 10Be variation mainly characterized by a major en-hancementinterval (phase 3). Withinphase 1, the10Be/9Be ratio hasa mean value of 0
.
24±
0.
05×
10−8 and smoothly decrease to 0.
08×
10−8. This period is followed by a rather constant in-creasesofthe10Be/9Be ratio(phase2)thatstabilizedtoaplateau at0.
37±
0.
01×
10−8withinthe3,260–3,455 cminterval.The high-est10Be/9Beratioscorresponding tomaximalvaluesoftheIdeale sectionpeakat0.
58±
0.
01×
10−8 withinthe3,550–3,650 cm in-terval (Fig. 2H). This represents a near doubling of the 10Be/9Be ratio compared to the preceding interval (0.
26×
10−8 from 0 to 3,455 cm). Thatsequence is followed by a sharp drop of the 10Be/9Beratios(0.
20±
0.
16×
10−8)associatedwithsediments de-positedduring andimmediatelyafterthe V4event(Figs.2H and3B).Thisnearcollapseofthe10Be/9Beratiowithinthisshort inter-valcoincideswithharshgeochemicalconditionchangesassociated with the tephra layer deposition (see above). The interval from 3,750to3,950 cmcompriseshigh10Be/9Beratioswithmeanvalue of 0
.
45±
0.
06×
10−8.Altogether, when removing the layer dis-turbedbythetephrasignal,thehighest10Be/9Beratiovaluesfrom theIdeale section, i.e. 0.
50±
0.
08×
10−8, are found intwo dis-tinctstagesbetween3,550and3,950 cm(phase 3).From3,980to 6,060 cm,phase 4,the authigenic10Be/9Be ratios returnto aver-agemean0.
30±
0.
07×
10−8,slightlyhigherthanthoserecorded before the major enhancement of phase 3. The 10Be/9Be ratiosexperienced some fluctuation and two sharp lows at 4,140 and
4,810 cmdepth.Phase5starting at6,060 cmischaracterized by two10Be/9Beratioincreases(Fig. 2H).Thesepeaksarenotpresent inthe 10Be signal but clearly correspond to two significant 9 Be-lows(Fig. 2F) associated withperiod of enhanced erosional pro-cessesoncarbonate(dolomitic)andareniticbedrockunits,coarser grainsizefractionsupply(Fig. 2E)andcoccolithreworking during coldperiods(Maioranoetal.,2016).A clearerpictureofthose en-vironmentalchangesattheendofMIS19atoMIS18transitionis requestedinordertosettlethisconundrumandtoproposerobust geomagneticinterpretationofthe10Be/9Beratios(Fig. 2H).Except forthisspecificinterval, theabsenceofcorrelation with environ-mentalproxiesorsealevelchanges(Fig. 2andTableS2)supports geomagneticinterpretationoftheauthigenic10Be/9Beratio fluctu-ationsintheIdealesection.
5.4.Stableisotopicstratigraphy
TheMelonisbarleanum
δ
18Odatavarybetween∼
0.6and2.
6h
(Fig. 2A).TheyprovideamarineisotopicrecordoftheT.IXandof theMIS19structureatanunprecedentedaveragetime-resolution of∼
120–250years(seesection6).Thedeglaciationis16m-thick, takingplacebetween1,240 and2,860 cm.Itcorresponds toa de-creaseofnearly2h
oftheδ
18Ovalues,whichrangefrom∼
2.
6h
,atthe glacial maximum,to
∼
0.
6h
at thepeak of MIS 19c. It is noteworthythatthedeglaciationischaracterizedbyaclearreturn tomoreglacialconditionsbetween1,900and2,200 cm,astructure thatcloselyresemblestheYoungerDryasepisodeofTerminationI (T.I; Fig. 2A). Paleotemperature reconstructions are mandatory to disentanglethebenthicδ
18Osignalanddecipherwhetherthis re-turn to more glacial valueswas chieflydue to a drop inmarine temperature as suggested by planktonic foraminifera assemblage (Fig. 2B),oranincreaseinseawaterδ
18O.From the peak value of MIS 19c, at
∼
2,860 cm, theben-thic
δ
18Orecordshowsaratherprogressiveincreaseupwardwith minor scale oscillations until about 3,960 cm, where it reaches∼
1.
8h
. Then, theδ
18O record shows an extremely abrupt de-crease, with values dropping by more than 0.
7h
(from 1.83 to 1.
10h
) inonly40 cm,andby∼
1h
inone meter(Fig. 2A). This abruptshiftmarksthebeginningoftheupperintervalofour sam-pled section, which is characterized by relatively stable intervals with lowδ
18O values (suggesting a return to interglacial condi-tions), limitedby extremelyabruptδ
18Ochanges at their onsets andterminations.Twosuchepisodesareclearlyvisibleinourδ
18O record (over the intervals 3,994–4,987 cm, and 5,500–6,110 cm, respectively). The abruptδ
18O decrease at the upper end of the sampledintervalsuggeststhatathirdepisodemayexistabove it, a hypothesis that will be tested in the future by extending the high-resolutionrecordupward.At the abrupt onsets and ends of these warm intervals, our
data suggest that seawater
δ
18O may have changed by up to0
.
5h
or temperature may have changed by up to 2◦C over noless than 250 years (see discussion about age model, below).
Thosechangeswerelikelyconnectedtotheabruptoscillations ob-served in the isotopic record of the Sulmona paleolake (Central Italy), which were attributed to changes in the lake hydrologi-cal budget (Giacco et al., 2015). Those oscillations resemble the rapid oscillations observed in the
δ
18O record from MIS 19a in the North Atlantic (Channell et al., 2010; Ferretti et al., 2015; SánchezGoñietal.,2016) orintheδ
D andCH4recordsfromEPICA DomeC(Poletal.,2010).Significantcorrelationsofournewδ
18O record with micropaleontological proxies, mineralogy, grain size and relative sea level variations (Fig. 2; Table S2) (see Maiorano etal.,2016fordetails),clearlyconcurwiththeoccurrenceoflarge climatecyclesduringtheMIS19a(seesection3).The exact pale-oclimaticimplicationofthenewMontalbano record isout ofthe scope of the presentwork and will be addressed ina dedicated paperinpreparation.6. ChronologicalframeworkfortheMontalbanoJonicoMIS19 sequence
ThechronologicalframeworkoftheIdealesectiondiscussedin previousstudiesismainlybasedontwo40Ar/39Arages(Petrosino et al., 2015) together with a slight tuning of the low-resolution benthic
δ
18Orecord(Fig. 1;Marinoetal.,2015)totheLR04 ben-thic stack of Lisiecki and Raymo (2005). However, the large V3 analytical uncertainty (i.e.±
19.5 ka) clearly questions the rele-vanceof usingtheV3 ageasan accurate tie point toestablisha precise chronologicalframework. Moreover, thetuning ofbenthicδ
18Orecord withglobalstack suchasthe LR04 neglects regional differences of several thousand years during glacial terminations (Lisieckiand Stern,2016) potentially generating large deviations. Inthisstudy,weproposeanoriginalchronologicaltemplateusing amixastronomicalandradiometricapproachinordertoovercome theselimitations.Wehavefirstcreateda
δ
18Ostackbasedontwohigh-resolutionMIS 1/T.I records recovered close to the Montalbano sequence
(Fig. 1), i.e. MD90-917 (Siani etal., 2004) and MD90-918 (Caron et al., 2012), and for which age models are based on
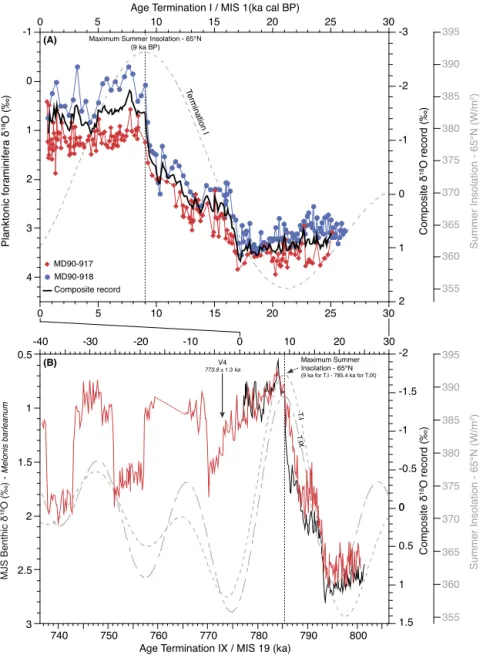
radiocar-Fig. 4. ChronologicalframeworkoftheIdealesection.(A)TerminationI/MIS1planktonicδ18Ostackfromnearbymarinecores(MD90-917andMD90-918, seetextfor
details).(B)High-resolutionbenthicδ18OrecordofTerminationIX(T.IX)fromtheIdealesection(redcurve)fine-tunedtotheTerminationI(T.I)planktonicδ18Ostack(black
curve),assumingsimilarorbitalforcingandCO2levelsbetweenT.IandT.IX(seetext),andadjustedusingtheV4radiometricdate(Petrosino et al., 2015).Summerinsolation
(JAS)isfromLaskar et al. (2004).(Forinterpretationofthereferencestocolorinthisfigurelegend,thereaderisreferredtothewebversionofthisarticle.) bondates.Thisregional stackconfirmedthatthe summer
insola-tion maximum (65◦N; Laskar etal., 2004; i.e. 9 ka) is in phase with the deglaciation (Fig. 4A). Then, we used the similarity of orbital forcing (i.e.precession minimum andobliquity maximum in phase, low eccentricity) andCO2 levels between the two MIS 1 and MIS 19c periods (Pol et al., 2010; Tzedakis et al., 2012; Giacco et al., 2015; Bereiter et al., 2015; Ferretti et al., 2015; Yin andBerger, 2015) as benchmark tolimit the hypotheses un-derlying theastrochronologicalapproach(leadsandlagswiththe orbital forcing).We assume that similarphase relationships exist between the summer insolation curve (65◦N) and the
δ
18Ore-sponse to adjust T.IX with T.I. We used the peak of maximum
isolation(i.e. 785.4 ka)associatedwiththe T.IXthat isequivalent to9 kaforT.I(Fig. 4B)tosynchronizebothterminations.Thebest fitbetweenT.IX andT.I intermofstructureandduration isthus achievedusingameansedimentationrateof170cm/ka(Fig. 4B). Weextrapolateddownwardthissedimentationratetoestablishthe late MIS 20chronology. Thismethodgives aV3 ageof 796.6 ka, whichis4.6 kayoungerthanthe40Ar/39ArageofPetrosinoetal. (2015),butwellwithinitsuncertainty(Table S3).
FollowingtheonsetofMIS19c,thechronologyissettledby lin-ear interpolationusingtheageofV4at773.9 ka(Petrosinoetal., 2015).Thischoiceisjustifiedbyallrecent40Ar/39Arcalibration re-sultspointingtowardACsagescloseto1.185Ma(Jichaetal.,2016; Niespolo etal., 2016) that endorsesthe robustnessof theV4age of Petrosino et al. (2015) (Table S3). The derived sedimentation rate (i.e. 80 cm/ka) is then extrapolatedonward (Fig. 2C) to set uptheMIS19achronology(Fig. 4B).Thischronologicalframework places theredintervalidentifiedintheMJS asa“ghost sapropel” (Maioranoetal.,2016) at784 ka,synchronouswiththei-cycle74 fromtheIonianSeacoreKC01b(Lourens,2004).ItyieldsaMIS19c duration of
∼
11.2 ka, inagreementwiththeduration ofMIS19c recordedinthelacustrineSulmonasection(i.e.10.8 ka;Giaccioet al., 2015) orimplied by NorthAtlantic records(i.e.10.5–12.5 ka;Tzedakis et al., 2012). Although we recognize that the extrapo-lation above V4 is probably an oversimplified solution and that sedimentation rates might have varied correspondingly with the largeMIS19aoscillations(Fig. 2),ournewchronologyplaces ade-quatelythetwostableMIS19a“interglacials”characterizedbylow
The completion of the ongoing high-resolution
δ
18O record willcontribute to propose (or confirm) a more robust chronological
frameworkfortheupperpartoftheIdealesectioninthenear fu-ture.Notethattheresolutionofouragemodelissolidwithinthe MBBinterval,thankstothestratigraphicalpositionandageofV4.
7.Discussion
7.1.IdentificationandchronostratigraphicpositionoftheMBB
Detailedauthigenic10Be/9Beratioresultsobtainedfroman av-eraged26 cmsample spacing(
∼
325 years) alongthe MIS 19c–b interval from the Ideale section are described by the succession ofseveralphasesbasedontheirdistinctsignatures.No significant correlationswerefoundbetweentheauthigenic10Be/9Beratioand localsea level variations (Fig. 2C), nor withany of the available high resolution paleoenvironmental proxies (Table S2; Maiorano etal., 2016) during phases1 to 4 that cover theMIS 20 to MIS 19a interval (Fig. 2), supporting geomagnetic interpretation. This isparticularlyimportantsince strongenvironmentalimprints can prevailon authigenicBe ratiorecords fromshallow marine shelf environments orsemi-enclosedbasins, leadingto very large10Be concentrationchanges(upto10times)aspreviouslydemonstrated intheWanganui Basin(New Zealand;Grahametal., 1998) orin BaffinBay (Simon etal., 2016b). It thus clearly identifies a 10Beoverproduction episode associated with low geomagnetic dipole
moments (GDM) within phase 3 (Fig. 2I). This 10Be overproduc-tionepisodebeginsduringlateMIS19candextendsovertheMIS 19b period accordingto our high-resolution benthic oxygen iso-toperecord(Fig. 5A).
The absolute age of the MBB – defined as the mid-slope of
the VGP transition path or the dipole moment low (RPI low) –
hasbeendebated since its first reliable astrochronologicaldating byShackletonetal. (1990).ThisMBBagefallsintotwomainage groupscenteredat:
∼
772–773and∼
780–781 ka(Table 1inHead andGibbard,2015).Giventheuncertaintiesassociatedwith:i)the astrochronologicaltuning ofmarine sequences(±
4.0or5.0 ka),a directconsequence ofuncertainties regarding thephase relation-shipbetweeninsolationandclimaticchanges (Imbrie andImbrie, 1980); ii) the signal resolution of the sedimentary records; iii) the detrital magnetization processes, especially in low sedimen-tationratecores(Valet etal., 2016);and,iv) the40Ar/39Ardating methods (see Table S3), these two age groups are obviously not significantlydistinctandmostlikelysimplyarise fromagemodel uncertaintiesand/orvariabletimingofmagnetizationlock-in.This isnotablyillustratedbya∼
10 kashiftoftheMBBagebetween pa-leomagneticand10Bemeasurements incoreMD97-2143(Fig. 5B) (Suganumaetal.,2010).Therefore,in order topropose an original discussion, we first
compare the stratigraphic position of the MBB in records
cov-ering a large latitudinal and longitudinal range and presenting high resolution oxygen stratigraphies along with paleomagnetic and/or10Be-proxy(authigenic 10Be/9Be ratioand10Be-flux) mea-surements.InFig. 5,theserecords presentnearlyidentical strati-graphicvariabilityfeatures:i.e., 10Be-proxyincreaseandlargeRPI drop,that arecontemporaneousto thelateMIS 19candMIS19b time periods (phase 3). This is also consistent with the high-resolution RPI record (i.e.
∼
60 cm/ka) from Osaka Bay (Hyodo andKitaba,2015).PriortotheMBBinterval,thefour10Be-records presentedin Fig. 5 yieldminimal 10Be-proxyat theMIS 19c on-set, while the long-term RPI decrease–10Be production increase associated with phase 2 in the marine records spans the entire MIS19cperiod(yellowarrowinFig. 5).Authigenic10Be/9Beratio and10Be-flux presentthus similar phases 2 and 3 patterns with increasing10Be-proxycorresponding todecreasingRPI,and maxi-mum10Be-proxycoevalwiththelowestRPIvalues(Fig. 5).Phase4 presents distinct behavior of the 10Be-proxy between records
obtained fromMJS andEPICA Dome C (EDC) icecore and those
obtainedfrommarinecores(MD90-0961 andMD97-2143)witha
sharperdiminutionofthe10Be-proxyintheMJSandEDCrecords. This difference is most likely relatedto the different sedimenta-tionratesorresolutionofbothrecordtypes(
∼
80 cm/kainMJSvs∼
5 cm/kaforcoreMD90-0961or∼
1 cm/kaforcoreMD97-2143). Thecontemporaneityofglobaldistributionofdirectional varia-tions,oftenchosentopinpointreversals,isquestionedbythe ob-servedslightchronostratigraphicoffsetsofdirectionalchanges be-tweencores(Fig. 5B–D).Thismightresultfromi)notglobally syn-chronousdirectionalreversalfeaturesassociatedwithnon-dipolar transitionalfieldcomponent(Brownetal.,2007; Valetetal.,2016), orii)unreliablerecordsoftransitional directionsinlow sedimen-tationratesequences(Valetetal.,2016).Onthecontrary,theGDM dropand/or10BeoverproductionassociatedwiththeMBBappear synchronousandcoherentduringthelateMIS19c–bintervalinall records(yellowbandinginFig. 5).Thissuggeststhatvariations in intensityaremoreaccurateandreliablepaleomagneticcorrelation markersthandirectionalchanges.One intriguingquestion arisesfromthe absence of10Be over-production episodepreceding the main signature of the reversal (Fig. 5A)incontradictionwiththefrequentreportingofamarked RPIlow in marinesediments (Fig. 5) orlava flowsinterpreted as a precursor of the reversal
∼
18 ka prior to the MBB (e.g. Valet etal.,2014; Singer,2014).Thisalsoappearsincontradictionwith the 10Be flux peak signaled in the EDC record (Fig. 5E). Given thehigh-resolution samplingoftheMJS, itishighly unlikelythat we missed such a large 10Be peak corresponding to the precur-sor,unlessitcoincideswiththeV3tephra.Thelatesthypothesisis hardly likelyconsidering that the 5 cm interval corresponding to theV3layer(Petrosinoetal.,2015) representslessthan100years, nevertheless itcannot be totallydiscarded. Itmust bealso noted that noindisputableandsignificant 10Be signature oftheprecur-sor in marine sediments can be put forth so far despite small
10Be fluxincreasesinterpretedasasignoftheprecursorincores MD98-2187(Suganumaetal.,2010) andMD97-2140(Carcailletet al., 2003). It isthus puzzlingthat such alarge GDM drop, reach-ing intensityvaluesaslow asthereversalitselfinthe PISO-1500 stack(Channelletal.,2009) (Fig. 5F),isnotassociatedwithalarge 10Be overproduction episode in marine records, whereas signifi-cant 10Be overproduction episodes are revealed for each and all GDMlowslinkedwithexcursionsoftheBrunhesChron(Simonet al.,2016a).Theabsenceofsignificant10Be expressionforthe pre-cursorischallenging,bothforfuturecosmogenicnuclideresearch
andforcomparisonbetweensedimentaryandvolcanic
paleomag-neticdata.Beforeanyconclusions onthephysicsoftheprecursor and its 10Be signature can be reached, studies dedicated to this questionarerequiredonothersedimentseries.
7.2. ChronologyoftheMBB
The large 10Be overproduction episode corresponding to the MBB is dated between 776—768.5 (grey bar in Fig. 6) according to ournewchronological framework. Theselimitsare definedby mid-slopes corresponding to the largepeak interval that circum-scribe phase 3. This 10Be overproduction episode is synchronous withthelarge 10Be-fluxpeak fromtheEDCicecore(Raisbecket al., 2006) thatspans the 777–766 kainterval withan age uncer-taintyof
±
6 kausingtheAICC2012agemodel(Bazinetal.,2013) (Fig. 6E). It is also consistent with (i) the 10Be overproduction observed along theequatorial authigenic10Be/9Be stack (Fig. 6G;Simon et al., 2016a); (ii) the MBB ages from numerous marine recordsincludingfivehighsedimentationrateNorthAtlantic
ma-rine cores comprised between 775.3 and 770.9 ka (Channell et
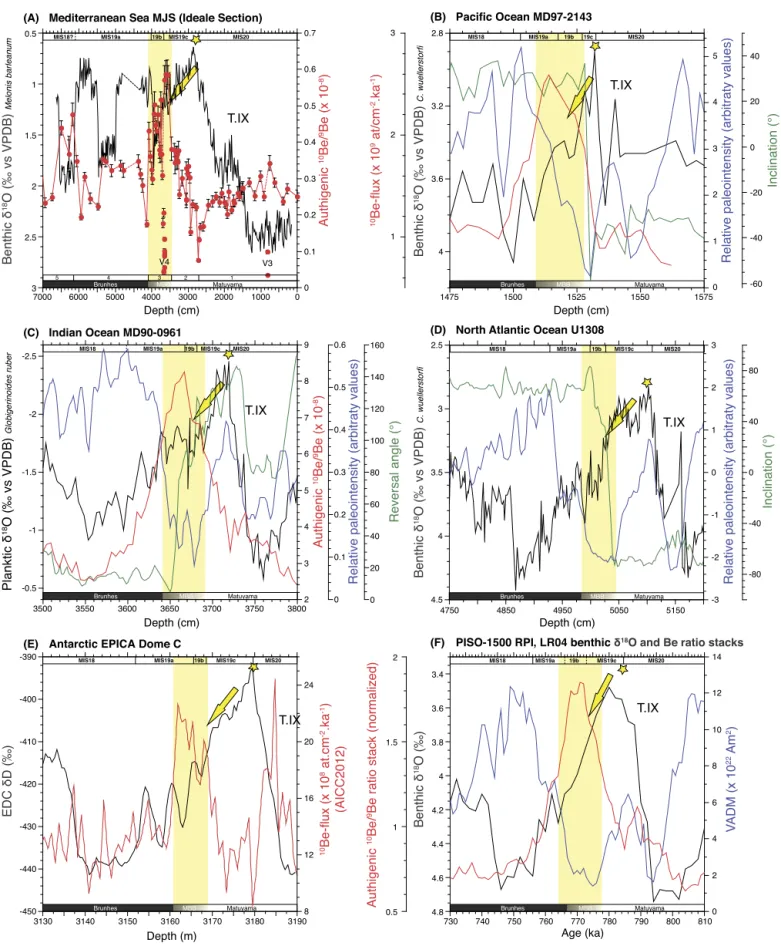
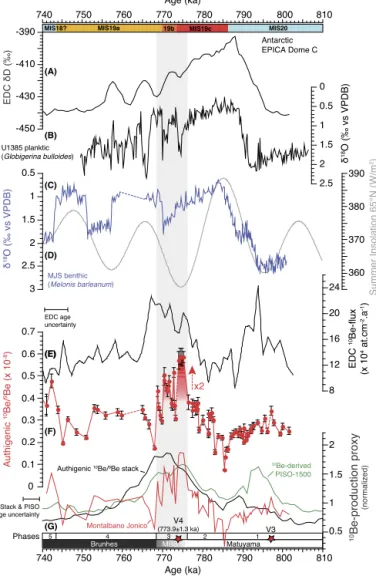
ev-Fig. 5. ClimatostratigraphicpositioningoftheMBB.(A) Authigenic10Be/9Beratioandbenthicδ18OrecordsfromtheIdealesectioncomparedto(B) authigenic10Be-flux
(Suganuma et al., 2010),benthicδ18OrecordandpaleomagneticresultsatcoreMD97-2143from thePacificOcean(Horng et al., 2002);(C) authigenic10Be/9Beratio,
plankticδ18OrecordandpaleomagneticresultsatcoreMD90-0961fromtheIndianOcean(Valet et al., 2014);(D) benthicδ18OrecordandpaleomagneticresultsatIODP
SiteU1308fromtheNorthAtlanticOcean(Channell et al., 2008);(E)δDice record(Jouzel et al., 2007) and10Be-flux(Raisbeck et al., 2006) atEPICADomeC(EDC)from
Antarctica;and(F)PISO-1500RPIstack(Channell et al., 2009),LR04benthicδ18Ostack(Lisiecki and Raymo, 2005) andequatorialauthigenic10Be/9Beratiostack(Simon et al., 2016a).TheyellowstarscorrespondtotheonsetofMIS19cineachseriesusingthelightestδ18OorlowestδDicepeak.Thecomparisonoftheserecordsresultinnearly
identicalclimatostratigraphicsettings(yellowarrow)oftheauthigenic10Be/9Beratioor10Be-fluxenhancementandRPIdropcoetaneoustothelateMIS19c–earlyMIS
19aintervalhighlightedbytheyellowbar.Figurecolorcode:redlinesarefor10Be-proxies,blacklinesareforoxygenisotopes,bluelinesareforRPI,greenlinesrepresent
Fig. 6. ChronologyoftheMBB.Authigenic10Be/9Beratio(F,redline)andbenthic
δ18OMelonisbarleanum record(C,blueline)fromtheIdealesectionarecompared
toreferences.(A)δDice recordand(E)10Be-fluxesfromtheEpicaDomeCplotted
accordingtotheAICC2012agemodel(Jouzel et al., 2007; Raisbeck et al., 2006;
Bazin et al., 2013).(B)NorthAtlanticplankticδ18OrecordofGlobigerinabulloides
fromU1385(Sánchez Goñi et al., 2016) plotted ontheorbitaltunedtime scale (Hodell et al., 2015).(D)65◦Nsummerinsolation(Laskar et al., 2004).(G)Equatorial authigenic10Be/9Berationormalizedstack(black;Simon et al., 2016a),authigenic 10Be/9BerationormalizedrecordfromMontalbanoJonico(red)and10Be-production
computedfromthePISO-1500marinesedimentRPIstack(green;Channell et al.,
2009)usingthetheoretical10BeproductionmodelofMasarik and Beer (2009).
Ma-rineisotopicsubstagesarefromthisstudy.TheMBBtimeintervalhighlightedby greybarisinferredfromtheauthigenic10Be/9Beratiopeakandgeometrically
cen-teredat:∼772.5ka(776–768.5 ka).(Forinterpretationofthereferencestocolorin thisfigurelegend,thereaderisreferredtothewebversionofthisarticle.) idenced in the PISO-1500 stack (Channell et al., 2009) (Figs. 5F and6G); and, (iv) the MBB age in the Chiba composite section, i.e.,770
.
2±
7.
3 ka,estimatedfromaU–Pbdatingofthe Byakubi-Etephraat772.
7±
7.
2 ka (Suganumaetal.,2015).Moreover,the mid-pointofthe10Be overproductionpeak correspondstothe lo-cationoftheV4tephra(Fig. 6) offeringtheuniqueopportunityto dateradiometricallythemid-pointoftheMBBintervalwithoutany hypothesisonsedimentationrates(e.g.interpolation,gap,mixing). The largest 10Be/9Be ratio peak representing a near doubling of the 10Be production stands from 775.8 to 773.9 ka (Fig. 6F). Suchanatmospheric10Be productiondoublingistypicalofdipole momentcollapsesassociatedwithreversals(Raisbecketal.,2006; Valet et al., 2014) orwith some of the largest geomagnetic ex-cursions recorded in marine sediments (Ménabréaz et al., 2012, 2014; Horiuchietal., 2016;Simon etal., 2016a). This∼
2 kape-riod occurringat theend ofMIS 19c(Fig. 6C)isassociated with the first phase ofthe GDM collapsecharacterizing the MBB. The estimatedageforthisphaseisconsistentwiththe40Ar/39Ardate of776
.
0±
2.
0 ka forthetransitionallymagnetizedlavaflowsfrom HawaiiandtheCanary Islands(Singeretal., 2005).Asecond and third phases of high10Be production representing nearly 75% ofthe maximumpeak areobserved between773.0 to 770.2 kaand
769.0 to768.5 ka,respectively. Theylikelyrepresent (sub)millen-nial10Be production variations (Fig. 6F). Such GDM change rates
have been already observed in the best palaeomagnetic records
available from globally distributedlava flows (Valet etal., 2012). Decadal to centennial scale duration changes characterizing the MBBintervalwerealsosuggestedfrompalaeomagneticanalysisof marinesedimentsinJapan(Hyodoetal.,2006) andlacustrine sed-iments inItaly (Sagnotti etal., 2015), together withgeomagnetic fieldnumericalmodel(Brownetal.,2007).
Altogether,the durationof thesignificant 10Be overproduction episode,i.e.,
∼
7.5 ka,associatedwiththeMBBiswithintherange ofthepolaritytransitiondurationgivenbyvirtualgeomagnetic po-lar latitude swings or RPI low from marine sedimentary records (e.g. Channellet al., 2009, 2010), orby the 10Be-flux increase at EDC(Raisbecketal.,2006).Sinceatmosphericcosmogenic10Beproductionratesare modu-latedatglobalscalebythegeomagneticdipolemoment,weused theoretical arguments (e.g. Masarik and Beer, 2009) to compute a relative 10Be-production curve from the PISO-1500 calibrated VADMrecord(Channelletal.,2009).Thiscurvecomparesfavorably withtheequatorial authigenic10Be/9Be stackproposed by Simon etal.(2016a)exceptfortheabsenceoftheprecursor (seeabove) (Fig. 6G).The MBBatmospheric10Be productionchangeretrieved fromthesetworeferencescorresponds tothetwofoldincrease of our authigenic 10Be/9Be ratio (Fig. 6F–G), except for the sharper variations observed inthe Ideale section (Fig. 6F–G). These vari-ationsare mostlikely resultingfrom apronounced smoothing of theauthigenic10Be/9Be ratioorRPIsignalsin“lowsedimentation rate”marinecores,hamperingtherecordingofsuchrapidfeatures intheserecords.
The GDMdynamicspresentedin thisstudythrough 10Be pro-duction changes demonstrate several sharp features rather than
smooth collapse and recovery phases associated with the MBB.
Thesesignatures,includingsomeverysteepchangesspanningonly fewcenturies,mighteithercorrespondtorecordingartifact,or al-ternativelybeassociatedwithnon-linearprocessestriggeringfield reversals(from dipole ornon-dipolefield components). This out-come is particularly important as it places new constraints for numericalmodelsofthegeodynamowithunprecedentedtime res-olution for a marine archive. Additional measurements from the MontalbanoJonicoIdealesectionwillfurtherincreasethis tempo-ralresolution,providingmoreconfidenceincomputedGDM varia-tionrates.
8. Conclusion
We provideoriginal authigenic10Be/9Be ratioresultsandnew high-resolutionbenthic(Melonisbarleanum)oxygenisotoperecord
from the Ideale section of the Montalbano Jonico Succession
(MJS, South Italy)covering Termination IXandMIS 19. A precise 40Ar/39Ardateonatephralayer(V4)isusedinadditionwiththe newoxygen isotope stratigraphyto establisha robust chronolog-ical framework usingthe analogy (orbitalforcing and CO2 level) betweenMIS 1andMIS 19c.Theauthigenic10Be/9Beratio(proxy ofatmospheric 10Be production) resultsyield areliable signature ofthegeomagneticdipolemomentcollapsesthatcharacterizedthe Matuyama–Brunhes polarityreversal. The twofoldincrease of the 10Beproductionissimilartotheonedescribedinbothmarineand icecorerecords.ThisepisodelocatedwithinthelateMIS 19cand
![Table 1 (continued) Sample codes Depth MJScomposite (m) Depth Idealesection(cm) Age model(ka) Sample weight[g] Measured(10Be/9 Be) ∗ 10 − 11 Authigenic decaycorrected10Be∗ 10 8[at·g−1] Authigenic9Be∗1016[at·g−1] Authigenic10Be/9Be∗10−8 NC257 124.70 2700 78](https://thumb-eu.123doks.com/thumbv2/123doknet/13765464.438616/7.918.49.855.83.1055/continued-mjscomposite-idealesection-measured-authigenic-decaycorrected-authigenic-authigenic.webp)
![[PDF] Exercices Excel en pdf avec correction | Cours Excel](data:image/gif;base64,R0lGODlhAQABAIAAAP///wAAACH5BAEAAAAALAAAAAABAAEAAAICRAEAOw==)