Plasma Science and Fusion Center Massachusetts Institute of Technology
Cambridge, MA 02139 USA
* CompX
Del Mar, CA 92104 USA
** Princeton Plasma Physics Laboratory Princeton, NJ 08543 USA
This work was supported by the U.S. Department of Energy awards
DE-FC02-99ER54512 and DE-AC02-76CH03073. Reproduction, translation, publication, use and disposal, in whole or in part, by or for the United States government is permitted.
Submitted for publication to Physics of Plasmas. PSFC/JA-10-10
Absorption of lower hybrid waves in the scrape off layer
of a diverted tokamak
Wallace, G.M, Parker, R.R., Bonoli, P.T., Harvey, R.W.*, Hubbard, A.E., Hughes, J.W., LaBombard, B.L., Meneghini, O., Schmidt, A.E.,
Shiraiwa, S., Smirnov, A.P.*, Whyte, D.G., Wilson, J.R.**, Wright, J.C., and Wukitch, S.J.
Absorption of lower hybrid waves in the scrape off layer of a
diverted tokamak
G.M. Wallace, R.R. Parker, P.T. Bonoli, A.E. Hubbard, J.W. Hughes, B.L. LaBombard, O. Meneghini, A.E. Schmidt, S. Shiraiwa, D.G. Whyte, J.C. Wright, and S.J. Wukitch
MIT Plasma Science and Fusion Center, Cambridge, MA 02139
R.W. Harvey and A.P. Smirnov
CompX, Del Mar, CA 92014
J.R. Wilson
Princeton Plasma Physics Laboratory, Princeton, NJ 08543
(Dated: February 24, 2010)
Abstract
The goal of the Lower Hybrid Current Drive (LHCD) system on the Alcator C-Mod tokamak is to investigate current profile control under plasma conditions relevant to future devices such as ITER and DEMO. Experimental observations of an LHCD “density limit” for C-Mod are presented in this paper. Bremsstrahlung emission from relativistic fast electrons in the core plasma drops
suddenly above line averaged densities of 1020 m−3 (ω/ω
LH ∼3–4), well below the density limit
previously observed on other experiments (ω/ωLH ∼ 2). Electric currents flowing through the
scrape off layer (SOL) between the inner and outer divertors increase dramatically across the same density range that the core bremsstrahlung emission drops precipitously. These experimental x-ray data are compared to both conventional modeling, which gives poor agreement with experiment above the density limit, and a model including collisional absorption in the SOL, which dramatically improves agreement with experiment above the observed density limit. These results show that strong absorption of LH waves in the SOL is possible on a high density tokamak and the SOL must be included in simulations of LHCD at high density.
I. INTRODUCTION
The Lower Hybrid Current Drive (LHCD) system [1] on the Alcator C-Mod tokamak [2] is designed to investigate current profile control under plasma conditions relevant to future devices such as ITER and DEMO. This paper addresses the behavior of Lower Hybrid (LH) waves in the edge and Scrape Off Layer (SOL) of a compact, high field, high density, diverted tokamak. In particular, the critical density associated with reduced current drive in C-Mod is unique in that it occurs at a value significantly lower than what would have been expected based on prior LHCD experiments. Recent results from the Alcator C-Mod LHCD experiment suggest that interactions between LH waves and the SOL plasma can have a substantial impact on the operational effectiveness of a LHCD system in high density ohmic discharges [3].
LH waves drive current by transferring momentum and energy from the wave to electrons traveling along the magnetic field with velocities similar to the parallel phase velocity of the wave, v||, through Landau damping. This results in an asymmetric plasma resistivity with a
very high current drive efficiency proportional to the inverse of the plasma electron density,
ne, and the inverse of the parallel refractive index, n|| ≡ ck||/ω, squared [4, 5].
Efficient LHCD at high density on previous experiments has been limited by wave ac-cessibility [6, 7] and parametric decay instabilities [8, 9]. Considering only the acac-cessibility criterion, any wave for which n|| is locally greater than n||,crit everywhere in the plasma will
be able to penetrate to the core of the plasma, provided that the wave is not fully absorbed in the edge region first. Here,
n||crit ≈ s 1 −ω 2 pi ω2 + ω2 pe ω2 ce + ωpe |ωce| . (1)
In an axisymmetric toroidal geometry, the toroidal mode number of the wave is conserved everywhere in the plasma. Consequently, one can approximate n|| as having a 1/R
depen-dence. If we assume that ne = ne(ψ) and the minimum B, and thus the maximum value of
n||,crit, for a given density profile occurs on the midplane of the low field side in a tokamak,
a wave will satisfy the accessibility criterion at all points in the plasma if the local value of
n|| is greater than the critical value on the midplane of the low field side. It is important
to note that this discussion of wave accessibility so far ignores possible modifications to n||
This effect is taken into account in the simulations that are discussed later in this paper. Parametric decay instabilities [10, 11] are a three wave coupling process by which an incident lower hybrid wave at a frequency ω = ω0 decays into a low frequency branch, at
ω = ω1 ∼ ωci ¿ ω0, and a daughter LH wave, at ω = ω0 − ω1. The wavenumber of the
daughter LH wave may upshift substantially, thereby reducing the current drive efficiency. If the upshift of n||is severe enough the daughter wave may damp on ions as well. A threshold
for strong parametric decay occurs at ω0/ωLH ∼ 2. Because ωLH scales with magnetic field,
parametric decay is of particular importance on very high field experiments such as Alcator C [9].
II. EXPERIMENTAL RESULTS
Recent results on Alcator C-Mod indicate that LH waves are not absorbed in the core of L-mode plasmas at line averaged densities above ¯ne ∼ 1 × 10²⁰m−3. These phenomena include
reduced core fast electron bremsstrahlung and the presence of electric currents and increased electron density in the scrape off layer (SOL). This suggests a lack of non-thermal electrons, and thus current drive, inside the separatrix, and an increase in LH wave absorption in the SOL at high density.
Unless otherwise noted, the data presented in this paper are from ohmic L-mode dis-charges at typical C-Mod parameters (Bφ = 5.4–7 T, Ip = 0.8–1.1 MA). In order to cover
the largest number of experimental conditions with the number of discharges available, the plasma density was ramped throughout each discharge. Ramps up and down in density were performed to verify that there was no hysteresis in the density scans.
A. Hard X-Ray Bremsstrahlung
The Hard X-Ray (HXR) diagnostic on C-Mod [12] is used both for localizing the fast electron bremsstrahlung emission, and for comparing the relative magnitude of the X-ray count rate. The count rate can be taken as a proxy for the density of the fast electron tail generated by LHCD. Since the thermalization rate of the fast electrons due to collisions is proportional to plasma density, it follows that, for a fixed source of fast electrons in an otherwise uniform plasma, the fast electron population should be inversely proportional to
0.4 0.6 0.8 1 1.2 1.4 1.6 x 10²⁰ 103 104 105 106 107
n
e[m
−3]
Count Rate (Chords 9−24, 40−200 keV) [s
−1
]
Line Integrated HXR Count Rate
n ||=1.9, 5.4T, 800kA n ||=2.3, 5.4T, 800kA n ||=1.9, 7.0T, 800kA n ||=2.3, 7.0T, 800kA n ||=1.9, 5.4T, 1.1MA n ||=2.3, 5.4T, 1.1MA
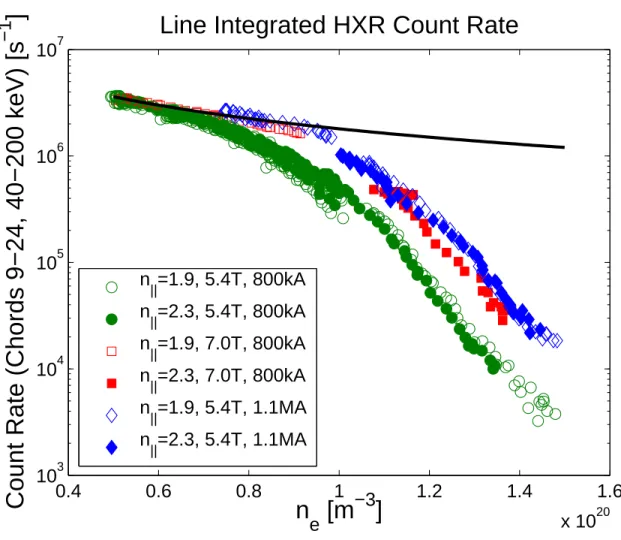
FIG. 1: Line integrated X-ray emission on the central chords as a function of line averaged density. Data are plotted on a semi-logarithmic scale for X-rays between 40 and 200 keV. The black curve
represents a 1/ne falloff. The count rates in this figure are normalized to the square root of net
LH power.
plasma density. This scaling is confirmed by simulations which will be discussed later in this paper. Figure 1 shows that the experimental HXR count rates fall much more steeply than the expected 1/ne above ¯ne ∼ 0.9 × 10²⁰ m−3 [3]. This is particularly true for the 5.4
T, 800 kA case, which deviates from the 1/ne curve starting near ¯ne = 7 × 10¹⁹ m−3. The
data at higher magnetic field and plasma current drop more slowly as density rises, but are still two orders of magnitude lower than the 1/ne prediction at ¯ne= 1.5 × 10²⁰ m−3.
The count rates shown in Figure 1 have been normalized to the magnitude of the wave electric field (square root of net LH power). The data represent a range of net LH power from 550 to 900 kW. The square root of LH power scaling leads to the tightest grouping of the
experimental data, although it is unclear why the HXR emission is not directly proportional to PLH.
Although a violation of the accessibility criterion above 1 × 10²⁰ m−3 would appear to
explain the results of Figure 1, there are several points which contradict the accessibility criterion explanation. First, the data taken at n|| = 2.3 (closed symbols) and the data
taken at n|| = 1.9 (open symbols) do not show a significant difference in count rate as the
density changes. If the loss of core bremsstrahlung emission were related to the accessibility criterion, one would expect the lower value of n|| to be affected more severely and at a lower
density than the higher value of n||. The two sets of data are nearly coincident across a
range of density, magnetic field, and plasma current. In addition, the accessibility criterion is satisfied at both n|| of 1.9 and 2.3, even for the highest density shown in Figure 1 at
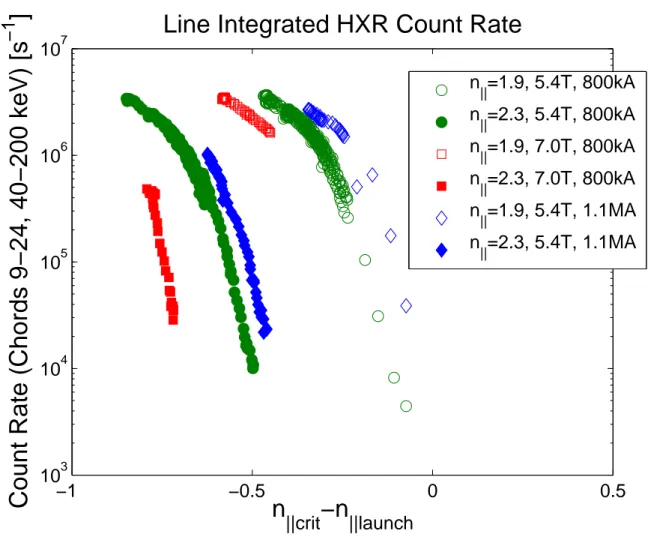
the lowest magnetic field. Figure 2 shows the bremsstrahlung emissivity as a function of
n||crit− n||launch. The value of n||crit is evaluated based on the line averaged density and on
axis magnetic field. According to results from FTU [13], accessibility should only be an issue for n||crit− n||launch> 0.05 when calculated in this manner.
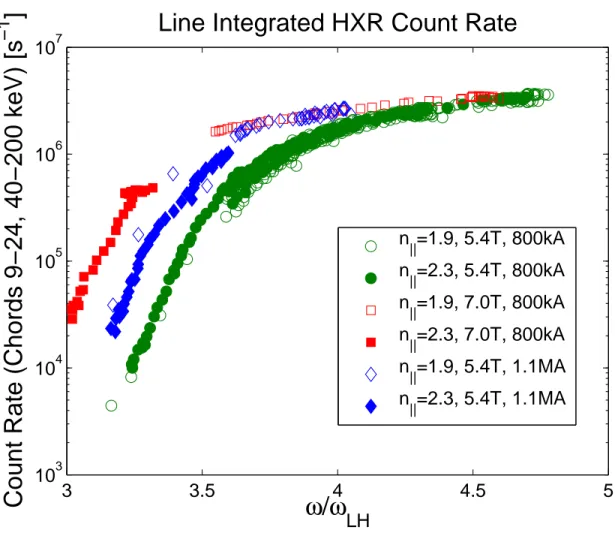
The so-called “density limit” observed on Alcator C has been attributed to parametric decay instabilities (PDI) as ω → 2ωLH [8–11]. LHCD efficiencies proportional to 1/¯ne with
strong non-thermal electron cyclotron emission (ECE) and HXR emission were observed on Alcator C up to ¯ne = 1020 m−3 [14]. The Alcator C results were obtained at high toroidal
field (Bφ∼ 8 T) such that ω/ωLH ∼ 2 at ¯ne = 1020 m−3. The bremsstrahlung data from
C-Mod show a precipitous drop in emission below ω/ωLH ∼ 3.75, as can be seen from Figure
3. All of the data from C-Mod occur at values of ω/ωLH in excess of 3, for which there
should be no significant parametric decay according to earlier results. The discrepancies between the data at 5.4 T and 7.0 T show that although the experimental bremsstrahlung emission scales as a function of ω/ωLH at a given value of magnetic field, a comparison
between different values of magnetic field at a fixed density do not agree with the ω/ωLH
scaling. An increase in magnetic field will increase the value of ωLH, but the data show an
increase in HXR emission at a fixed density for the higher field. The discrepancy seen in Figure 3 between the 5.4 T and 7.0 T data shows that bremsstrahlung emission is a function of density, not ω/ωLH. Therefore, ω/ωLH is not the critical parameter for the density limit
observed on C-Mod.
mea-−1 −0.5 0 0.5 103 104 105 106 107
Line Integrated HXR Count Rate
n
||crit
−n
||launchCount Rate (Chords 9−24, 40−200 keV) [s
−1
]
n ||=1.9, 5.4T, 800kA n ||=2.3, 5.4T, 800kA n ||=1.9, 7.0T, 800kA n ||=2.3, 7.0T, 800kA n ||=1.9, 5.4T, 1.1MA n ||=2.3, 5.4T, 1.1MAFIG. 2: Fast electron bremsstrahlung emission as a function of n||crit− n||launch. The value of n||crit
is evaluated using line averaged density and on-axis magnetic field.
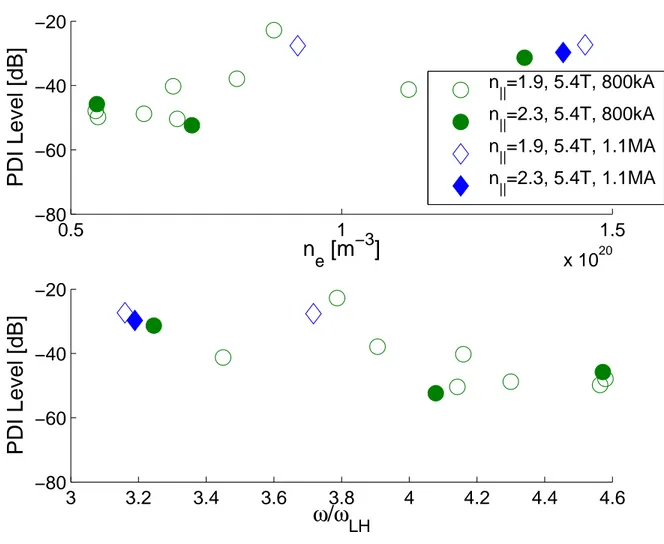
suring the microwave frequency spectrum picked up by a probe mounted between two rows of the LH launcher. The PDI level is defined here as the amplitude of the pump wave (in dB) minus the amplitude of the strongest downshifted sideband (also in dB). This gives a relative measure of the strength of the parametric decay instabilities. The scaling of the PDI Level as a function of line averaged density and ω/ωLH is shown in Figure 4. Although
the PDI level rises with line averaged density, at the highest densities (and consequently lowest values of ω/ωLH) the strongest sideband is at least -20 dB relative to the pump,
corresponding to less than 1% of the total power contained in the sideband. Interpretation of the PDI level is somewhat problematic since the measurement location in this instance is in close proximity to the LH launcher. The relative magnitude of the downshifted sideband may be higher away from the launcher. PDI levels as high as -10 dB relative to the pump
3 3.5 4 4.5 5 103 104 105 106 107
Line Integrated HXR Count Rate
ω
/
ω
LH
Count Rate (Chords 9−24, 40−200 keV) [s
−1
]
n ||=1.9, 5.4T, 800kA n ||=2.3, 5.4T, 800kA n ||=1.9, 7.0T, 800kA n ||=2.3, 7.0T, 800kA n ||=1.9, 5.4T, 1.1MA n ||=2.3, 5.4T, 1.1MAFIG. 3: Fast electron bremsstrahlung as a function of ω/ωLH at BT = 5.4 and 7.0 T. ωLH is
computed using line averaged electron density and on axis magnetic field.
wave have been observed on C-Mod [15], although at higher density (¯ne > 2 × 10²⁰ m−3).
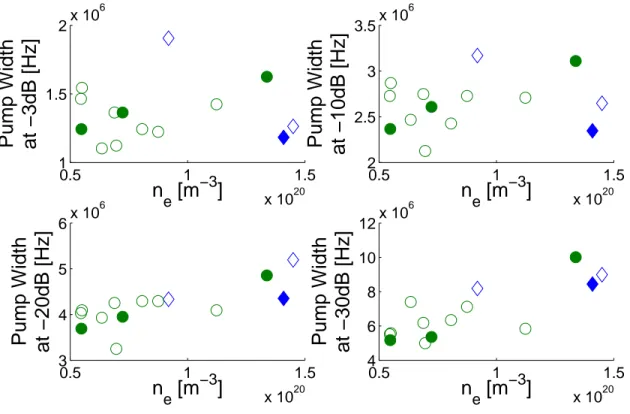
Recent results from the FTU LHCD experiment [16] indicate that parametric decay can contribute to a loss of LHCD efficiency under conditions of high density and low temperature in the SOL. The PDI signature in the FTU experiment is seen through broadening of the pump wave as opposed to discrete downshifted harmonics of the ion cyclotron frequency seen on C-Mod. Figure 5 shows the width of the pump wave at several values relative to the peak of the spectrum. At -3 and -10 dB relative to the peak, the spectral width shows no clear increase as a function of line averaged density. However, a slight increase in pump width can be seen in the data lower relative to the peak. At -20 dB the pump width increases from ∼ 4 × 10⁶ to ∼ 5 × 10⁶ Hz, while at the -30 dB level the pump width increases from
0.5 1 1.5 x 10²⁰ −80 −60 −40 −20
n
e[m
−3]
PDI Level [dB]
3 3.2 3.4 3.6 3.8 4 4.2 4.4 4.6 −80 −60 −40 −20ω
/
ω
LHPDI Level [dB]
n ||=1.9, 5.4T, 800kA n ||=2.3, 5.4T, 800kA n ||=1.9, 5.4T, 1.1MA n ||=2.3, 5.4T, 1.1MAFIG. 4: PDI Level as a function of density (top) and ω/ωLH (bottom) for the discharges shown in
Figure 3. Data for 7.0 T discharges are not available.
This slight increase in pump width is inconsistent with severe spectral broadening causing the observed density limit.
B. Scrape-Off-Layer Currents
Langmuir probes mounted in the upper and lower divertor regions of C-Mod are typically operated in a swept I−V configuration for measurement of electron density and temperature. As the potential difference between the probe and the vacuum vessel wall passes through zero, the “ground current” collected by the probe, Ignd, can be measured. This current is
0.5 1 1.5 x 10²⁰ 1 1.5 2x 10 6
n
e[m
−3]
Pump Width
at −3dB [Hz]
0.5 1 1.5 x 10²⁰ 2 2.5 3 3.5x 10 6n
e[m
−3]
Pump Width
at −10dB [Hz]
0.5 1 1.5 x 10²⁰ 3 4 5 6x 10 6n
e[m
−3]
Pump Width
at −20dB [Hz]
0.5 1 1.5 x 10²⁰ 4 6 8 10 12x 10 6n
e[m
−3]
Pump Width
at −30dB [Hz]
FIG. 5: Pump wave width as a function of line averaged density for the discharges shown in Figure 3. Colors and symbols correspond to the same conditions as in Figure 4.
the point on the I − V characteristic where Ignd is measured for two probes before and
during a high power LHCD pulse. The convention taken here is that a positive current will be measured if the probe is collecting ions. Since the geometry of the probe is known, the parallel current density incident on the probe can be determined from the current collected by the probe based on the angle of incidence of the field line and the radius of the probe electrode. Figure 7 shows the location of the C-Mod divertor Langmuir probes.
In normal operation, the parallel electric current in the SOL, J||, measured by the divertor
probes is less than ∼ 1 × 10⁵ A/m2 and of similar magnitude on all of the probes. During
high power LH operation at line averaged densities above ∼ 1 × 10²⁰ m−3 the magnitude
of J|| measured by some probes increases dramatically. Figure 8 shows the ground currents
for probes on the inner and outer side of the lower divertor in a lower null discharge. The two probes, which lie on approximately the same flux surface, see ground currents which are nearly the same in magnitude and opposite in polarity. The polarity difference between the inner and outer divertors indicates that the current flowing between the two probes is
−80 −60 −40 −20 0 20 −0.5 0 0.5 1
Probe Voltage [V]
Probe Current [A]
Before LHCD
−80 −60 −40 −20 0 20 −0.5 0 0.5 1Probe Voltage [V]
Probe Current [A]
During LHCD
Outer Probe 08 Inner Probe 02 Outer Probe 08 Inner Probe 02I
satI
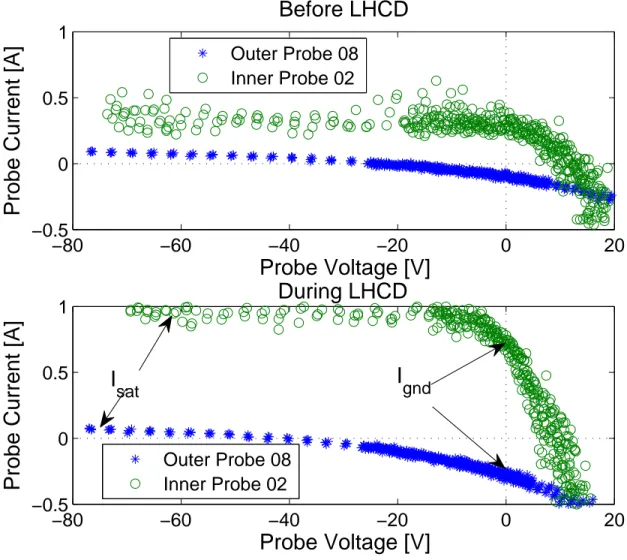
gndFIG. 6: I − V characteristic for Langmuir probes mounted in the inner and outer lower divertors
before and during high power LHCD. The ground current, Ignd, and the ion saturation current,
Isat are shown. Both probes are located at ρ ∼ 0.008 m. Shot number = 1080402031.
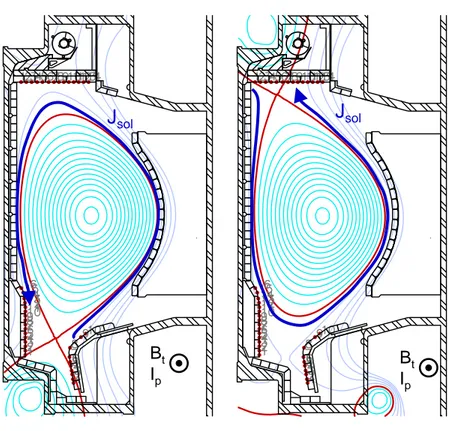
leaving the outer divertor, traveling up and around the top of the plasma, and returning to the vacuum vessel wall on the inner divertor in lower single null (LSN). When projected in the toroidal direction, this corresponds to the same direction as the current in the confined plasma, Ip, if we assume that the SOL current is traveling parallel to the magnetic field.
Figure 9 shows the SOL current observed in a high density upper single null (USN) discharge. In the upper null configuration, the current leaves the upper inner divertor and flows towards the upper outer divertor. Again, this is the same direction as Ip. Figure 10
1
14
1
16
1
10
FIG. 7: Locations of Langmuir probes mounted in the upper and lower divertors of Alcator C-Mod are indicated by red dots in the insets. Probes are numbered sequentially for the inner, outer, and upper divertors.
0.6 0.7 0.8 0.9 1 1.1 1.2 1.3 0 500 1000
LH Net
Power [kW]
0.6 0.7 0.8 0.9 1 1.1 1.2 1.3 −0.4 −0.2 0Outer 08
I
gnd[A]
0.6 0.7 0.8 0.9 1 1.1 1.2 1.3 0 0.2 0.4Inner 03
I
gnd[A]
0.6 0.7 0.8 0.9 1 1.1 1.2 1.3 6 7 8x 10 19Time [s]
n
e[m
−3]
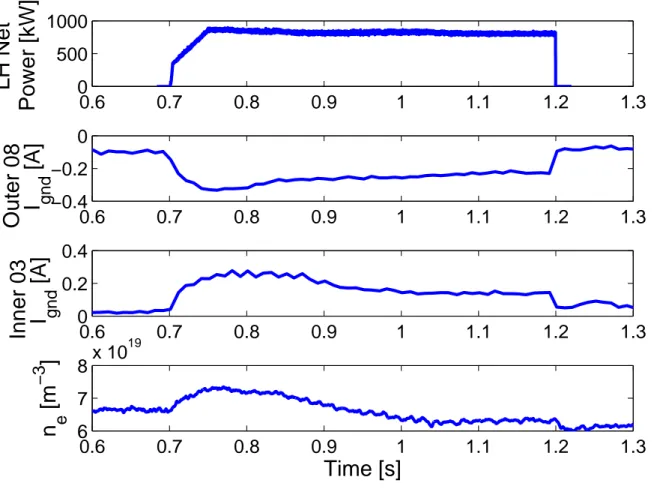
FIG. 8: Waveform of SOL currents observed during LHCD experiments in lower single null. For
this discharge ρlaunch ∼ 0.015 m and ρprobe ∼ 0.008 m with ¯ne ∼ 7 × 10¹⁹ m−3. Shot number =
1080402031.
upper and lower null configurations. Figure 9 also gives some indication of the scaling of the SOL current with density. As ¯ne increases from 1.0 × 10²⁰ to 1.5 × 10²⁰m−3, the ground
current on the probe rises from near zero to 0.3 A.
Figure 11 shows the change in the SOL current density for the USN discharges in Figure 1. The SOL currents suddenly increase in magnitude at ¯ne ∼ 1.0×10²⁰m−3, the same density at
which fast electron bremsstrahlung disappears from the central HXR chords. Enhanced SOL currents during high power LHCD have been observed in LSN as low as ¯ne ∼ 7 × 10¹⁹ m−3.
Modulation of the SOL current during LHCD is also present in discharges with a launched
0.6 0.7 0.8 0.9 1 1.1 1.2 1.3 0 500 1000
LH Net
Power [kW]
0.6 0.7 0.8 0.9 1 1.1 1.2 1.3 0 0.2 0.4Upper 11
I
gnd[A]
0.6 0.7 0.8 0.9 1 1.1 1.2 1.3 −0.4 −0.2 0Outer 09
I
gnd[A]
0.6 0.7 0.8 0.9 1 1.1 1.2 1.3 1 1.5 x 10²⁰n
e[m
−3]
Time [s]
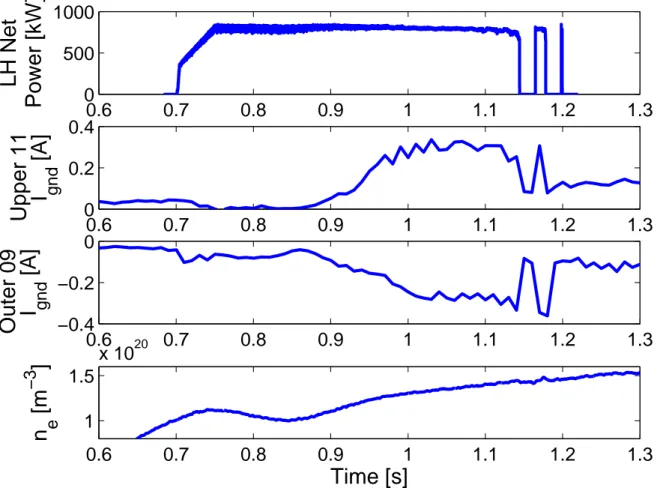
FIG. 9: Waveform of SOL currents observed during LHCD experiments at high density in upper single null. The largest SOL currents connect between probe 11 in the upper divertor and probe
9 in the lower outer divertor for this discharge. For this discharge ρlaunch∼ 0.025 m and ρprobe ∼
0.015 m. Shot number = 1080513019.
the direction of Ip despite a change in the sign of n||.
Figure 12 shows the values of Isat and Ignd for probes on the inner and outer divertor
surfaces in a lower single null discharge. On the ion collecting end of the flux tube (which in LSN is the inner divertor) there is a substantial increase in the ion saturation current,
Isat, during LHCD. Interestingly, there is no corresponding change in Isat at the electron
collecting end of the flux tube (which in LSN is the outer divertor). On the end of the field line which collects ions, Ignd cannot exceed Isat, and the ratio Ignd/Isat is near 0.8 with and
without LHCD. On the end of the field line collecting electrons, Igndwould be limited by the
Bt
Ip BI t
p
J
solJ
solFIG. 10: Direction of the SOL currents projected on the poloidal cross section for USN and LSN.
In both configurations the SOL current flows in the same toroidal direction as Bφ and Ip.
than |Isat| by the ratio of the deuteron mass to the electron mass. This means that |Ignd|
may easily exceed |Isat| on the electron collecting end of the field line.
If the SOL current were carried by non-thermal electrons generated by LHCD via Landau damping, then the currents should change directions with n||, but the counter-current drive
data shows that the direction of the SOL current does not change with the sign of n||. When
combined with the fact that the ratio of Isat to Ignd is near 0.8 on the ion collecting end of
the flux tube before and during LHCD, this suggests that the current is not directly driven by the LH waves. Rather, the increase in the SOL current appears to be due to an increase in density, and thus Isat, at the ion collecting end of the field line. The increase in Isat
then allows the SOL current (which cannot exceed Isat at the ion collecting end of the flux
0.4 0.6 0.8 1 1.2 1.4 1.6 x 10²⁰ 0 1 2 3 4 5 6 7x 10 5
n
e
[m
−3
]
SOL Current Density [A/m
2
]
n||=1.9, 5.4T, 800kA n ||=2.3, 5.4T, 800kA n ||=1.9, 7.0T, 800kA n ||=2.3, 7.0T, 800kA n ||=1.9, 5.4T, 1.1MA n ||=2.3, 5.4T, 1.1MAFIG. 11: Peak SOL current density as a function of line averaged density in USN L-mode discharges,
as measured by the outer upper divertor Langmuir probes. Data at n|| = 2.3 show significantly
more current than data at n|| = 1.9. SOL currents are strongest for smaller values of magnetic
field, and plasma current.
thermoelectric current [17, 18] flowing from the hotter, less dense electron collecting divertor to the colder, denser ion collecting divertor. The temperature and density asymmetry on the ion and electron collecting divertors can be inferred from the shapes of the I − V curves in Figure 6.
An increase in plasma density at the inner divertor could be caused by a source of density localized to the outer mid-plane. For SOL flows in a diverted tokamak, ballooning transport pushes particles out of the plasma at the outer mid-plane. These particles are exhausted through the SOL to the active X-point [19]. If a source of plasma density is localized to the outer mid-plane region of the SOL, this should result in an increase in density at the inner
0.6 0.7 0.8 0.9 1 1.1 1.2 1.3 0 500 1000
LH Net
Power [kW]
0.6 0.7 0.8 0.9 1 1.1 1.2 1.3 −0.4 −0.2 0 0.2 0.4Outer Probe
Current [A]
0.6 0.7 0.8 0.9 1 1.1 1.2 1.3
0 0.5 1 1.5
Inner Probe
Current [A]
Time [s]
I sat I gnd I sat I gndFIG. 12: Comparison of Ignd and Isat on divertor probes in LSN configuration. Ignd on the inner
divertor is near the limit set by Isat, while on the outer divertor |Ignd| exceeds |Isat|. Shot number
= 1080402031.
divertor, regardless of whether the density is coming from inside the separatrix or from an external source (i.e. the LH launcher region).
Collisionally damped Lower Hybrid waves have been observed to drive current on open field lines where k||vt/ω ¿ 1 in the linear H-1 device [20]. An upper limit on the driven
current can be obtained by assuming that E||(z) is a constant. This assumption reduces
Equation 3 of [20] to hj||i = −4.5978 × 10⁻¹¹ q me ω2 pe ω3k|||E||| 2 (2)
of 1 × 10¹⁹ m−3, a parallel current density of 236 A/m2 arises. Increasing the electric field
by a factor of 10 increases the current density to 2.36 × 10⁴ A/m2. Given that this upper
limit on the driven current is still an order of magnitude lower than the observed current, this result is not a sufficient explanation for the observed currents. This suggests that the SOL current is a consequence of the density increase at the divertor on the ion collecting end of the field line, not the cause of the density increase at the divertor.
Taking a typical temperature for the region of the SOL where the currents are observed of 10 eV, this corresponds to a resistivity of 6.5 × 10⁻⁵ Ωm for the SOL plasma. If the DC
toroidal electric field were solely responsible for the currents observed, the current density should be equal to E/η ∼ 4 kA/m2. This is a factor of 100 less than the current densities
observed during LHCD at high density. Joule’s Law can be used to estimate the resistive power dissipated in the SOL. If we take the current to be evenly distributed in a 1 cm thick annulus surrounding the separatrix, this results in a dissipated resistive heating power of approximately 850 kW, which is similar in magnitude to the total injected LH power in these discharges. The estimated total current in the SOL during LHCD is ∼ 20 kA, again assuming that the current is evenly distributed in a 1 cm thick annulus surrounding the separatrix.
III. SIMULATION OF WAVE BEHAVIOR
The GENRAY/CQL3D code package [21, 22] includes a fast electron bremsstrahlung x-ray synthetic diagnostic that can be directly compared with the experimental results in Section II A. Figure 13 shows the measured and simulated bremsstrahlung emission for a range of plasma parameters. The simulations use experimental profiles of plasma density and temperature, along with experimental values of toroidal electric field and Zef f from the
same discharges plotted in the experimental HXR data. The simulated emission at values of ¯
ne between 5 × 10¹⁹ and 1 × 10²⁰ m−3 is higher than the experimental data by a factor of ∼5,
while at 1.5 × 10²⁰ m−3 the discrepancy is 2-3 orders of magnitude. However, the simulated
emissivity is in qualitative agreement with the 1/ne estimate. As with the experimental
data, the simulations predict nearly identical emissivity for n|| values of 1.9 and 2.3.
Figure 14 shows the simulated ray trajectories for a 5.4 T, 800 kA plasma at ¯ne = 1.4×10²⁰
m−3. A close examination of the simulated ray trajectories in high density (¯n
m−3) shots shows that many of the rays are trapped in the edge region of the plasma
immediately after launch. At first glance this appears to be a simple accessibility problem; however, the traditional accessibility picture of ray reflection at the slow/fast wave mode-conversion point is not substantiated by the simulated ray behavior.
The accessibility criterion is violated when the discriminant of the dispersion relation reaches zero. For the rays shown in Figure 14, the only points along the rays where the discriminant approaches zero is where the ray reflects off the cutoff layer at the very edge of the plasma. Thus the wave penetration in this discharge is determined by wave refraction rather than by LH wave accessibility in the conventional sense. In these simulations a cutoff layer is created by setting the density at the separatrix below the cutoff density of 2.6 × 10¹⁷
m−3. The edge plasma density is set below the cutoff to avoid specular reflection of rays
by a perfectly conducting surface located by default at the separatrix. Avoiding specular reflection is necessary since wavenumber shifts due to specular reflection are not the same as shifts caused by reflection at a cutoff. Reflections from a cutoff are the more likely cause of inward reflections near the edge of the plasma, since the plasma density does drop precipitously in this region. This creates a very narrow region in which the rays are trapped between reflections at the cutoff layer and refraction caused by the change in dielectric constant.
GENRAY has been used to investigate the sensitivity of the simulated hard x-ray spectra to the number of times the LH rays are allowed to reflect from the separatrix surface in the code, near where the ray encounters a cutoff. This surface defines what is taken to be the vacuum vessel wall in the code. Figure 15 shows the results of a scan with 19, 1, and 0 reflections from the wall. By decreasing from 19 allowed reflections, for which all off the power in every ray is absorbed, to 1 allowed reflection, the simulated HXR emission decreases by nearly an order of magnitude at high density. This is a substantial improvement in agreement, but still an overestimate of the experimental data by a factor of ∼50 at ¯
ne = 1.5 × 10²⁰ m−3. Reducing the number of reflections to zero, such that any ray will
be immediately stopped after it makes contact with the separatrix, decreases the simulated HXR emission by an additional 4 orders of magnitude at 1.5 × 10²⁰ m−3 and more than
two orders of magnitude at 5 × 10¹⁹ m−3. This shows that single-pass damping is weak
in these relatively cold discharges even at the low density end of the scan, and we must properly account for what happens to the rays as they reflect from, or are absorbed at, the
0.4 0.6 0.8 1 1.2 1.4 1.6 x 10²⁰ 103 104 105 106 107 108
n
e[m
−3]
Count Rate (Chords 9−24, 40−200 keV) [s
−1
]
Line Integrated HXR Count Rate
n ||=1.9, 5.4T, 800kA n ||=2.3, 5.4T, 800kA n ||=1.9, 7.0T, 800kA n ||=2.3, 7.0T, 800kA n ||=1.9, 5.4T, 1.1MA n ||=2.3, 5.4T, 1.1MA
FIG. 13: Simulated and measured HXR emission as a function of line averaged density. The output of the synthetic diagnostic is shown with large symbols, while the experimental data are shown with small symbols.
edge of the plasma. For the synthetic diagnostic HXR emissivity to agree fully with the experimental data, some amount of reflection from the cutoff must be taken into account, but there also must be some loss mechanism at the edge.
A. Scrape-Off-Layer Model for GENRAY
A close examination of the ray trajectories in Figure 14 shows that a more careful treat-ment of the pedestal and SOL regions is necessary to represent the wave behavior in the edge region accurately. Artificially setting the edge density below cutoff creates a narrow region between the low density cutoff layer and the high density refracting layer. The subtle
0.5 0.6 0.7 0.8 0.9 1 −0.5 −0.4 −0.3 −0.2 −0.1 0 0.1 0.2 0.3 0.4
FIG. 14: GENRAY simulation showing rays trapped near the edge of the plasma. The highest
n|| rays penetrate to near the core of the plasma, but the lower n|| rays stay close to the edge.
The cutoff layer in this simulation is located at the separatrix and the vacuum vessel walls are superimposed for reference.
shifting of the wave number has a substantial impact on current drive efficiency and will not be properly accounted for without accurately representing the plasma in this critical region. To account for this, a simplified SOL model has been added to GENRAY. The SOL model is poloidally symmetric and has an exponential decay based on the shortest distance from a given point to the last closed flux surface. Magnetic fields in the SOL are imported directly from a magnetic field equilibrium reconstruction. The SOL is only included in the GENRAY code and is not a part of CQL3D. Consequently, quasi-linear wave absorption is not calcu-lated in the SOL, and the radiation from fast electrons born in the SOL is not included in the synthetic diagnostic. The symmetric SOL model added to GENRAY includes collisional
0.4 0.6 0.8 1 1.2 1.4 1.6 x 10²⁰ 101 102 103 104 105 106 107 108
n
e[m
−3]
Count Rate (Chords 9−24, 40−200 keV) [s
−1
]
Predicted HXR Count Rates
n ||=1.9, 5.4T, 800kA n ||=2.3, 5.4T, 800kA n ||=1.9, 7.0T, 800kA n ||=2.3, 7.0T, 800kA n ||=1.9, 5.4T, 1.1MA n ||=2.3, 5.4T, 1.1MA
FIG. 15: Simulated HXR emission as a function of density for the maximum number of radial reflections set to 19 (large circles), 1 (triangles), and 0 (crosses). Absorption on a single pass is weak at all densities.
damping effects. At the low temperatures encountered in the SOL, collisional damping can be comparable to or exceed Landau damping for low n|| waves; however, information
re-garding the collisional absorption of the rays in the SOL is not included in the quasilinear diffusion coefficient used in CQL3D other than a reduction of the wave field amplitudes in the core plasma. The effects of collisional damping in the SOL will be discussed further in Section III B.
The ray trajectories in the low density case are nearly unchanged when compared to simulations at the same density without a SOL. In the high density case with the SOL present, the “trapped” rays are seen to propagate in the SOL region in such a way that many intersect either the limiter or the divertor. It should be noted that a uniform density
scrape off scale length of 0.1 m is reasonable in the divertor regions but unrealistic for the inner and outer walls of C-Mod. This model is not an accurate representation of all the measured plasmas but is used to assess the potential effects. Simulations including the SOL without collisional damping effects show no difference in X-ray count rate at ¯ne ∼ 5 × 10¹⁹
m−3. At 1.5×10²⁰m−3 there is a reduction in count rate by a factor of 2-5 for the simulations
including the SOL as compared to those without a SOL. This clearly does not fully account for the discrepancy between the simulated and experimental data points at high density, although the trend is in the right direction.
A two dimensional SOL profile, for which the density scale length, σn, is a function of
poloidal angle, has also been implemented in GENRAY. As compared with the 1-D SOL model, the 2-D model shows slightly better agreement with the experimental data at 800 kA although the agreement is worse at 1.1 MA with the 2-D SOL as compared to the 1-D SOL. The 2-D SOL model also includes the C-Mod vacuum vessel geometry and reflects rays that intersect the metallic surfaces of the vessel. Figure 16 shows the ray trajectories for a high density (¯ne ∼ 1.5 × 10²⁰) discharge with the 2-D SOL model. Although shifts of
k|| that occur in the SOL reduce the predicted x-ray emissivity, the experimental data are
still several orders of magnitude below that predicted by CQL3D. Therefore, there must be an additional mechanism or mechanisms responsible for the discrepancy.
B. Collisional Absorption in the SOL
The simulations previously discussed do not include any contribution of damping in the SOL calculated by GENRAY. The collisional absorption of the LH waves can be strong in regions of high density and low temperature (Te <∼ 10 eV). At temperatures above ∼ 10 eV
the damping is small even at high density. Collisional damping is estimated following the approach in [23], where the electron mass, me, is replaced with with me(1 + iνei/ω) in the
cold plasma dispersion relation, where νei is the effective electron-ion momentum collision
frequency.
By including the effect of power absorbed in the SOL due to collisional damping, the x-ray emissivity at high density is reduced significantly [24]. (See Figure 17.) The agreement be-tween experimental data and predictions from CQL3D is improved across the entire density range, although the agreement is most improved at 1.5 × 10²⁰ m−3 where the discrepancy
0.6 0.8 1 −0.5 −0.4 −0.3 −0.2 −0.1 0 0.1 0.2 0.3 0.4
n
e= 1.5
×
10
20[m
−3]
FIG. 16: Ray trajectories including a 2-D SOL model and reflections from the vacuum vessel. The
separatrix location is shown in red. σT(θ) is estimated on the basis of flux expansion.
was reduced from a factor of ∼ 100 − 1000 to a factor of ∼ 3 − 30.
It should be noted that the SOL parameters are identical for all of the simulation data points in Figure 17. The modeled temperature in the SOL decays exponentially with an e-folding length, σT, of 0.005 m until the temperature reaches a minimum of 5 eV, beyond
which the plasma temperature remains constant. These values are consistent with mea-surements of the SOL temperature profiles typically observed in C-Mod L-mode discharges. The density e-folding length varies between 0.1 m in the divertor regions and 0.02 m on the midplane. Again, these values are typical for L-mode discharges but are not exact representations of profiles in the discharges being modeled.
As already noted, collisional absorption in the SOL is sensitive to the specifics of both the temperature and density profiles. Since the absorption peaks in areas of low temperature
and high density, such as divertor regions, the exact path of the ray will determine the level of damping in the SOL. At a fixed density, the experimental x-ray emissivity is consistently weaker for the 5.4 T, 800 kA discharges with ¯ne above ∼ 8 × 10²⁰ m−3; however, the
simulation data does not show this same trend. This may be due to the sensitivity of the SOL absorption to the temperature and density profiles. Results from Alcator C [14] show an increase in current drive efficiency at higher magnetic field. The increase in efficiency was attributed to an increase in electron temperature at higher field. There may well be small differences in the SOL profiles as a function of plasma current and magnetic field, although in the discharges considered there are no profile measurements in the SOL. Still, the strong downward trend in x-ray emission as density increases suggests that a damping mechanism in the SOL that is roughly proportional to ne and inversely proportional to Te
may be largely responsible for the absence of fast electrons in the plasma.
Although collisional absorption does not by itself lead to a net driven current in the plasma, it is possible that the SOL currents discussed in Section II B may be due to asym-metric heating in the SOL. If the waves leaving the LH launcher deposit their energy pref-erentially in one direction along the field lines, this can cause a parallel thermal gradient, which in turn can drive a thermoelectric current along open field lines [17]. There is some inconsistency in this explanation. If a thermal gradient is responsible for driving the cur-rents in the SOL, then the region of plasma where the waves are absorbed through collisional damping would heat up. The collisional damping rate falls sharply as plasma temperature rises above ∼ 10 eV. Furthermore, measurements of Tein the divertors do not show a change
in temperature on either end of the field line during the application of LHCD.
This same reasoning suggests that it may be possible to “burn through” the observed density limit. If sufficient energy is deposited in the SOL, the temperature will rise and the collisional damping rate will fall, thereby increasing the amount of power absorbed on closed flux surfaces. This self-regulating mechanism could provide a means to ameliorate the density limit phenomenon, although if this is possible the critical power threshold is above 900 kW on C-Mod.
Another possible solution to the problem of LH wave absorption in the SOL may be to increase the temperature inside the separatrix through ion cyclotron resonance heating (ICRH) such that waves with reduced penetration to the core plasma are still absorbed before refracting back into the SOL. If the single-pass absorption is high for all rays, then
0.4 0.6 0.8 1 1.2 1.4 1.6 x 10²⁰ 103 104 105 106 107
n
e[m
−3]
Count Rate (Chords 9−24, 40−200 keV) [s
−1
]
Line Integrated HXR Count Rate
n ||=1.9, 5.4T, 800kA n ||=2.3, 5.4T, 800kA n ||=1.9, 7.0T, 800kA n ||=2.3, 7.0T, 800kA n ||=1.9, 5.4T, 1.1MA n ||=2.3, 5.4T, 1.1MA
FIG. 17: Fast electron bremsstrahlung emission predicted by GENRAY/CQL3D code package with a 2-dimensional SOL model including the effects of collisional damping in the SOL. The large symbols are simulation results while the small symbols are experimental data.
the loss in the SOL may be significantly reduced. Alternatively, dramatically increasing n||
while keeping the plasma temperature constant will increase single-pass absorption at the cost of overall current drive efficiency.
IV. IMPLICATIONS FOR LHCD IN H-MODE ON ALCATOR C-MOD
In general, H-mode discharges have considerably higher line averaged densities than L-modes. On C-Mod, H-modes with ne < 1.5 × 10²⁰ are extremely difficult to obtain, and
the highest peformance H-modes have ne > 2.0 × 10²⁰. Given that the density of H-mode
limit in H-mode is of considerable interest for the future application of LH current profile control on C-Mod.
When LHCD is applied to relatively low density, ¯ne < 2 × 10²⁰ m−3, low Zef f, ICRH
heated, H-mode plasmas on C-Mod, substantial changes occur in the plasma despite the fact that the density is above the limit described previously in this chapter. During the application of high power LHCD, the density profile relaxes, with a decrease in density at the top of the pedestal and an increase in density at the foot [25]. The temperature profile also changes, although in a different manner than the density profile. The temperature increases at the top of the pedestal but remains nearly constant at the pedestal foot. These complementary changes in the temperature and density result in a nearly unchanged pedestal pressure profile. The pressure at r/a < 0.6 increases by 10-15%. The temperature, density, and pressure profiles for an H-mode discharge before (0.95 s) and during (1.25 s) LHCD are shown in Figure 18.
The changes to the pedestal become more prominent as PN ET, the total heating power
(ICRH, LHCD, and ohmic) minus the radiated power, increases. Since the radiated power increases with Zef f, this effect has only been seen in clean discharges immediately following
a thorough boronization. Although PN ET includes the sum of all heating power, it should be
noted that this phenomenon has not been observed without a combination of both ICRF and LHCD. Figure 19 shows the changes in several key plasma parameters during an H-mode discharge that has a strong modification to the pedestal. Both the core and line averaged density decrease during the application of LHCD, but the core temperature increases. Radi-ation measured by the 2π bolometer also decreases when the LHCD is turned on. Although the HXR camera shows a considerable background count rate during the ICRF only portion of the H-mode, a clear increase can be seen during LHCD.
The change to the density pedestal has the effect of increasing density in the SOL, which allows for the LH waves to propagate further into the SOL. As the distance to the separatrix increases, the electron temperature decreases, allowing for stronger collisional absorption. At the same time, partial reflections from the impedance mismatch at the pedestal are reduced due to the decrease in the density gradient in the pedestal. The lower density also causes refraction to be less severe. The net effect of these competing trends is not immediately apparent, and must be addressed through examining the experimental data and comparing with models of the H-mode discharge in its unperturbed state (immediately prior to the
0 0.2 0.4 0.6 0.8 1 0 1 2 3x 10 20
n
e[m
−3]
0 0.2 0.4 0.6 0.8 1 0 2 4T
e[keV]
0 0.2 0.4 0.6 0.8 1 0 5 10x 10 4r/a
Pressure [Pa]
t = 0.95 [s] t = 1.25 [s]FIG. 18: Changes in H-mode density, temperature, and pressure profiles with the application of LHCD. Shot number = 1080306013.
application of LHCD) and in its perturbed state.
Figure 20 shows the HXR emission during several H-mode discharges modified by ∼ 900 kW of LHCD. The black points represent the H-mode discharges, all of which had an n|| of 2.33 at the launcher. The bremsstrahlung emission during these discharges was
significantly higher than for the high density L-modes at comparable line averaged density, however it should be noted that the background level prior to the application of LHCD was high due to the ICRF. Even after subtracting the background, as was done in Figure 20, the bremsstrahlung emission in H-mode is higher than even the 1.1 MA L-mode data at comparable densities.
The current drive for this discharge can be estimated based on the loop voltage because the plasma remains in steady state for a sufficient time for the current to redistribute. To
1 1.1 1.2 1.3 1.4 1.5 0 1000 2000
[W]
1 1.1 1.2 1.3 1.4 1.5 1 2 3x 10 20[m
−3
]
1 1.1 1.2 1.3 1.4 1.5 1 2 3[keV]
1 1.1 1.2 1.3 1.4 1.5 0 0.5 1Time [s]
[a.u.]
P LH P ICRF n e0 n e,avg Thomson T e0 ECE T e0 2π Bolometer HXR Chords 9−24FIG. 19: Low density H-mode with LH induced pedestal modification. Te and HXR emission
increase during the application of LHCD while ne and radiated power decrease. Shot number =
1080306013.
estimate the amount of current driven, it is necessary to consider not just the relative change in loop voltage, Vl(t1)/Vl(t2), but also the change in resistivity due to temperature.
η(t2) η(t1) = µ T (t1) T (t2) ¶3 2 (3) The loop voltage changes from -1.05 V before 1.1 s to a steady -0.6 V between 1.2 and 1.4 s for a relative change of 0.57. The core temperature measured by Thomson Scattering increases from 2 keV to 2.75 keV, corresponding to a relative change in η of 0.62. The
change in Vl can be attributed almost entirely to the increase in plasma temperature, not
due to direct current driven by the LH waves. Although this analysis shows that little or no current is directly driven by LHCD in this discharge, the changes in the plasma discussed above prove that LHCD applied to H-modes can have a substantial positive effect even above the observed density limit for L-modes.
A subtle difference in the penetration of the rays into the core plasma can be seen, with the modified profile showing that more rays penetrate into the core plasma. However, it is clear in both cases that many rays do not penetrate directly to the core. This of course does not take into account the propagation of the waves through the SOL, which must be included to accurately represent the experiment. When the SOL is included in the model, the ray trajectories dwell considerably outside the separatrix both before and after the profiles are modified by LHCD. As with the high density L-mode discharges, even rays that are not trapped outside the separatrix do not penetrate far into the core plasma.
The discrepancy between experimental data and the predictions from CQL3D is smaller for H-mode than for L-mode, even with no SOL model or collisional damping included in GENRAY, as seen in Figure 20. This suggests that the density limit is sensitive to the specifics of the SOL profiles as opposed to a simple “critical density.” Figure 20 also shows the results of simulations with a 2-D SOL model including collisions compared with the experimental results. As with the L-mode discharges, including both the SOL and collisional damping improves agreement between the experiment and the simulations considerably.
V. DISCUSSION AND CONCLUSIONS
Experimental observations of fast electron bremsstrahlung emission shows that the fast electron population in L-mode plasmas is significantly reduced at line averaged densities above 1 × 10²⁰ m−3. Electric currents measured in the SOL rise sharply at approximately
the same density. Taken together, this suggests that the LH waves are depositing their energy outside the separatrix. “Density limits” for effective LHCD have been observed on previous experiments, although the expected limit on C-Mod is significantly higher than the observed limit.
Explanations for the previously observed density limits, such as PDI and accessibility criterion violation, disagree with the phenomenology of the C-Mod limit. The sudden drop
0.4 0.6 0.8 1 1.2 1.4 1.6 1.8 x 10²⁰ 103 104 105 106 107
n
e[m
−3]
Count Rate (Chords 9−24, 40−200 keV) [s
−1
]
Line Integrated HXR Count Rate
n ||=1.9, 5.4T, 800kA n ||=2.3, 5.4T, 800kA n ||=1.9, 7.0T, 800kA n ||=2.3, 7.0T, 800kA n ||=1.9, 5.4T, 1.1MA n ||=2.3, 5.4T, 1.1MA 600 kA H−moden ||=2.3
CQL3D
No SOL
CQL3D
2D SOL
w/ Collisions
FIG. 20: HXR emission as a function of line averaged density during H-mode. Small black data points show experimental data in H-mode, while large black data points represent simulated emis-sion from GENRAY/CQL3D with 2-D SOL model including colliemis-sional absorption.
in fast electrons at high density are not predicted by conventional ray tracing/Fokker-Planck models. By adding the effects of collisional absorption in the SOL to these models the agreement with experiment at high density is significantly improved. Based on interpretation of the modeling results, the loss of fast electrons at high density is caused by a confluence of several effects. The high density prevents waves from penetrating deep into the hottest part of the plasma and also lowers the overall temperature of the plasma. This further reduces single pass absorption, which is weak even at low density for n|| ≤ 2.33. When
combined with an edge loss mechanism the weak damping inside the separatrix leads to more transits of the rays to the edge, resulting in the absorption of wave power outside the separatrix via collisional damping. The result can be mitigated by either reducing the edge
loss mechanism or increasing core damping. The increased temperature of H-mode plasmas strengthens core absorption although no experimental means of eliminating the edge losses has yet been identified on C-Mod short of operating at lower density.
Increasing the electron temperature on closed flux surfaces, particularly in the outer part of the plasma (r/a > 0.7), may increase single pass absorption in L- and I-mode discharges, thereby reducing parasitic edge losses incurred after the first pass. Also, the temperature and density profiles in the SOL can be adjusted by varying the connection length in the SOL and the plasma topology. Future experimental work will focus on these avenues of research along with better characterization of the driven current profile with stationary plasma profiles.
These results highlight the importance of treating the edge and core propaga-tion/absorption problems simultaneously. The disconnect between edge coupling, treated by coupling codes such as GRILL [26] or ALOHA [27], and core propagation/absorption, treated by traditional ray tracing/Fokker-Planck codes such as GENRAY/CQL3D, must be bridged and the two problems treated together. Recent advances in full wave simulations with codes such as TORIC-LH [28, 29] and COMSOL [30, 31] allow proper treatment of both edge coupling (including penetration through the pedestal) and core propagation/absorption in a seamless manner. It is imperative to consider not only the power leaving the antenna, but the power actually absorbed on closed flux surfaces when simulating tokamak plasmas in the low single pass absorption regime.
Acknowledgments
The authors would like to thank the C-Mod LHCD engineering team for their efforts in keeping the system running. The authors would also like to thank Dr. Brian LaBombard for providing the data from the divertor Langmuir probes. This work supported by USDOE awards DE-FC02-99ER54512 and DE-AC02-76CH03073.
[1] P. T. Bonoli, R. Parker, S. J. Wukitch, et al. Wave-Particle Studies in the Ion Cyclotron and Lower Hybrid Ranges of Frequencies in Alcator C-Mod. Fusion Science and Technology, 51(3):401–436, April 2007.
[2] I. H. Hutchinson, R. Boivin, F. Bombarda, et al. First results from Alcator C-MOD. Physics
of Plasmas, 1(5):1511–1518, 1994.
[3] G. M. Wallace, R. R. Parker, P. T. Bonoli, et al. Interaction of Lower Hybrid Waves with the Scrape Off Layer. APS Meeting Abstracts, November 2008.
[4] N. J. Fisch and A. H. Boozer. Creating an Asymmetric Plasma Resistivity with Waves.
Physical Review Letters, 45(9):720–722, Sep 1980.
[5] N. J. Fisch. Theory of current drive in plasmas. Reviews of Modern Physics, 59:175–234, January 1987.
[6] V. E. Golant. Plasma Penetration near the Lower Hybrid Frequency. Soviet Physics Technical
Physics, 16:1980, June 1972.
[7] F. Troyon and F.W. Perkins. Lower hybrid heating in a large tokamak. Proceedings of the 2nd
Topical Conference on RF Plasma Heating, Paper B4, June 1974.
[8] W. Hooke. Review of experiments on current drive in Tokamaks by means of RF waves.
Plasma Physics and Controlled Fusion, 26(1A):133–144, 1984.
[9] Y. Takase, M. Porkolab, J. J. Schuss, et al. Observation of parametric instabilities in the lower-hybrid range of frequencies in the high-density tokamak. Physics of Fluids, 28(3):983–994, 1985.
[10] M. Porkolab. Parametric instabilities due to lower-hybrid radio frequency heating of tokamak plasmas. Physics of Fluids, 20(12):2058–2075, 1977.
[11] M. Porkolab, S. Bernabei, W. M. Hooke, R. W. Motley, and T. Nagashima. Observation of parametric instabilities in lower-hybrid radio-frequency heating of Tokamaks. Physical Review
Letters, 38:230–233, January 1977.
[12] J. Liptac, R. Parker, V. Tang, Y. Peysson, and J. Decker. Hard x-ray diagnostic for lower hybrid experiments on Alcator C-Mod. Review of Scientific Instruments, 77(10):103504, 2006. [13] V. Pericoli-Ridolfini, E. Barbato, S. Cirant, et al. High Plasma Density Lower-Hybrid Current
Drive in the FTU Tokamak. Physical Review Letters, 82(1):93–96, Jan 1999.
[14] M. Porkolab, J. J. Schuss, B. Lloyd, et al. Observation of Lower-Hybrid Current Drive at High Densities in the Alcator C Tokamak. Physical Review Letters, 53(5):450–453, Jul 1984. [15] G. Wallace, P. Bonoli, A. Parisot, et al. Lower Hybrid Coupling Experiments on Alcator
C-Mod. Proceedings of the 17th Topical Conference on Radio Frequency Power in Plasmas,
[16] R. Cesario, A. Cardinali, and C. Castaldo. Lower Hybrid Current Drive at ITER-relevant high
plasma densities. RADIO FREQUENCY POWER IN PLASMAS: 18th Topical Conference
on Radio Frequency Power in Plasmas, 2009.
[17] P.C. Stangeby. The plasma boundary of magnetic fusion devices. Institute of Physics Pub-lishing, 1999.
[18] B. Labombard, J. A. Goetz, I. Hutchinson, et al. Experimental investigation of transport phenomena in the scrape-off layer and divertor. Journal of Nuclear Materials, 241-243:149 – 166, 1997.
[19] B. LaBombard, J. E. Rice, A. E. Hubbard, et al. Transport-driven Scrape-Off-Layer flows and the boundary conditions imposed at the magnetic separatrix in a tokamak plasma. Nuclear
Fusion, 44:1047–1066, October 2004.
[20] R. McWilliams, E. J. Valeo, R. W. Motley, W. M. Hooke, and L. Olson. Steady-State Currents Driven by Collisionally Damped Lower-Hybrid Waves. Physical Review Letters, 44(4):245–248, Jan 1980.
[21] R. W. Harvey and M. McCoy. The CQL3D Fokker-Planck Code. Proceedings of the IAEA
Technical Committee Meeting on Simulation and Modeling of Thermonuclear Plasmas, pages
489–526, 1992.
[22] A. P. Smirnov and R.W. Harvey. Bulletin of the American Physical Society, 40:1837, 1995. [23] Paul T. Bonoli and Ronald C. Englade. Simulation model for lower hybrid current drive.
Physics of Fluids, 29(9):2937–2950, 1986.
[24] G.M. Wallace, R.R. Parker, P.T. Bonoli, et al. Observations of Lower Hybrid Wave Absorp-tion in the Scrape Off Layer of a Diverted Tokamak. RADIO FREQUENCY POWER IN
PLASMAS: 18th Topical Conference on Radio Frequency Power in Plasmas, 2009.
[25] J.W. Hughes et al. Nuclear Fusion, 2010.
[26] M. Brambilla. Slow-wave launching at the lower hybrid frequency using a phased waveguide array. Nuclear Fusion, 16:47–54, February 1976.
[27] J. Hillairet, D. Voyer, B. Frincu, O. Meneghini, A. Ekedahl, and M. Goniche. Modeling of lower hybrid antennas using the aloha code and comparisons with tore supra experiments.
Fusion Engineering and Design, 84(2-6):953 – 955, 2009. Proceeding of the 25th Symposium
on Fusion Technology - (SOFT-25).
propagation and absorption of lower hybrid waves. Physics of Plasmas, 16(7):072502, 2009. [29] J.C. Wright, MIT-PSFC, and RF-SciDAC Team. Full wave simulations of lower hybrid wave
propagation in tokamaks. RADIO FREQUENCY POWER IN PLASMAS: 18thTopical
Con-ference on Radio Frequency Power in Plasmas, 2009.
[30] O. Meneghini, S. Shiraiwa, and R. Parker. Full wave simulation of lower hybrid waves in maxwellian plasma based on the finite element method. Physics of Plasmas, 16(9):090701, 2009.
[31] S. Shiraiwa, O. Meneghini, R. Parker, G. Wallace, and J. Wilson. Plasma wave simulation based on versatile FEM solver on Alcator C-Mod. RADIO FREQUENCY POWER IN