Constraints on oxygen fugacity within metal capsules
The MIT Faculty has made this article openly available.
Please share
how this access benefits you. Your story matters.
Citation
Faul, Ulrich H., et al. “Constraints on Oxygen Fugacity within Metal
Capsules.” Physics and Chemistry of Minerals, vol. 45, no. 6, June
2018, pp. 497–509.
As Published
https://doi.org/10.1007/s00269-017-0937-7
Publisher
Springer Berlin Heidelberg
Version
Author's final manuscript
Citable link
http://hdl.handle.net/1721.1/116932
Terms of Use
Article is made available in accordance with the publisher's
policy and may be subject to US copyright law. Please refer to the
publisher's site for terms of use.
(will be inserted by the editor)
Constraints on Oxygen Fugacity within Metal
Capsules
Ulrich H. Faul · Christopher J. Cline II · Andrew Berry · Ian Jackson · Gordana Garapi´c
Received: date / Accepted: date
Abstract Experiments were conducted with olivine encapsulated or wrapped in five different metals (Pt, Ni, Ni70Fe30, Fe, Re) to determine the oxygen fugacity in the interior of large capsules used for deformation and seismic property ex-periments. Temperature (1200◦C), pressure (300 MPa) and duration (24 h) were chosen to represent the most common conditions in these experiments. The oxygen fugacity was determined by analysing the Fe content of initially pure Pt particles that were mixed in with the olivine powder prior to the experiments. Oxygen fugacities in the more oxidizing metal containers are substantially below their re-spective metal-oxide buffers, with the fO2of solgel olivine in Ni about 2.5 orders of magnitude below Ni-NiO. Analysis of olivine and metal blebs reveals three different length-, and hence diffusive time-scales: 1. Fe loss to the capsule over ∼ 100 µm, 2. fO2 gradients at the sample-capsule interface up to 2 mm into the sample, and 3. constant interior fO2values with an ordering corresponding to the capsule ma-terial. The inferred diffusive processes are: Fe diffusion in olivine with a diffusivity U. Faul
Earth Atmospheric and Planetary Sciences, Massachusetts Institute of Technology, Cambridge, MA, USA E-mail: [email protected] ORCID: 0000-0001-5036-4572
Also at: Research School of Earth Sciences, Australian National University, Canberra, Aus-tralia
C. Cline · A. Berry · I. Jackson
Research School of Earth Sciences, Australian National University, Canberra, Australia G. Garapi´c
∼ 10−14 m2/s, diffusion possibly of oxygen along grain boundaries with a diffu-sivity ∼ 10−12 m2/s, and diffusion possibly involving pre-existing defects with a diffusivity ∼ 10−10m2/s. The latter, fast adjustment to changing fO2may consist of a rearrangement of pre-existing defects, representing a metastable equilibrium, analogous to decoration of pre-existing defects by hydrogen. Full adjustment to the external fO2 requires atomic diffusion.
Keywords oxygen fugacity · olivine defects · diffusion · upper mantle
1 Introduction
1
It has long been recognized that the redox state of Earth’s upper mantle is a
2
key parameter for models of its origin and evolution (e.g. O’Neill and Wall (1987);
3
Wood et al. (2009)). It affects the solidus in upwelling regions of the mantle, as well
4
as the composition of the resulting melts and fluids (Ballhaus et al. 1991; Kelley
5
and Cottrell 2009; Cottrell and Kelley 2011). Equally important is the oxidation
6
state of C-O-H fluids in continental lithospheric mantle (Frost and McCammon
7
2008). For olivine, the oxygen fugacity (fO2) determines the abundance of ferric
8
iron, which is inferred to be a key defect that affects physical properties such as
9
rheology (Kohlstedt and Mackwell 1998) and electrical conductivity (Karato 2011;
10
Yoshino and Katsura 2013; Tyburczy and Du Frane 2015). Since olivine dominates
11
the physical properties of the upper mantle, understanding its defect chemistry as
12
a function of fO2is an important factor for the understanding of its dynamics.
13
In experiments control of fO2is frequently approached by encapsulating
sam-14
ples in metal capsules, with or without deliberate addition of the corresponding
15
metal oxide. It is usually assumed that the fO2 of the sample interior is buffered
16
by the respective metal-metal oxide equilibrium, supported by the observation of
17
the oxide at the contact between capsules and sample (Hirth and Kohlstedt 1995;
18
Mei and Kohlstedt 2000; Wang et al. 2004; Tasaka et al. 2015).
19
While the fO2in the interior of capsules that contain mostly melt or partially
20
molten samples has been experimentally assessed (Jamieson et al. 1992), this is not
usually done for completely solid charges. To our knowledge, no experiments have
22
been performed to determine the fO2in the relatively large samples (10 - 12 mm
23
diameter and 20 - 35 mm in length) commonly used for hotpressing, deformation
24
and seismic property experiments at pressures of 200 - 300 MPa and temperatures
25
up to 1300◦C (Karato et al. 1986; Paterson 1990; Hirth and Kohlstedt 1995;
Jack-26
son et al. 2002). However, possible differences in fO2 between interior and sample
27
edge of olivine enclosed by Fe jackets were discussed by Karato et al. (1986).
28
The experimental approach taken here is a variant of that used by Jamieson
29
et al. (1992) and Rubie et al. (1993). These authors inserted or wrapped Pt wire
30
around the experimental charges. Fe diffuses into this wire from the adjacent
31
olivine by an amount that depends on fO2. However, due to the relatively large
32
diameter of the wire, it represents a large sink for Fe and may not equilibrate
33
with solid charges at the temperatures and durations of typical experiments
(Ru-34
bie et al. 1993). In the experiments presented here, micron-sized Pt powder was
35
mixed with the olivine powders prior to equilibration at high temperature and
36
pressure. The Pt particles can then be analysed to produce fO2 transects through
37
the samlpes.
38
2 Experimental Approach
39
Two types of olivine were used in the experiments. The first type consists of
40
hand-picked and ground San Carlos (SC) olivine with a particle size of 2 - 10 µm
41
from the same batch that contained < 0.01 % melt in previous experiments (Faul
42
et al. 2004). The second type consists of Ti-doped Fo90 solgel olivine (Faul et al.
43
2016). The composition of the solgel material was designed to contain excess silica
44
and hence crystallize up to a few percent orthopyroxene (opx) to buffer the silica
45
activity (see Section 4). Prior to cold-pressing into pellets, Pt powder (1 % by
46
weight of the 2 g pellets) was added to both olivine types by ‘folding’ it through
47
the olivine powders using a spatula. This coarse mixing ensured the presence of
48
agglomerated Pt particles large enough for analyses (see below). Post-run imaging
shows that both types of olivine contain widely dispersed opx (see Section 3).
50
The main difference between the two sample materials is that San Carlos olivine
51
contains Ni, Cr and a range of other trace elements (e.g. de Hoog et al. (2010)).
52
The pellets were pre-fired at an fO2near the graphite-CO (CCO) buffer for 16
53
h at 1400◦C (i.e. at an fO2 0.2 log units below CCO), and subsequently kept in
54
a drying oven until loading. The cylindrical pellets measure 11.5 mm in diameter
55
and 5 mm in length (except 6876: 8 x 8 mm) and are completely surrounded by a
56
metal foil prior to insertion in a steel-jacketed assembly, as is done for deformation
57
or seismic property experiments. In experiments with multiple pellets, adjacent
58
metal-encapsulated pellets were separated by a 2 mm thick alumina disk which
59
served to chemically isolate the different samples. The configuration of a four pellet
60
experiment using as many different metal foils is shown in Figure 1. The mild steel
61
jacket surrounding alumina pistons and sample assemblies with a wall thickness of
62
0.5 mm is of the same batch as those used for deformation and seismic property
63
measurements in the ANU laboratory (e.g. Jackson et al. (2002); Faul and Jackson
64
(2007)).
65
All samples were hotpressed for 24 h at 1200◦C and 300 MPa in a Paterson gas
66
medium apparatus with Ar as the pressure medium. A mild steel jacket excludes
67
the Ar pressure medium from sample assembly and alumina pistons (Figure 1,
68
Paterson (1990)). The temperature uncertainty was estimated as ± 10◦C along
69
the length of the sample assembly from regular furnace calibrations. An exception
70
is 6876 for which post experimental calibration showed a temperature gradient
71
possibly as large as 80◦C. Post-run examination shows that the metal foils become
72
welded at their touching points (i.e. the original interface can no longer be located
73
in SEM images) and completely encapsulated the individual pellets without gaps.
74
Table 1 summarizes the experiments and sample types.
75
Experiment 6707 was conducted to investigate the influence of direct contact
76
between sample and Pt for water retention. For this purpose, two separate solgel
77
pellets were wrapped in either Ni or Ni70Fe30 foil prior to insertion into a Pt
SC olivine Ti-SG olivine Ti-SG olivine Ti-SG olivine
Pt foil & disks
Ni foil & disks
Ni70Fe30 foil & disks
Fe foil & disks Al2O3 disk
mild steel jacket
Thermocouple
Fig. 1 Schematic of the assembly for experiment 6846 with four different metal enclosures of either Ti-doped solgel (SG) or San Carlos (SC) derived olivine pellets. The thermocouple is shown at the top. The height of the samples plus Al2O3 disks is about 38 mm; furnace calibrations were conducted over 45 mm to a temperature difference < 5◦C. The two samples of run 6861 were similarly separated by an Al2O3 disk.
capsule that was then welded shut. Experiment 6805 was conducted to investigate
79
water retention in capsules welded prior to insertion and pressurisation, compared
80
to capsules where the foils where not welded prior to insertion. In this experiment,
81
one pellet was welded, whereas the second was surrounded on three sides by Pt,
82
but left in direct contact with the alumina disk at the bottom. The observations
83
are discussed in Section 6.
84
Following hotpressing, the pellet stacks were sectioned axially, mounted in
85
epoxy and polished with diamond, alumina and colloidal silica. Additionally,
dou-86
bly polished thick sections (∼ 400 µm) were prepared for infrared spectroscopy of
87
the Pt and Ni encapsulated samples.
88
The samples were analysed by standardised energy dispersive spectrometry
89
using a Hitachi 4300 field emission SEM at the Centre for Advanced Microscopy
Table 1 Summary of Experiments
Experiment Metal Foil Sample Mg#a Mg#b fO2
thickness, mm type int. bleb log10(bars)c
6780 Pt 0.18/0.15d solgel 89.6((5) 89.7(3) -9.5 6846 Pt 0.18/0.15 SC 90.3(2) 90.5(4) -8.7 Ni 0.07 solgel 89.5(2) 90.0(4) -10.3 Ni70Fe30 0.07 solgel 89.7(5) 90.2(7) -11.1 Fe 0.10 solgel 89.8(2) 91.5(7) -11.9 6861 Ni 0.07 SC 90.1(1) 90.5(4) -9.9 Fe 0.10 SC 90.0(1) 92.6(3) -11.4 6876 Re 0.07 solgel 89.8(1) 90.2(6) -11.2
6707 Pt+Ni, Pt+NiFe 0.18+0.07 solgel n.d. n.d. n.d.
6805 Pt, Pt open 0.18 solgel n.d. n.d. n.d.
All pellets were fired at 1400◦C for 16 hours with a gas mix consisting of 50%CO and 50% CO2. All experiments were conducted at 1200◦C and 300 MPa for 24 hours.
aInterior, far from metal blebs, average of 10 analyses for most samples. b Next to metal blebs, average of 5 analyses.
c Interior fO
2, calculated from metal blebs and adjacent olivine compositions. Average of at least 6 different blebs with at least three analyses for each bleb, Kessel et al. (2001) activities.
d
Sides/end disks.
at the Australian National University with an acceleration voltage of 15 kV. The
91
beam current (0.6 nA) was measured at regular intervals in a Faraday cup.
Stan-92
dards included oxides as well as pure metals; the latter were checked as part of the
93
analytical sessions. Additional analyses were performed using a JEOL-JXA-8200
94
electron microprobe at MIT with an acceleration voltage of 15 kV, a beam
cur-95
rent of 10 nA and a beam diameter of ∼ 1 µm. Counting times were 20-40 s per
96
element, resulting in counting precisions of 0.5-1.0% 1-sigma standard deviations.
97
The raw data were corrected for matrix effects with the CITZAF program
(Arm-98
strong 1995). Analyses of metal alloy blebs were also performed using a TESCAN
99
Vega 3 SEM with a Lab6 filament and an Oxford XMax50 EDS detector at SUNY
100
New Paltz, at 15 kV.
101
3 Analytical Approach
102
Compositional gradients from the deep sample interior towards the sample-capsule
103
interface may have different spatial scales. For example, Fe gradients adjacent to
Pt capsules in polycrystalline olivine without interconnected fluid phase extend
105
over tens of microns (Watson 1991), requiring spacing of analyses of that order.
106
With sample diameters of 10-12 mm, gradients of the order of hundreds of microns
107
also need to be resolved. In order to calculate fO2fully quantitative point analyses
108
are necessary. Therefore analyses of metal alloy blebs and adjacent olivine were
109
performed in a transverse band near the middle of each cylindrical pellet up to the
110
sample edges with a spacing of 0.1 to 0.5 mm. Additionally, olivine in the interior
111
far from any metal blebs was analyzed to document any Fe depletion adjacent to
112
the metal blebs. At the sample-capsule interface, olivine was analysed at closely
113
spaced (10 µm) points over 150 µm. The analyses were continued with the same
114
spacing for 50 µm into the metal capsules to observe any diffusive gradients there.
115
Due to diffusion of Fe into some of the metal foils from the jackets, axial traverses
116
from sample into foil against the Al2O3disks were also performed. The analytical
117
approach is shown schematically in Figure 2.
118
Fig. 2 Backscattered electron image of the sample-capsule interface of a solg-gel olivine sam-ple in a Ni capsule (white/overexposed at left) showing schematically the analysis points for closely-spaced line-scans across the sample-capsule interface to determine diffusive Fe loss (dot-ted line). Circles schematically indicate analyses of alloy blebs and adjacent olivine. The latter are distributed in a centrally located radial band with a spacing as regular as possible, with a wider spacing in the interior.
Limited mixing results in agglomerated Pt particles that form blebs that are
119
about 10 µm as the smallest dimension of the often elongate shapes (Figure 3).
Usually blebs larger than about 5 µm were analysed. Typically three to four
anal-121
yses per bleb were averaged.
122
San Carlos ol. in Pt Sol Gel ol. in Ni
PtFe
Fig. 3 Backscattered electron images of PtFe alloy blebs from two samples. Olivine shows minor orientation contrast. Red arrows indicate small orthopyroxene grains, confirming opx saturation. The blebs are randomly distributed throughout the samples; those larger than about 5 µm were used for analysis.
4 Pt as Oxygen Fugacity Sensor
123
Petrologists noted early on that Fe loss occurred if Fe bearing samples were in
124
contact with Pt metal (e.g. Bowen and Shairer (1932); Jaques and Green (1980);
125
Grove (1981) and references therein). Fe (and Ni) uptake by Pt is a consequence
126
of the solid solution between Pt and Fe(Ni). Pure Pt is therefore not in chemical
127
equilibrium with Fe(Ni)-bearing olivine. The composition of the resulting PtFe(Ni)
128
metal alloy can be used to determine fO2based on metal concentrations (activities)
129
in the alloy and olivine (Jamieson et al. 1992; Rubie et al. 1993; O’Neill et al. 2003).
130
Equilibration of Pt with an Fe-bearing silicate allows calculation of the fO2 of
131
the system from the equilibrium (Rubie et al. 1993):
132
With the law of mass action the equilibrium constant for this reaction is: 133 k2= (ametFe )2aO2aSiO2 aol Fe . (2)
Equating the activity of oxygen aO2, with fO2, and taking the log10of Equation 134
2:
135
log(fO2) = log(aolFe) − 2log(ametFe ) − log(aSiO2) + log(k2) (3)
The activity of Fe in the PtFe alloy is given by ametF e = γF emetXF emet, where XF emet
136
is the mole fraction of Fe in the alloy and γF emet is the activity coefficient of Fe.
137
Similarly, the activity of the fayalite component in olivine on two sites per formula
138
unit is obtained from: aolF e= (γF eolXF eol)2 (Grove 1981; O’Neill et al. 2003).
139
In order to apply Equation 1 to Mg-bearing olivine a regular solution model was
140
chosen with an interaction parameter WM g−F eol that is assumed to be independent
141
of temperature and pressure for the experimental conditions (Jamieson et al. 1992;
142
O’Neill et al. 2003). Further, pyroxene is treated as an ideal solution. While this
143
is an approximation, Jamieson et al. (1992) noted that using different data for the
144
equilibria involving olivine and pyroxene resulted in only small differences in the
145
calculated fO2.
146
By contrast, the calculated fO2is particularly sensitive to the Fe content
(activ-147
ity) of the PtFe alloy and its chosen activity model. Earlier work used the
activity-148
composition relationship of Heald (1967) for the PtFe alloy. Kessel et al. (2001)
149
cited problems with this earlier approach, for both experimental/analytical as well
150
as theoretical reasons. The largest differences between the methodology of Kessel
151
et al. (2001) and Heald (1967) occur at low Fe contents in the alloy (oxidizing
152
conditions) as the PtFe system shows a strong negative deviation from ideality at
153
relatively high Pt contents. Additionally, differences between the studies increase
154
with decreasing temperature, as the expression of Heald (1967) is
temperature-155
independent. The activity-composition relationship derived by Kessel et al. (2001)
156
for an asymmetric regular solution of the PtFe alloy is given as:
lnγF emet= [W1+ 2(W2− W1)XF emet](XP tmet)2/RT (4)
with constants (Margules parameters) W1 = 138 kJ/mol and W2 = 90.8 kJ/mol.
158
The activity of silica, aSiO2, can be calculated from the reaction: 159 Mg2SiO4+ SiO2= Mg2Si2O6 (5) log(aSiO2) = ∆G0(5) ln(10)RT+ log(a opx Mg) − log(a ol Mg) (6)
Since the Mg endmembers are the major components of the system, their activities
160
are close to unity. The silica activity (in J/mol) as a function of pressure and
161
temperature is then given by:
162
log(aSiO2) = −(6710 + 0.31T + 0.375P)/ln(10)RT (7)
where P is in bar and T in K (O’Neill and Wall 1987). The free energy of reaction
163
1, ∆G0(1) = −RTln(k2), as a function of pressure and temperature is given by (in
164
J/mol; Rubie et al. (1993)):
165
∆G0(1)(P, T) = 5.65x10⁵− 144T − 0.866P. (8)
Thus, equation 3 becomes:
166
log(fO2) = 2log(γFeol) − 2log(γFemet) + 2log(XolFe/XmetFe ) − log(aSiO2) − ∆G
0
(1)(P, T)/ln(10)RT. (9)
The activity coefficient of Fe in olivine is calculated from:
167 ln(γolFe) = (1 − X ol Fe) 2 (600 + 0.0013P)/T (10)
(Rubie et al. 1993). With different parameterisations for silica activity (Eq. 7; e.g.
168
Holland and Powell (1989)) or ∆G0(1) (Eq. 8; O’Neill et al. (2003)) the calculated
169
fO2changes by less than 0.3 log units.
170
4.1 Defects
171
An important aspect of Equation 1 is that the diffusion of Fe from sample to
172
capsule releases oxygen, which changes the oxidation state of the sample (Merill
173
and Wyllie 1973). The O2released by Fe loss can react with olivine and pyroxene
174
in a transfer reaction (c.f. Dohmen and Chakraborty (2007), Eq. 5a):
175 3 FexM+ FeSiO3+ 1 2O2= V 00 M+ 2 Fe • M+ Fe2SiO4. (11)
where in Kr¨oger-Vink notation VM00 represents an M-site vacancy, and Fe • M
repre-176
sents Fe3+on an M-site. This reaction increases the concentration of the majority
177
defects in the charge neutrality condition (Stocker and Smyth 1978; Nakamura
178
and Schmalzried 1983; Kohlstedt and Mackwell 1998):
179
[ Fe•M] = 2[V
00
M]. (12)
The opx produced by Fe loss (Equations 1 and 5) may thus be offset by increasingly
180
non-stoichiometric olivine.
181
A second transfer reaction involves Fe3+ both on the tetrahedral (Fe0Si) and
182
octahedral (Fe•M) sites (Eq. 5b of Dohmen and Chakraborty (2007)):
183 FexM+ SixSi+ 1 2O2+ 1 2Fe2SiO4= Fe • M+ Fe 0 Si+ 3 2SiO2. (13) Nakamura and Schmalzried (1983) assumed full association of Fe•M and Fe
0
Si, but
184
in the model of Tsai and Dieckmann (2002) these two defects are not coupled. The
185
charge neutrality condition is therefore expanded to:
[ Fe•M] = 2[V
00
M] + [Fe
0
Si]. (14)
At low fO2 the charge neutrality condition may involve electrons (Kohlstedt
187 and Mackwell 1998): 188 [ Fe•M] = [e 0 ]. (15)
The point defect models developed by Nakamura and Schmalzried (1983) and
189
Tsai and Dieckmann (2002) can be used to calculate concentrations of Fe3+ from
190
the composition of olivine and fO2 derived in the previous section. With the
191
model of Nakamura and Schmalzried (1983) for the case where Fe0Si is
negligi-192
ble (i.e. charge neutrality condition Equation 12, and Equation 7a of Dohmen and
193
Chakraborty (2007), see also Gaetani (2016)):
194
log[ Fe•M] = 1
6(log(K) + 2log(2) + 4log(X ol
Fe) + log(fO2) + log(aSiO2)) (16)
with reaction constant K calculated using equations 16 or 17a from Dohmen and
195
Chakraborty (2007), and aSiO2 calculated from Equation 7. 196
Including Fe0Si, the model of Tsai and Dieckmann (2002) predicts that this
197
defect becomes more abundant than Fe•M at relatively high fO2 (Dohmen and
198
Chakraborty 2007). The defect concentrations [V”M], [Fe •
M] and [Fe
0
Si] can be
cal-199
culated for case 6 of Dohmen and Chakraborty (2007) with their equation 18 and
200
parameters from their Table 2.
201
The absolute Fe3+content calculated from the concentrations above is obtained
202 from 203 Fe3+= ([Fe • M] + [Fe 0 Si]) 2Xol Fe Fet (17)
where Fetwas determined by EDS or WDS analysis (i.e. all Fe counted as FeO).
5 Analytical Results
205
Several aspects were considered for the analysis of olivine and metal blebs. While
206
a minimum size for quantitative analysis of a few microns is necessary, the blebs
207
were also intended to be small enough so that they can equilibrate diffusively with
208
the surrounding olivine. This implies that the olivine near the blebs should not
209
be Fe-depleted. A rough calculation shows that depleting a volume of olivine to
210
account for the observed Fe content in the metal particles by less than the standard
211
deviation of the olivine analyses requires a volume of olivine with a radius at least
212
three times that of the particles (see also diffusion distances at the sample-capsule
213
interface below). The analyses show that olivine compositions near the blebs in all
214
but the Fe-enclosed samples were within one standard deviation of the olivine far
215
from any blebs (Table 1). The slight Fe depletion of olivine adjacent to the blebs
216
in Fe capsules is probably due to the higher amount of Fe in equilibrium with Pt
217
at this low fO2. Ni is also depleted adjacent to the blebs and capsule for Pt and
218
Fe encapsulated San Carlos olivine.
219
No opx rind is observable at the contact between samples and Pt and Ni foils.
220
Topography of the blebs and fluorescence of the metal limits the proximity of the
221
(olivine) analyses points near the blebs, as well as identification of a possible
sub-222
micron opx rind. While all samples contain rounded pores, as is usually the case at
223
this pressure (Jackson et al. 2002; Faul et al. 2004), these are randomly distributed
224
along grain boundaries and as grain-interior inclusions. Near the edge (< 100 µm)
225
of Pt-enclosed samples triangular-shaped pores at three-grain edges may indicate
226
a locally connected porosity. The Re enclosed sample remained fine-grained and
227
showed a high porosity, with pores randomly distributed.
228
Averaged from all analyses for all samples, San Carlos olivine in the interior has
229
a slightly higher Mg-number of 90.2±0.17, compared to solgel olivine (89.7±0.36).
5.1 Fe gradients at the Sample-Capsule Interface
231
Analyses of olivine at the sample-capsule interface are shown in Figure 4 and
232
indicate significant loss of Fe to both Pt and Ni capsules. In M-site mole fractions,
233
Fe decreases from ∼ 0.1 in the interior to below 0.02 at the interface (i.e. an olivine
234
Mg# above 98), with lower values adjacent to Ni capsules compared to Pt capsules
235
at the same distance from the interface. Fe depletion in Pt-enclosed olivine extends
236
approximately 130 µm into the sample, while in Ni foils the loss profile extends
237
only to about 60 µm, indicating higher diffusivities of Fe in olivine within Pt
238
capsules. Repeat analyses with WDS and EDS yield essentially identical results.
239
The higher Fe content in the Pt capsule adjacent to solgel olivine is consistent
240
with a somewhat lower fO2compared to San Carlos olivine. These compositional
241
differences between the two sample types are also observed in the interior (see
242 Section 5.3). 243 Position, micron -100 -50 0 50 100 150 Fe, mol % 0 2 4 6 8 10 12 SC - Ni SC - Pt(E) SG - Pt SC - Pt(W) SC - Fe a SG - NiFe Position, micron -50 0 50 100 150 200 SC - Ni SG - Ni SC - Ni (Fe+Ni) SG - Ni (Fe+Ni) b capsule sample
Fig. 4 Iron concentration gradients across the sample-capsule interface in different metal capsules. The interface is at zero µm, negative values indicate analyses in the capsule (shown in gray). (a) Comparison of all capsule materials. The Pt encapsulated San Sarlos sample was analysed by both microprobe (WDS) and a FESEM (EDS). Fe depletion extends ∼ 130 µm into the sample in the Pt capsule, but only about 60 µm in Ni capsules. (b) Compositions in Ni-capsules. The small circles show the sum of Ni and Fe for the same analyses as the larger squares for Fe only. Cracks and metal blebs at the sample - capsule interface leads to some scatter in compositions (c.f. Figure 2), resulting in some cases in low totals for the analyses. Analyses for Re capsule are not shown, the olivine composition does not change leading up to the capsule.
The Pt capsules show a Fe diffusion profile, with the concentration of Fe
de-244
creasing to zero within about 70 - 80 µm. By contrast the Fe concentration in Ni
245
capsules with a foil thickness of 70 µm is nearly constant across the capsule (for
246
analyses adjacent to the Al2O3 disks). This indicates that diffusion of Fe in Ni as
247
well as Pt is faster than in olivine, and Fe uptake in the capsule is controlled by
248
Fe diffusion in olivine to the interface (Watson 1991). Rubie et al. (1993) similarly
249
observed a Fe concentration gradient in both wire and olivine (their Figure 7).
250
Fe concentration profiles in olivine adjacent to Ni capsules indicate a step
251
function-like change in composition. However, Ni diffuses from the capsule into
252
olivine such that olivine adjacent to the capsule contains more than 5 wt. % NiO.
253
When Ni and Fe are added, a smooth diffusion profile is observed (Figure 4b). The
254
interface is therefore characterized by counterdiffusion of Fe and Ni.
255
Within the detection limit of the WDS analyses, Fe-encapsulated San Carlos
256
olivine next to the capsule shows a complete loss of Ni, as well as Fe enrichment
257
more than 100 µm into the sample (Figure 4a). No significant change in olivine
258
composition was observed in Ni70Fe30 foils, indicating near equilibrium with Fo90
259
olivine. Similarly, no change in composition is measurable for olivine in Re foil,
260
and no measurable Fe was detected in the foil.
261
The Fe concentration gradients in both capsule and olivine also give an
indi-262
cation of the diffusion distances involved in the equilibration of the initially pure
263
Pt particles with the surrounding olivine (see Section 5.3).
264
5.2 fO2 Gradients at the Sample-Capsule Interface
265
The metal alloy blebs dispersed in the samples allow direct determination of the
266
oxygen fugacity throughout the capsules. The spatial scale over which the
com-267
position of the metal blebs changes from the interface to the interior is about one
268
order of magnitude larger in comparison to that of Fe diffusion out of olivine. For
269
Pt-encapsulated olivine the molar Fe content of the metal blebs, shown in Figure
270
5a, decreases from the interior towards the capsule across the outermost 2 mm
of radius. Ni-encapsulated samples show a similar decrease within the outermost
272
0.4 mm. An increase of the Fe concentration within the blebs towards the capsule
273
is observed in NiFe and Fe capsules across an outer rim <1 mm thick. As is
em-274
phasized by plotting olivine compositions adjacent to the blebs in Figure 5a, this
275
change in metal alloy composition occurs at constant olivine composition.
0.1 0.2 0.3 0.4 0.5 0.6
Fe, Mole Fraction
SG Pt SC Pt SG Ni SC Ni SG NiFe SC Fe 0 1 2 3 4 5 6 7 8
Distance from edge, mm -12 -10 -8 -6 -4 Log 10(f O2, bar) SG Pt SC Pt SG Ni SC Ni SG NiFe SC Fe a b SG Re SC Pt ol SG Re
Fig. 5 Transects of metal alloy bleb compositions (a) and resulting fO2 (b). The sample-capsule interface is at zero mm at left. Only a representative olivine composition (San Carlos in a Pt capsule) is shown in (a). The change in olivine composition seen in Figure 4 is essentially unresolved at this scale. Compositional uncertainties are indicated by the variation of Fe and resulting fO2 in the interior for the individual capsules.
276
The corresponding oxygen fugacities calculated from the alloy and olivine
com-277
positions with Equation 9 are shown in Figure 5b. Since the olivine compositions
278
are constant at this scale, fO2 values follow the alloy compositions. From the
in-279
terior to the edge of the Pt-enclosed samples fO2 increases by about 4 orders
280
of magnitude, while the increase within the Ni capsule is less than one order of
281
magnitude. fO2 values decrease approaching the NiFe and Fe capsules.
5.3 fO2 in Sample Interiors
283
Metal alloy blebs within the deep interior of each of the variously enclosed samples
284
have a constant composition without signs of diffusive gradients (Figure 5).
How-285
ever, as is shown in Figure 6, the fO2s are different within different metal capsules.
286
The fO2of the Fe enclosed samples is near that of the corresponding metal-oxide
287
buffer (Fe-w¨ustite, IW), but samples enclosed in Ni are more than two orders of
288
magnitude more reduced than the Ni-NiO buffer (NNO). The fO2 in the
inte-289
rior of Pt enclosed samples is about one order of magnitude higher compared to
290
Ni enclosed samples, and approaches the fayalite-magnetite-quartz (FMQ ) buffer
291
for San Carlos olivine (containing Ni, Kessel et al. (2001) activity-composition
292
relationships).
293
Pt edge Pt int. Ni FeNi Fe Re -13 -12 -11 -10 -9 -8 -7 -6 -5 -4 -3 log 10(f O2, b ar)
San Carlos olivine, K San Carlos olivine, R Sol gel olivine, K Sol gel olivine, R
NNO FMQ
CCO
IW RRO
Fig. 6 fO2 values in the deep sample interior and near the interface with the Pt capsule calculated from eq. 9. K indicates activities of Fe in the alloy from Kessel et al. (2001), R from Rubie et al. (1993) based on the data from Heald (1967). The two are nearly identical at the lowest fO2, but diverge significantly at the highest fO2. The green arrow indicates the range of mean fO2values determined for mantle rocks from xenoliths and massifs in different tectonic settings, with subduction zones at the oxidizing end and some peridotite massifs at the reducing end (Frost and McCammon 2008). The abbreviations for the buffers are: RRO, Re-ReO2; NNO, Ni-NiO; CCO, C-CO; IW, Fe-FeO (black dashed lines), and QFM, quartz-fayalite-magnetite (blue dashed line). The green dashed lines indicate the olivine stability field calculated from Dohmen and Chakraborty (2007), Appendix C. fO2 buffers were calculated from the compilation by Hirschmann et al. (2008), Re-ReO2from Pownceby and O’Neill (1994).
The fO2 calculated near the interface between the samples and the Pt and Ni
294
capsules is higher compared to that in the interior (Figure 5). The values shown
in Figure 6 for the edge of the Pt encapsulated sample were calculated from the
296
composition of the capsule and olivine immediately at the interface. Since the
297
nearest blebs are usually a few tens of µm away from the interface their fO2values
298
are somewhat lower than that at the interface.
299
The Mg # of olivine next to metal blebs are generally within one standard
300
deviation of the analyses far from the blebs. Only in Fe capsules is olivine next to
301
the blebs resolvably depleted in Fe (Table 1) as well as in Ni. This may be due to
302
the higher Fe content of the metal alloy blebs in the Fe capsules (46 - 52 atomic%
303
in Fe vs 28 - 33 atomic% in Pt capsules), necessitating longer diffusion distances
304
and hence equilibration times.
305 ln(XFe/XNi) olivine 3 3.5 4 4.5 5 ln(XFe/ XNi) met al -0.5 0 0.5 1 1.5 2 2.5 3 Pt Ni Fe
Fig. 7 Partitioning of Fe and Ni between metal alloy blebs and adjacent olivine in the interior of San Carlos olivine samples. The capsule materials are indicated next to the data points. The line represents equilibrium partitioning determined by Holzheid and Grove (2005).
The equilibration between metal blebs and olivine in the interior can be checked
306
by comparison with equilibrium partitioning of Fe and Ni between metal and
307
olivine determined by Holzheid and Grove (2005). Figure 7 shows a comparison of
308
the fit to their data, obtained from a broad range of compositions, with the results
309
of this study for the San Carlos olivine samples (solgel does not contain Ni). The
310
agreement between the two studies is reasonable, confirming that the blebs are near
311
equilibrium with the surrounding olivine. The largest deviation is observed for Fe
312
capsules; a consequence of the Fe (and Ni) depletion noted above. The equilibrium
fO2values in Fe capsules are likely not substantially different however, due to the
314
decreasing sensitivity at higher Fe contents in the alloy solution model.
315
5.4 Fe3+ Content
316
The fO2 calculated with the Kessel et al. (2001) activity-composition relations
317
can be used to calculate the Fe3+ content of olivine using the defect models of
318
Nakamura and Schmalzried (1983) and Tsai and Dieckmann (2002) (Section 4.1).
319
Figure 8a shows that the concentrations of Fe•M calculated from the Nakamura
320
and Schmalzried (1983) model for the charge neutrality condition not involving
321
Fe0Si (Equation 12) are comparable to those calculated from Tsai and Dieckmann
322
(2002) including this defect (Equation 14). The largest difference (0.4 log units) is
323
predicted for the high fO2s at the Pt interface, while at more reducing conditions
324
the difference is less than 0.2 log units. The salient difference between the two
325
models is that Tsai and Dieckmann (2002) predict a crossover of the abundance
326
of defects involving Fe3+ as a function of fO2 at 1200◦C. At high fO2 [Fe0Si] is
327
higher; the crossover to higher [Fe•M] occurs near the fO2 in the sample interiors
328
for Pt encapsulation.
329
The amount of Fe3+ calculated by adding [Fe0Si] and [Fe•M] of the Tsai and
330
Dieckmann (2002) model from Figure 8a is shown in Figure 8b. The high Fe3+
331
content at the Pt-sample interface is due to the high Fe0Si for these oxidizing
332
conditions. Fe3+ contents at lower fO2in sample interiors are in the range of tens
333
of ppm for both models; fO2near IW still results in Fe3+ values above 10 ppm.
334
6 Water Retention in Unbuffered Experiments
335
As described in Faul et al. (2016), Ti-bearing, Pt enclosed olivine samples contain
336
water after hotpressing and deformation experiments at high temperature. In these
337
experiments water was preserved in an assembly with no hydrous components,
338
without water having being deliberately added, or a dehydrating water buffer
Pt edge Pt int Ni int FeNi Fe -5.5 -5 -4.5 -4 -3.5 -3 -2.5 log 10([ defect] ) SG olivine, [Fe3+ Si] SC olivine, [Fe3+ Si] SG olivine [Fe3+ Me] SC olivine [Fe3+ Me]
Pt edge Pt int Ni int FeNi Fe 101 102 103 wt. ppm Fe 3+ SG olivine SC olivine a b
Fig. 8 (a) Defect concentrations of Fe•M and Fe0Si for solgel and San Carlos olivine in the different capsules. At the high fO2s at the interface of Pt foils the latter defect is more abun-dant, the cross-over occurs near the fO2s of the interiors of Pt enclosed samples. (b) Total Fe3+content in wt. ppm in both types of olivine. For comparison, San Carlos olivine typically contains about 20 wt. ppm Ti and 100 wt. ppm Cr (de Hoog et al. 2010); the solgel olivine of this study about 250 wt. ppm Ti. Fe3+ for the defect model of Tsai and Dieckmann (2002) (TD) were calculated with equations given in Dohmen and Chakraborty (2007) (Section 4.1). fO2s were calculated with the Kessel et al. (2001) activity-composition relations.
having been used. The powders were fired in a controlled oxygen atmosphere after
340
cold pressing and prior to loading. We tentatively infer that the water observed at
341
the end of these experiments was introduced after firing by surface adsorption onto
342
the fine-grained olivine powders, although ingress from the Argon gas surrounding
343
the jacket may also be possible.
344
Figure 9 shows Fourier transform infrared spectroscopic (FTIR) maps of the
345
water contents of olivine samples contained within welded and open Pt capsules in
346
experiment 6805. The bottom of the pellet in Figure 9b was left in direct contact
347
with the alumina piston. The map shows that adjacent to the Pt water is retained,
348
while some water is lost to the piston. Water retention therefore does not require
349
prior welding of the capsule, only that the sample is completely surrounded by Pt.
350
Further evidence that it is the direct contact between sample and Pt that leads
351
to water retention is provided by an experiment (6707) where two pellets were
352
separated from the Pt capsules by either Ni or Ni70Fe30 foil. FTIR spectroscopy
353
showed that both samples were dry after hotpressing.
354
The water content of Pt encapsulated samples with added Pt particles was
355
determined from FTIR transects across the center of the samples, similar to the
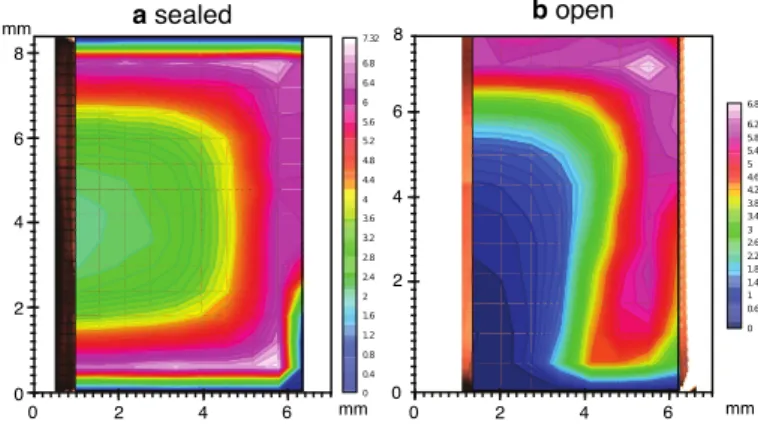
0 6.82 3.4 3 2.6 2.2 1.8 1.4 1 0.6 3.8 4.2 4.6 5 5.4 5.8 6.2 0 2 4 6 0 2 4 6 8 mm 0 2 4 6 -0.288 7.32 3.6 3.2 2.8 2.4 2 1.6 1.2 0.8 0.4 0 4 4.4 4.8 5.2 5.6 6 6.4 6.8 0 2 4 6 8 mm mm a sealed b open
Fig. 9 FTIR maps of the Ti-hydroxyl content of two pellets hotpressed in the same experiment (6805) (a) The Pt capsule enclosing the pellet was welded shut prior to insertion in the assembly. (b) The pellet was wrapped in Pt foil and covered with a Pt disk at the top. The bottom was left in direct contact with the alumina piston. The numbers next to the colorscale indicate the the integrated absorbance, not the absolute values. The maximum water contents are ∼ 1300 ppm H/Si. The maps show that welding of Pt capsules is not necessary for water retention.
fO2 transects. The region about 1.5 mm from the edge of the Pt encapsulated
357
sample is optically darker, indicating oxidation (Rossman 1988). This region shows
358
the increased fO2 (Figure 5) and the concomitant increase in the calculated Fe3+
359
content (Figure 8). The FTIR spectra recorded within 1.5 mm from the edge of
360
the San Carlos olivine sample shown in Figure 10 include absorption bands around
361
3350 cm−1and 3330 cm−1. These bands have been assigned to hydroxyl associated
362
with trivalent cations, in particular Fe3+ and Cr3+ (Berry et al. 2007). The water
363
content associated with these bands is small (< 5 wt. ppm H2O), but implies that
364
a significant fraction of the available Fe3+ is hydroxylated (c.f. Figure 8). Due to
365
the relatively low water contents the spectra Figure 10 are relatively noisy, and
366
the presence of Fe3+-related absorbance can not be confirmed unambiguously in
367
the interior. FTIR spectra of both samples show absorption bands at 3525 and
368
3572 cm−1, attributed to Ti-related hydroxyl (Berry et al. 2005; Padr´on-Navarta
369
et al. 2014; Balan et al. 2011). The water contents associated with this defect are
370
below 5 wt. ppm H2O in the San Carlos olivine samples due its low Ti content.
wavenumber, cm-1 3000 3100 3200 3300 3400 3500 3600 Absorba nce/cm 0 0.2 0.4 0.6 0.8 1 1.2 interior rim 3572 3525 3350 B&K 93
Fig. 10 Unpolarized FTIR spectra from the rim and interior of the San Carlos olivine pellet in a Pt capsule. The interior is nearly dry (hence the poor signal to noise ratio), while the rim shows both hydroxyl (structurally bound water) and molecular water (broad absorbance). The spectrum labelled ‘rim’ was acquired about 200 µm from the sample-capsule interface, well within the oxidized region identifiable by the calculated fO2 (Figure 5) and is optically darker in the polished section. Spectra in grey are from Bai and Kohlstedt (1993), their Figure 2, at similar fO2 as the interior and rim spectra, respectively, but from single crystals. No-ticeable is the absence of the trivalent absorption bands at the lower fO2for both single- and polycrystalline samples.
Bai and Kohlstedt (1993) obtained FTIR spectra from single crystals of San
372
Carlos olivine that were heat-treated at water saturated conditions and different
373
fO2s. The spectra they obtained at similar fO2s as in the interior and the edge of
374
the present samples are shown in Figure 10. Their spectra are similar to those from
375
the present experiments, including the presence of the trivalent bands at high fO2.
376
The only significant difference is the absence of the Si band at 3612 cm−1, which
377
is attributed to the water-undersaturated conditions of the present experiments.
378
7 Discussion
379
With the same controlled atmosphere pre-treatment, the fO2in the interior of the
380
hot-pressed samples change by less than three orders of magnitude between Fe
381
and Pt encapsulation. This compares with a nominal difference of more than ten
382
orders of magnitude between the IW and the (theoretical) Pt-PtO2 buffers. The
383
increasing fO2s from the interface to the interior for reducing foils and decreasing
384
fO2s for oxidizing foils (Figure 5) suggests that the samples are to some extent
385
self-buffering during the 24 hour exposure to the hot-pressing conditions. This
is supported by the observation that Ni and Cr containing San Carlos olivine
387
experiences a somewhat higher fO2 in comparison to trace element-free (except
388
Ti) solgel olivine in the same metal capsule and following the same pre-treatment.
389
Thermodynamic modelling shows that the presence of Ni increases the lower fO2
390
stability limit in comparison to Ni-free olivine (Matas et al. 2000). The Re enclosed
391
sample with an interior fO2similar to the Fe and FeNi enclosed samples (Figure 6)
392
and in the absence of any measurable reaction with the Re foil also indicates self
393
buffering. The Re-ReO2buffer is at a higher fO2compared to NNO, but inertness
394
of Re metal is likely the reason why the interior fO2 does not follow the order
395
of the other samples relative to their metal-oxide buffers. The lack of adjustment
396
of the Re enclosed sample confirms that it is the Fe loss to Pt and Ni capsules
397
releasing O2 that leads to the observed fO2 gradient into the interior.
398
A mechanism for self-buffering may be provided by Equations 11 and 13 for
399
the case where opx is present. O2produced by reducing Fe3+in reaction 11 maybe
400
consumed in reaction 13, producing Fe0Si.
401
The fO2at the interface of Pt and Ni containers is continuously evolving during
402
the experiments due to the Fe uptake by the containers. The calculated Fe3+
403
amounts (Figure 8b) indicate that intrinsic defects are comparable in abundance
404
to extrinsic defects of for example 100 wt. ppm Cr in San Carlos olivine (de Hoog
405
et al. 2010).
406
For San Carlos olivine the compositions of the blebs represent a ternary system
407
(Pt-Fe-Ni). However, no data for activity-composition relations in this ternary
sys-408
tem exist. In the absence of such data the best possible approach is to extrapolate
409
from the three binary systems. If in particular XN imet is small, the corresponding
410
Fe-Ni interactions will be small. Additionally, the Fe-Ni binary is closer to ideality
411
than either Fe-Pt or Ni-Pt (Cacciamani et al. 2010). For San Carlos olivine we
412
therefore follow the approach of Rubie et al. (1993) using the measured
composi-413
tions of the blebs without normalisation to a binary composition. The analytical
414
results also show that the Ni content of the blebs is the same for all capsule
materials (Supplementary Data), independent of fO2. This indicates that the Ni
416
content is limited by the low concentration in olivine and consequently necessary
417
diffusion distance, rather than equilibration of the system. For the interior of
sol-418
gel olivine samples all observations and conclusions can be based on the Ni-free
419
binary system.
420
7.1 Diffusivities
421
Of the diffusive processes identified in Section 5, Fe diffusion is the slowest, with
422
diffusion distances ranging from tens of µm in Ni and FeNi foils to > 100 µm in
423
Pt and Fe foils. The diffusivity estimated from the diffusion profile of Fe in the Pt
424
capsule is of order 10−14 m2/s. Measured grain boundary diffusivities of Fe are
425
about one order of magnitude faster (Dohmen and Milke 2010). The slower value
426
observed here is likely to reflect a combination of grain boundary and grain interior
427
diffusivity. In Ni capsules, the Fe diffusion profile is affected by counter-diffusion
428
of Ni (Figure 4); the diffusivity is lower compared to Pt capsules.
429
Equation 1 shows that Fe loss from olivine to the metal capsules produces
oxy-430
gen, which can diffuse into the sample. Oxygen diffusion from the sample-capsule
431
interface into the interior is suggested by the changing metal bleb compositions
432
and corresponding fO2profile in Figure 5. This profile indicates diffusivities of the
433
order of 10−12m2/s, which is similar to measured grain boundary diffusivities of
434
oxygen in olivine (Condit et al. 1985; Dohmen and Milke 2010). This indicates
435
that experimental assemblies with a metal-oxide buffer at the outside or one end
436
of a sample do not guarantee that the sample interior is at this oxygen buffer.
437
The time-scale required for equilibration of the fO2 appears to be that of grain
438
boundary diffusion of oxygen.
439
With a diffusivity of 10−12m2/s at 1200C cylindrical samples with a diameter
440
of 2 mm should come close to equilibrium with an oxygen buffer surrounding the
441
sample over 24 hours. Lower temperatures or larger samples will require
corre-442
spondingly longer experimental durations.
The differences in fO2 between the interiors of the differently encapsulated
444
samples imply that the deep interior of the sample is sensitive to the external
445
conditions during hotpressing. The absence of diffusion profiles for this process in
446
the sample traverses (Figure 5) implies a diffusive process that is at least two orders
447
of magnitude faster than the process controlling oxygen diffusion, of the order
448
of 10−10 m2/s. Such high diffusivities are variously ascribed to metal vacancies
449
(Mackwell et al. 1988), hydrogen (protons), polarons (hopping of the charge of
450
Fe3+defects, Sato (1986)) and electrons (see e.g. Demouchy and Bolfan-Casanova
451
(2016).
452
7.2 A ‘Metastable’ Oxygen Fugacity?
453
Fast hydration of pre-existing defects (such as V00M) is inferred to occur by
dif-454
fusion of interstitial protons, charge compensated by a counterflux of polarons
455
( Fe•M) (Mackwell and Kohlstedt 1990). Kohlstedt and Mackwell (1998) refer to
456
the process of exchanging protons with polarons as a metastable equilibration, and
457
distinguish it from incorporation of hydroxyl, resulting in an equilibrium
concen-458
tration of H for a given water fugacity (see also Tollan et al. (2017)). Diffusivities
459
of protons and polarons at 1200◦C are of the order of 10−8m2/s (Demouchy et al.
460
2016), while the creation of hydrated Si defects requires (local) Si diffusion (Karato
461
2008) and is substantially slower (of the order of 10−13m2/s, Padr´on-Navarta et al.
462
(2014)).
463
Mackwell et al. (1988) conducted creep experiments with San Carlos olivine
464
in a controlled atmosphere furnace at high temperature. In these experiments
465
constant stress was maintained while the oxygen partial pressure was changed.
466
The time to reach steady state creep after a change in fO2 was interpreted as
467
the equilibration time of grain-internal defects with the externally imposed fO2,
468
allowing calculation of defect diffusivities. The resulting diffusivities are of the
469
order of 10−10 m2/s at 1200◦C. Mackwell et al. (1988) inferred that the rapid
470
equilibration to the externally imposed fO2was due to diffusion of vacancies rather
than atoms, since the diffusivities are comparable to metal vacancy diffusivities
472
determined previously (Nakamura and Schmalzried 1984; Wanamaker 1994).
473
The present experiments show a fast adjustment of the interior fO2to different
474
metal capsules, with a diffusivity that is comparable to that inferred for vacancy
475
diffusion. However, the new fO2does not correspond to the respective metal-oxide
476
buffers, while the fO2 gradients observed at the sample-metal interfaces indicate
477
ongoing adjustments to the conditions at the interface. This suggests that, similar
478
to hydration reactions, rapid but ‘metastable’ changes in fO2 can occur, involving
479
pre-existing defects. A possibility is a change in the distribution of Fe3+ between
480
Fe•M and Fe
0
Si as a function of fO2 (Equations 11 and 13, Tsai and Dieckmann
481
(2002)). Since Fe•M is more mobile than Fe
0
Si this redistribution may affect the
482
rheology (Mackwell et al. 1988) and electrical conductivity (Roberts and Tyburczy
483
1993).
484
Full equilibration requires creation of new defects, involving an olivine
grain-485
external component (pyroxene), as well as O2 from an external source (c.f. Eq.
486
5a of Dohmen and Chakraborty (2007); see also Karato (2008)). In the present
487
experiments opx is well mixed with olivine (Figure 3) at the scale of tens of µm.
488
Particularly for experiments with single crystals significantly larger diffusion
dis-489
tances for silica equilibration may be involved.
490
8 Summary and Application
491
Experiments with samples of polycrystalline olivine including dispersed, small Pt
492
particles as fO2 sensors show that the sample-interior fO2 does not correspond
493
to the nominal fO2 of the metal foils and their oxides surrounding the samples.
494
After having received the same pre-treatment in a 1 atm furnace, the sample
495
interior fO2 after hotpressing differs for different metal foils, but is restricted to
496
a comparatively narrow range. Gradients in fO2 occur at the metal-foil interfaces
497
with a spatial scale about an order of magnitude larger compared to diffusive Fe
498
loss to the capsules. From these observations three different diffusive spatial/time
scales can be identified: Fe loss extending over tens of µm; gradients in fO2 of up
500
to 2 mm; and constant, but different fO2s in the interiors of the capsules. Together
501
these observations indicate the possibility of fast but ‘metastable’ adjustments to
502
fO2, similar to hydration reactions of pre-existing defects. Full equilibration of the
503
fO2is not governed by defect diffusion, but requires atomic diffusion.
504
There is no doubt that the generally more oxidising conditions prevailing within
505
and particularly at the edge of Pt capsules, and to a lesser extent Ni, capsules are
506
broadly conducive to the retention of water - whether as bound hydroxyl or
molec-507
ular water (Faul et al. 2016). Utilizing these capsule materials to retain water, a
508
recent forced oscillation study of seismic wave dispersion and attenuation in
poly-509
crystalline olivine (Cline II et al. 2017) demonstrated that the seismic properties
510
are sensitive neither to bound hydroxyl nor molecular water. Instead, the use of
511
alternative Pt, Ni, and Ni70Fe30sleeves together with solgel and San Carlos olivine
512
has been exploited in this study to show that seismic properties vary systematically
513
with oxygen fugacity.
514
Acknowledgements: The authors would like to acknowledge insightful
dis-515
cussions with Hugh O’Neill over many years on this topic. This work was in part
516
funded by NSF grant EAR 1321889 to U.F. and ARC grant DP130103848 to I.J,
517
A.B., U.F. and S. Karato. The authors thank Harri Kokkonen and Hayden Miller
518
for technical assistance. The comments of Vladimir Matjuschkin and an
anony-519
mous reviewer helped to improve the manuscript .
520
References
522
Armstrong, J. T., 1995. CITZAF—a package for correction programs for the quantitative
523
electron microbeam x-ray analysis of thick polished materials, thin-films and particles.
524
Microbeam Anal. 4, 177–200.
525
Bai, Q., Kohlstedt, D. L., 1993. Effects of chemical environment on the solubility and
incor-526
poration mechanism for hydrogen in olivine. Physics and Chemistry of Minerals 19, 460 –
527
471.
528
Balan, E., Ingrin, J., Delattre, S., Kovacs, I., Blanchard, M., 2011. Theoretical infrared
spec-529
trum of oh defects in forsterite. European Journal of Mineralogy 23, 285–292.
530
Ballhaus, C., Berry, R. F., Green, D. H., 1991. High pressure experimental calibration of the
531
olivine-orthopyroxene-spinel oxygen geobarometer: implications for the oxidation state of
532
the upper mantle. Contributions to Mineralogy and Petrology 107, 27 – 40.
533
Berry, A. J., Hermann, J., O’Neill, H. S. C., Foran, G. J., 2005. Fingerprinting the water site
534
in mantle olivine. Geology 33, 869–872; doi: 10.1130/G21759.1.
535
Berry, A. J., O’Neill, H. S. C., Hermann, J., Scott, D. R., 2007. The infrared signature of
536
water associated with trivalent cations in olivine. Earth and Planetary Science Letters
537
261, 134–142.
538
Bowen, N. L., Shairer, J. F., 1932. The system FeO - SiO2. American Journal of Science 5th 539
series, 24, 177 – 213.
540
Cacciamani, G., Dinsdale, A., Palumbo, M., Pasturel, A., 2010. The fe–ni system:
Thermody-541
namic modelling assisted by atomistic calculations. Intermetallics 18, 1148 – 1162.
542
Cline II, C. J., Faul, U. H., David, E. C., Berry, A. J., Jackson, I., 2017. Redox-influenced
543
seismic properties of upper-mantle olivine. in review.
544
Condit, R. H., Weed, H. C., Piwinskii, A. J., 1985. A technique for observing oxygen diffusion
545
along grain boundary regions in synthetic forsterite. In: Schock, R. N. (Ed.), Point Defects
546
in Minerals. Vol. 31 of Geophysical Monographs. American Geophysical Union, pp. 97 –
547
105.
548
Cottrell, E., Kelley, K. A., 2011. The oxidation state of Fe in MORB glasses and the oxygen
549
fugacity of the upper mantle. Earth and Planetary Science Letters 305, 270 – 282.
550
de Hoog, J. C. M., Gall, L., Cornell, D. H., 2010. Trace-element geochemistry of mantle olivine
551
and application to mantle petrogenesis and geothermobarometry. Chemical Geology 270,
552
196–215, doi:10.1016/j.chemgeo.2009.11.017.
553
Demouchy, S., Bolfan-Casanova, N., 2016. Distribution and transport of hydrogen in the
litho-554
spheric mantle: A review. Lithos 240 - 243, 402 – 425.
555
Demouchy, S., Thoraval, C., Bolfan-Casanova, N., Manthilake, G., 2016. Diffusivity of hydrogen
556
in iron-bearing olivine at 3 gpa. Physics of the Earth and Planetary Interiors 260, 1 – 13.
Dohmen, R., Chakraborty, S., 2007. Fe–Mg diffusion in olivine II: point defect chemistry,
558
change of diffusion mechanisms and a model for calculation of diffusion coefficients in
559
natural olivine. Physics and Chemistry of Minerals 34, 409 – 430.
560
Dohmen, R., Milke, R., 2010. Diffusion in polycrystalline materials: Grain boundaries,
math-561
ematical models, and experimental data. Reviews in Mineralogy and Geochemistry 72,
562
921–970.
563
Faul, U. H., Cline II, C. J., David, E. C., Berry, A. J., Jackson, I., 2016. Titatnium–hydroxyl
564
defect-controlled rheology of the Earth’s upper mantle. Earth and Planetary Science
Let-565
ters 452 (dx.doi.org/10.1016/j.epsl.2016.07.016), 227 – 237.
566
Faul, U. H., Fitz Gerald, J. D., Jackson, I., 2004. Shear wave attenuation and dispersion
567
in melt-bearing olivine polycrystals: 2. microstructural interpretation and seismological
568
implications. Journal of Geophysical Research 109, B06202, doi:10.1029/2003JB002407.
569
Faul, U. H., Jackson, I., 2007. Diffusion creep of dry, melt-free olivine. Journal of Geophysical
570
Research 110, B04204, doi:10.1029/2006JB004586.
571
Frost, D. J., McCammon, C. A., 2008. The redox state of Earth’s mantle. Annual Reviews of
572
Earth Planetary Sciences 36, 389 – 420.
573
Gaetani, G. A., 2016. The behavior of Fe3+/PFe during partial
melt-574
ing of spinel lherzolite. Geochimica et Cosmochimica Acta 185, 64 – 77,
575
http://dx.doi.org/10.1016/j.gca.2016.03.019.
576
Grove, T. L., 1981. Use of fept alloys to eliminate the iron loss problem in 1 atmosphere gas
577
mixing experiments: Theoretical and practical considerations. Contributions to Mineralogy
578
and Petrology 78, 298 – 304.
579
Heald, E. F., 1967. Thermodynamics of iron-platinum alloys. Trans. Metall. Soc. AIME
580
239 (1337 - 1340).
581
Hirschmann, M. M., Ghiorso, M. S., Davis, F. A., Gordon, S. M., Mukherjee, S., Grove, T. L.,
582
Krawczynski, M., Medard, E., Till, C. B., 2008. Library of Experimental Phase Relations
583
(LEPR): A database and Web portal for experimental magmatic phase equilibria data.
584
Geochem. Geophys. Geosyst. 9, doi:10.1029/2007GC001894.
585
Hirth, G., Kohlstedt, D. L., 1995. Experimental constraints on the dynamics of the partially
586
molten upper mantle: 1. Deformation in the diffusion creep regime. Journal of Geophysical
587
Research 100, 1981 – 2001.
588
Holland, T. J. B., Powell, R., 1989. An internally consistent thermodynamic data set for phases
589
of petrological interest. Journal of Metamorphic Geology 16, 309 – 343.
590
Holzheid, A., Grove, T. L., 2005. The effect of metal composition on Fe–Ni partition behavior
591
between olivine and FeNi-metal, FeNi-carbide, FeNi-sulfide at elevated pressure. Chemical
592
Geology 221, 207 – 224.
Jackson, I., Gerald, J. D. F., Faul, U. H., Tan, B. H., 2002. Grain-size-sensitive
seis-594
mic wave attenuation in polycrystalline olivine. Journal of Geophysical Research 107,
595
doi:10.1029/2001JB001225.
596
Jamieson, H. E., Roeder, P. L., Grant, A. H., 1992. Olivine-pyroxene-PtFe alloy as oxygen
597
geobarometer. Journal of Geology 100, 138 – 145.
598
Jaques, A. L., Green, D. H., 1980. Anhydrous melting of peridotite at 0-15 kb pressure and
599
the genesis of tholeiitic basalts. Contributions to Mineralogy and Petrology 73, 287–310.
600
Karato, S. I., 2008. Deformation of Earth Materials. Cambridge University Press.
601
Karato, S. I., 2011. Water distribution across the mantle transition zone and its implications
602
for global material circulation. Earth and Planetary Science Letters 301, 413–423.
603
Karato, S. I., Paterson, M. S., Fitz Gerald, J. D., 1986. Rheology of synthetic olivine aggregates:
604
Influence of grain size and water. Journal of Geophysical Research 91, 8151 – 8176.
605
Kelley, K. A., Cottrell, E., 2009. Water and the oxidation state of subduction zone magmas.
606
Science 325, 605 – 607.
607
Kessel, R., Beckett, J. R., Stolper, E. M., 2001. Thermodynamic properties of the Pt-Fe system.
608
American Mineralogist 86, 1003 – 1014.
609
Kohlstedt, D. L., Mackwell, S. J., 1998. Diffusion of hydrogen and intrinsic point defects in
610
olivine. Zeitschrift f¨ur physikalische Chemie 207, 147 – 162.
611
Mackwell, S. J., Dimos, D., Kohlstedt, D. L., 1988. Transient creep of olivine: Point-defect
612
relaxation times. Philosopical Magazine A 57, 779 – 789.
613
Mackwell, S. J., Kohlstedt, D. L., 1990. Diffusion of hydrogen in olivine: Implicationsfor water
614
in the mantle. Journal of Geophysical Research 95, 5079–5088.
615
Matas, J., Ricard, Y., Lemelle, L., Guyot, F., 2000. An improved thermodynamic model of
616
metal-olivine-pyroxene stability domains. Contributions to Mineralogy and Petrology 140,
617
73 – 83.
618
Mei, S., Kohlstedt, D. L., 2000. Influence of water of plastic deformation of olivine aggregates:
619
1. Diffusion creep regime. Journal of Geophysical Research 105, 21,475 – 21,469.
620
Merill, R. B., Wyllie, P. J., 1973. Absorption of iron by platinum capsules in high pressure
621
rock melting experiments. American Mineralogist 58, 16 – 20.
622
Nakamura, A., Schmalzried, H., 1983. On the nonstoichiometry and point defects of olivine.
623
Physics and Chemistry of Minerals 10, 27 – 37.
624
Nakamura, A., Schmalzried, H., 1984. On the Fe2+– Mg2+-interdiffusion in olivine (II). Ber. 625
Bunsenges. Phys. Chem. 88, 140 – 145.
626
O’Neill, H. S. C., Pownceby, M. I., McCammon, C. A., 2003. The magnesiow¨ustite: iron
equi-627
librium and its implications for the activity-composition relations of (Mg,Fe)2SiO4olivine 628
solid solutions. Contributions to Mineralogy and Petrology 146, 308–325.
O’Neill, H. S. C., Wall, V. J., 1987. The olivine-orthopyroxene-spinel oxygen geobarometer, the
630
nickel precipitation curve, and the oxygen fugacity of the earth’s upper mantle. Journal of
631
Petrology 28, 1169 – 1191.
632
Padr´on-Navarta, J., Hermann, J., O’Neill, H. S. C., 2014. Site-specific hydrogen diffusion rates
633
in forsterite. Earth and Planetary Science Letters 392, 100–112.
634
Paterson, M. S., 1990. Rock deformation experimentation. In: Duba, A. G. (Ed.), The
Brittle-635
Ductile Transition in Rocks, Geophys. Monogr. Ser. Vol. 56. American Geophysical Union,
636
pp. 187 – 194.
637
Pownceby, M. I., O’Neill, H. S. C., 1994. Thermodynamic data from redox reactions at high
638
temperatures. IV. Calibration of the Re-ReO2oxygen buffer from EMF and NiO + Ni-Pd 639
redox sensor measurements. Contributions to Mineralogy and Petrology 118, 130 – 137.
640
Roberts, J. J., Tyburczy, J. A., 1993. Frequency dependent electrical properties of dunite
641
as functions of temperature and oxygen fugacity. Physics and Chemistry of Minerals 19,
642
545–561.
643
Rossman, G. R., 1988. Optical spectroscopy. Reviews in Mineralogy 18, 207–254.
644
Rubie, D. C., Karato, S., Yan, H., O’Neill, H. S. C., 1993. Low differential stress and controlled
645
chemical environment in multianvil high-pressure experiments. Physics and Chemistry of
646
Minerals 20, 315–322.
647
Sato, H., 1986. High temperature a.c. electrical properties of olivine single crystal with varying
648
oxygen partial pressure: Implications for the point defect chemistry. Physics of the Earth
649
and Planetary Interiors 41, 269–282.
650
Stocker, R. L., Smyth, D. M., 1978. Effect of enstatite activity and oxygen partial pressure
651
on the point defect chemistry of olivine. Physics of the Earth and Planetary Interiors 16,
652
145–156.
653
Tasaka, M., Zimmerman, M. E., Kohlstedt, D. L., 2015. Creep behavior of Fe-bearing olivine
654
under hydrous conditions. Journal of Geophysical Research 120, 6039–6057, doi:10.1002/
655
2015JB012096.
656
Tollan, P., Smith, R., O’Neill, H. S. C., Hermann, J., 2017. The responses of the four main
657
substitution mechanisms of H in olivine to H2O activity at 1050◦C and 3 GPa. Progress 658
in Earth and Planetary Science in press.
659
Tsai, T.-L., Dieckmann, R., 2002. Variation of the oxygen content and point defects in olivines,
660
(FexMg1−x)2SiO4, 0.2 ≤ x ≤ 1.0. Physics and Chemistry of Minerals 29, 680–694, DOI 661
10.1007/s00269–002–0283–1.
662
Tyburczy, J. A., Du Frane, W. L., 2015. Properties of rocks and minerals – the electrical
663
conductivity of rocks, minerals, and the Earth. In: Treatise on Geophysics. Vol. 2nd edition.
664
Elsevier, Ch. 2.25, pp. 661–672.