Cracking processes in Barre granite: fracture
process zones and crack coalescence
The MIT Faculty has made this article openly available. Please share
how this access benefits you. Your story matters.
Citation
Morgan, Stephen P., Catherine A. Johnson, and Herbert H. Einstein.
“Cracking Processes in Barre Granite: Fracture Process Zones and
Crack Coalescence.” International Journal of Fracture 180, no. 2
(February 22, 2013): 177–204.
As Published
http://dx.doi.org/10.1007/s10704-013-9810-y
Publisher
Springer Netherlands
Version
Author's final manuscript
Citable link
http://hdl.handle.net/1721.1/103144
Terms of Use
Creative Commons Attribution-Noncommercial-Share Alike
1
Cracking Processes in Barre Granite: Fracture
Process Zones and Crack Coalescence
Stephen P. Morgan · Catherine A. Johnson · Herbert H. Einstein
Abstract This paper presents a comprehensive study of the cracking and coalescence behavior of
granite specimens with pre-existing flaw pairs. Uniaxial compressions tests were conducted on Barre granite with pre-existing flaw pairs of varying inclination angles (β), bridging angles (α) and ligament lengths (L). The cracking processes were recorded using a high speed camera to capture crack initiation and determine the mode (tensile or shear) of cracking. Visible fracture process zones of grain lightening, referred to as "white patching", were also observed. White patching corresponded to fracture process zones that developed before visible cracks appeared. Cracks were typically preceded by a corresponding linear white patching. Diffusive area white patching was also observed near locations where surface spalling eventually occurred. Shear cracks occurred less often when compared to other brittle materials such as gypsum and marble and tensile cracks were typically much more jagged in shape (saw-toothed) due to the larger size and higher strength mineral grains of granite. Crack coalescence behavior trended from indirect to direct shear and combined shear-tensile to direct tensile coalescence as the flaw pair bridging angle (α) or flaw angle (β) increased. As the ligament length (L) between flaws increased, more indirect coalescence was observed. As expected, due to the increased occurrence of tensile cracking in granite, more indirect tensile coalescence was observed in granite compared to other materials previously studied.
Keywords Granite · Fracture · Cracking · Fracture Process Zone · Coalescence · Flaws · Uniaxial compression · High speed camera · Tensile cracks · Shear cracks
S.P. Morgan
Department of Civil and Environmental Engineering, Massachusetts Institute of Technology,
Avenue, Room 1-343A, Cambridge, MA 02139, USA e-mail: spmorgan@mit.edu
H. H. Einstein
Department of Civil and Environmental Engineering, Massachusetts Institute of Technology, 77 Massachusetts Avenue, Room 1-342, Cambridge, MA 02139, USA e-mail: einstein@mit.edu
1 Introduction
It is well known that brittle materials, such as naturally occurring rocks and concrete, contain pre-existing micro-cracks, which control the failure mechanism of the material. Similarly, rock masses are typically discontinuous in nature, containing fractures (joints) with corresponding spacing and rock bridges, which determine the strength of a rock formation. The propagation and coalescence of cracks initiating from such pre-existing defects, on a variety of scales, are the dominant failure mechanisms controlling the strength and integrity of brittle materials.
One of the first experimental studies on the cracking mechanism in rocks was conducted by Brace and Bombolakis (1963). Studies specifically addressing coalescence include those by Shen et al. (1995), Bobet and Einstein (1998), Wong and Chau (1998), Wong et al. (2001), and Li et al. (2005). Recently, coalescence experiments have been conducted using high speed cameras to determine the initiation, propagation direction, and mode of cracking associated with flaw pairs (Wong and Einstein 2009a, Wong and Einstein 2009b). From these experimental studies conducted on gypsum and Carrara marble, Wong and Einstein (2009a) proposed a set of coalescence patterns based on the configuration of the flaw pairs (Fig. 1a). Wong and Einstein (2009b) also established a set of seven observed crack types (Fig. 1b). These coalescence categories and crack types will be used as a guideline for presenting the coalescence results of this paper (Refer to Fig. 1).
The present paper is a comprehensive study of several sets of uniaxial compression tests conducted on Barre granite using a high speed camera to capture the initiation, propagation and coalescence of cracks between pre-existing cracks referred to as flaws. Specifically, the current study describes the
progression and patterns of white patching followed by cracking in the granite tests. This study then compares and contrasts the crack- and coalescence patterns observed in granite specimens with those that were observed in previously researched materials containing flaw pairs.
3
Fig. 1a Nine coalescence patterns proposed by Wong and Einstein (2009a), determined from
uniaxial compression tests on Carrara marble and molded gypsum. T= Tensile Cracks, S = Shear Cracks. Crack types 1, 2, 3 refer to nomenclature introduced by Wong and Einstein (2009b) shown in Fig. 1b. Coalescence categories 1 and 2 show no coalescence or indirect coalescence.
Categories 3 and 4 show direct shear coalescence. Category 5 shows direct combined tensile-shear coalescence. Categories 6 through 9 show direct tensile coalescence.
Category Coalescence patterns Crack types involved
1 No coalescence
2
(2 cracks) (3 cracks)
Indirect coalescence by two or multiple
cracks (crack types vary)
3 Type 2 S crack(s)
4 Type 1 S crack(s)
5 One or more type 2 S crack(s) and type 2 T
crack segments between inner flaw tips
6
Type 2 T crack(s). There may be occasional short S segments present along the coalescence crack.
7 Type 1 T crack(s)
8
Flaw tips of the same side linked up by T crack(s) not displaying wing appearance (crack type not classified). There may be occasional short S segments present along the coalescence crack.
9
Type 3 T crack(s) linking right tip of the top flaw and left tip of the bottom flaw. There may be occasional short S segments present along the coalescence crack.
Fig. 1b Seven crack types proposed by Wong and Einstein (2009b). T= Tensile Cracks, S = Shear
5
2 Experiments
2.1 History of MIT experiments
This study consists of a collection of three sets of test series on Barre granite conducted by the MIT rock mechanics group. Starting in 1999, a test series on 14 different flaw pair geometries was conducted by Martinez (1999). A second test series was conducted by Miller in 2008 on 20 additional flaw geometries (Miller 2008; Miller and Einstein 2008). Finally, 9 additional test series were completed in the spring of 2012. In this paper all these test series have been combined and summarized as one complete set of tests on Barre granite.
2.2 Materials and Specimen Configuration
Many studies have been performed previously on the fracture of granite (e.g. Peng 1975; Hamiel et al. 2006). One of the more common types of granite used in fracture studies is Barre granite (Peng 1975; Kranz 1979; Nasseri et al. 2006). The Barre granite used for the experiments conducted in the present study was cut from two separate quarries in Vermont (Rock of Ages Corp. and Adam's Granite Company Inc.). Barre granite's mineral content typically consists of
approximately 36% plagioclase, 32% quartz, 18% K-feldspar, 8% biotite, 3% muscovite, and 3% granophyres minerals (Goldsmith et al. 1976). The material properties of Barre granite are presented in Table 1. The prismatic specimen (6" x3" x 1"; ~152 mm x~76 mm x~25 mm) boundaries were usually cut with a diamond saw (See Fig. 2). The "pre-existing" flaws (length 2a= 0.5", where a is the flaw half length) were always cut into the specimen using an OMAX water jet.
Table 1 Material properties of Barre granite
*: Miller (2008)
+: Goldsmith et al. (1976)
Young's Modulus [MPa] 19.2*
Compressive Strength [MPa] 151*
Tensile Strength [MPa] 5.08-10.65+
Fig. 2 A typical granite specimen tested in this study. Flaw Length (2a) = 0.5" Inches (Modified
from Miller, 2008)
The flaw pairs are defined by flaw inclination angles (β), bridging angles (α) and ligament lengths (L) (Fig. 3a). It should be noted that the flaw pair geometry in the test series conducted by Martinez (1999) was originally defined using spacing (s) and continuity (c) (Fig. 3b). For the purpose of this study, all the flaw
geometries have been converted to equivalent flaw inclination angles, bridging angles (to the nearest 5o) and ligament lengths (to the nearest flaw half length “a”) (Refer to Fig. 3a).
Flaws Inner Flaw Tip
Outer Flaw Tip
2a =
0.5" (~13mm)
0.06" (~1.5mm) Rounded Flaw Tips - Radius of Curvature: Circular Hole: r = 0.03" (~0.75mm)
7 Fig. 3 Definition of flaw pair geometries by (a) flaw inclination angle [β], bridging angle
[α] and ligament length [ L], or (b) flaw inclination angle [β], continuity [c] and spacing [s] (Modified from Wong, 2008).
2.3 Geometries Tested
Flaw angle (β), bridging angle (α) and ligament length (L) were varied to
determine the effect of each parameter of the flaw pair geometry on the resulting cracking and coalescence patterns. A total of 31 unique geometric flaw pair configurations were tested (Table 2). Most of the specimens tested had ligament lengths of a or 2a.
2.4 Experimental Setup
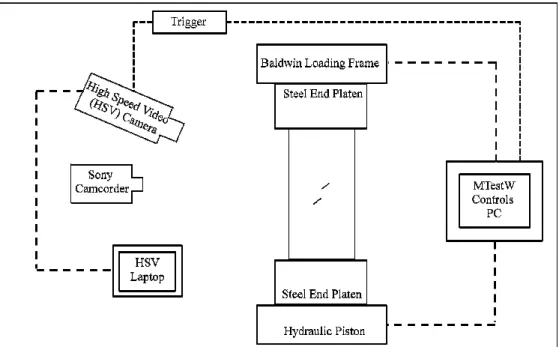
The specimens were uniaxially loaded in a 200-KIP Baldwin™ hydraulic loading frame. The data were collected with a program called MTestW, which recorded the load, displacement and time electronically. Dimensions measured manually prior to testing were used to approximate the stress. High speed imagery was captured using a Phantom™ V-series high speed camera controlled by a separate laptop computer. This high speed camera captured approximately 5404 images in 1.081 seconds at 512x512 pixel resolution. The high speed camera was
electronically connected to the loading frame, which detected failure by a significant drop in load and thus triggered the high speed capture. The test was also videotaped in real time with a Sony™ Camcorder. Steel platens were used on the specimen boundaries to reduce end effects. A photograph of the test setup is shown in Fig. 4 and a schematic of the test setup is shown in Fig. 5.
Table 2 Flaw pair geometries tested in granite for this study. The total number of specimens
tested at the particular geometry are shown in parentheses. Flaw geometries are designated as L-β-α, where L is the ligament length (a is the flaw half length), β is the flaw angle with respect to the horizontal, α is the bridging angle between flaws. Refer to Fig. 3a for flaw pair geometry configuration
a: Flaw pair geometries tested in recent study b: Flaw pair geometries tested by Miller (2008)
c: Flaw pair geometries tested by Martinez (1999), defined using the flaw spacing (s) and continuity (c) convention and were converted to bridging angle and ligament length. Coalescence results from Martinez (1999) were summarized from three or more test specimens
α L=a L=2a L=3a
0
a-0-0a,b(4) 2a-0-0
b
(3)
3a-60-0c(3+)
a-30-0a,b(5) 2a-30-0
b (3) a-45-0b(3) 2a-45-0 b (3) a-60-0b(3) 2a-60-0 b (3) a-75-0b(3) 2a-75-0b(3) 15 a-30-15a(2) 2a-30-15 a (3) 30 a-0-30 a (2) 2a-30-30 a (2) 3a-45-0c(3+) a-30-30a(3) 2a-60-30 c (3+) 45 a-30-45 a (2) 3a-45-45 c (3+) a-45-45c(3+) 60 a-0-60b(3) 2a-0-60 b (3) a-30-60b(3) 2a-30-60b(3) a-45-60b(3) 2a-45-60b(3) a-60-60b(3) 2a-60-60 b (3) a-75-60b(3) 2a-75-60 b (3)
Fig. 4 Photograph of the test setup in the current study. HSV = High Speed Video
HSV (high speed video)
Laptop MTestW Control PC Sony Camcorder
HSV (high speed video) Camera Granite
Specimen Steel Platen
Fig. 5 Schematic illustration of the test setup used in the current study
2008)
2.5 Data Analysis
Still images were taken with the high speed camera periodically during the phase of the test. In addition, pictures were taken for key events (white patching, crack initiation, spalling, breaking etc.) and the approximate load at the event was recorded. By using consecutive event images, sketches that trace the changes in white patching and cracking, were developed using Adobe Photoshop™.
images were synchronized with the load
manually recorded load at the instant each still image was taken.
Near failure, high speed imaging was used, which
with the load and displacement observations: since the high speed camera records image frames at a constant speed (5404 images in 1.081 seconds), events
occurring during the high speed imagery were synchronized by determining frame at which failure (rupture) occurred together with the number of frames between a specific event frame and the failure frame. This difference in the frame numbers was converted to a difference in time before failure and then used to
Schematic illustration of the test setup used in the current study (Modified from
Still images were taken with the high speed camera periodically during the test. In addition, pictures were taken for key events (white patching, crack initiation, spalling, breaking etc.) and the approximate load at the event was recorded. By using consecutive event images, sketches that trace the changes in
d cracking, were developed using Adobe Photoshop™.
images were synchronized with the load-, displacement-, and time-data using the manually recorded load at the instant each still image was taken.
Near failure, high speed imaging was used, which was differently synchronized with the load and displacement observations: since the high speed camera records image frames at a constant speed (5404 images in 1.081 seconds), events
occurring during the high speed imagery were synchronized by determining frame at which failure (rupture) occurred together with the number of frames between a specific event frame and the failure frame. This difference in the frame numbers was converted to a difference in time before failure and then used to
9 (Modified from Wong,
Still images were taken with the high speed camera periodically during the initial test. In addition, pictures were taken for key events (white patching, crack initiation, spalling, breaking etc.) and the approximate load at the event was recorded. By using consecutive event images, sketches that trace the changes in
d cracking, were developed using Adobe Photoshop™. Still data using the
was differently synchronized with the load and displacement observations: since the high speed camera records image frames at a constant speed (5404 images in 1.081 seconds), events
occurring during the high speed imagery were synchronized by determining the frame at which failure (rupture) occurred together with the number of frames between a specific event frame and the failure frame. This difference in the frame numbers was converted to a difference in time before failure and then used to
synchronize with the load-displacement-time data. The resulting still-images, sketches and stress-strain-time results were ordered chronologically to describe the progression of white patching, cracking and coalescence for each test.
Fractography was also used after failure and high speed video capture had occurred to examine and verify cracking processes. Fractography relies on observing fracture surfaces by the naked eye or low powered microscopy. Tensile cracking is characterized by features such as plumose structures, while shear cracking is characterized by slickensides and powdery residue. One of the problems of relying on fractography is that tensile fractures that are subsequently sheared cannot be distinguished from pure shear cracking. This is the reasons for why high speed video is a primary method of observing and fractography is only used as a secondary method.
3 Results and Discussion
The following results sections discuss the process zones observed in granite referred to as "white patching" and their progression into crack initiation, propagation and coalescence between flaw pairs. Cracking characteristics uniquely observed in granite such as initiation location and shape will then be presented. Finally, a systematic representation of the coalescence behavior of granite will be introduced and then compared to previous coalescence results on other rocks.
3.1 White Patching
In granite, visible areas of grain lightening occurred on the surface of the
specimen prior to cracking (Fig. 6). These areas of material brightening, referred to as “white patching”, have been observed previously in brittle rock materials and were determined to be networks of micro-cracks which develop prior to cracking (Wong and Einstein 2009c; Brooks 2010; Brooks et al. 2010). The
micro-cracking areas, which are seen macroscopically as white patching, are fracture process zones of material weakening. Previously, fracture process zones have been experimentally studied in granite using acousti
1987; Zietlow and Labuz examinations (Moore an
studies determined microcracking process zones in granite testing and observation
macroscopic white patching (fracture process zones) most likely develops from microcracking
Fig. 6 Material brightening observed in granite between two flaws. These areas of lightened minerals are referred to as “white patching”
Two types of white patching were observed in granite: linear and diffusive white patching. (Fig. 7) Linear white patching is characterized by narrow zones of whitening (width: 0.02
on the specimen increased ( in all directions (area: 0.08
Loading Direction
cracking areas, which are seen macroscopically as white patching, are fracture process zones of material weakening. Previously, fracture process zones have been experimentally studied in granite using acoustic sensing (Labuz 1987; Zietlow and Labuz 1998; Zang et al. 2000) as well as with optical
examinations (Moore and Lockner 1995; Nasseri et al. 2006). Although previous microcracking process zones in granite using many different tion methods, these studies can give some basic insight macroscopic white patching (fracture process zones) observed in the present study most likely develops from microcracking networks.
Material brightening observed in granite between two flaws. These areas of lightened minerals are referred to as “white patching”
Two types of white patching were observed in granite: linear and diffusive white 7) Linear white patching is characterized by narrow zones of
0.02-0.16 in; 0.5-2.0 mm), which typically formed as loading on the specimen increased (Fig. 7a). Diffuse white patching typically expanded
(area: 0.08-0.125 in2; 5-80 mm2), as loading increased (
Increase Loading
11 cracking areas, which are seen macroscopically as white patching, are fracture process zones of material weakening. Previously, fracture process zones
c sensing (Labuz et al. 1998; Zang et al. 2000) as well as with optical
Although previous many different
insight that observed in the present study
Material brightening observed in granite between two flaws. These areas of lightened
Two types of white patching were observed in granite: linear and diffusive white 7) Linear white patching is characterized by narrow zones of
which typically formed as loading 7a). Diffuse white patching typically expanded
as loading increased (Fig. 7b).
(a)
Fig. 7 (a) Linear white patching between two flaws (b) Diffusive or area white patching between
two flaws
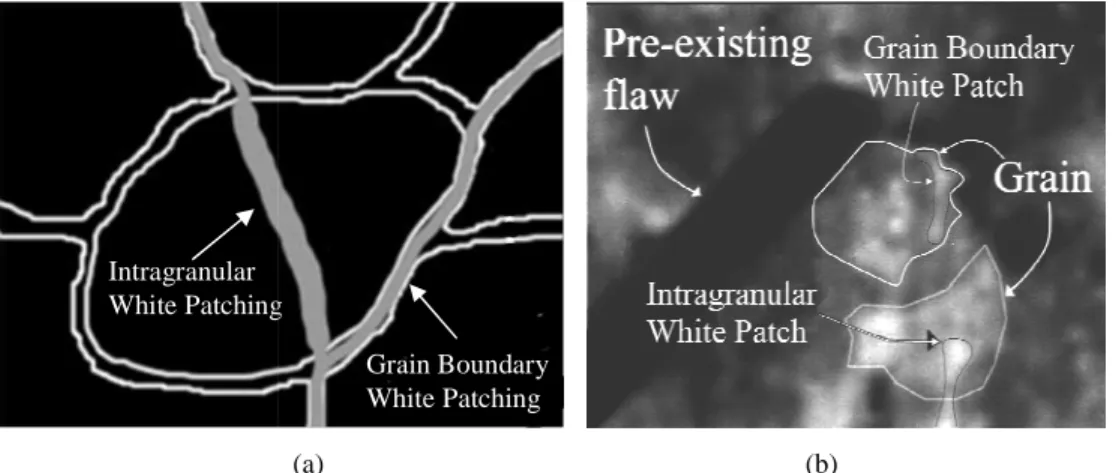
3.1.1 Linear White Patching
Linear white patching can be subdivided into two different types: and intragranular (Fig.
of a grain, while intragranular
Fig. 8) (Miller 2008). The type of linear white patching alternated between intragranular and grain bound
Fig. 8 (a) Schematic illustration of the difference between
patching. (b) Magnified image of a test showing an example white patching (Modified from Miller, 2008).
Intragranular White Patching (b)
(a) Linear white patching between two flaws (b) Diffusive or area white patching between
3.1.1 Linear White Patching
Linear white patching can be subdivided into two different types: grain
Fig. 8). Grain boundary white patching travels along the edge intragranular white patching travels through a grain (
2008). The type of linear white patching alternated between intragranular and grain boundary as it extended across a specimen.
(a) (b)
(a) Schematic illustration of the difference between intragranular and grain boundary patching. (b) Magnified image of a test showing an example grain boundary and intragranular
(Modified from Miller, 2008).
Linear White Patching White Patching Grain Boundary White Patching
(a) Linear white patching between two flaws (b) Diffusive or area white patching between
grain-boundary vels along the edge white patching travels through a grain (Refer to 2008). The type of linear white patching alternated between
intragranular and grain boundary white grain boundary and intragranular
Diffusive White Patching
Linear white patching often initiated at or near the flaw edges or tips and extended toward the direction of
branching during loading, when another line of white patching extended off from the main linear white patch (
patching also occurred parallel to the linear white patching
failure widened up to
Fig. 9 Progression of linear white patching, initiating from the inner tip of the left flaw and
extending downwards, away from the flaw as the stress increases. Branching also occurs as stress increases
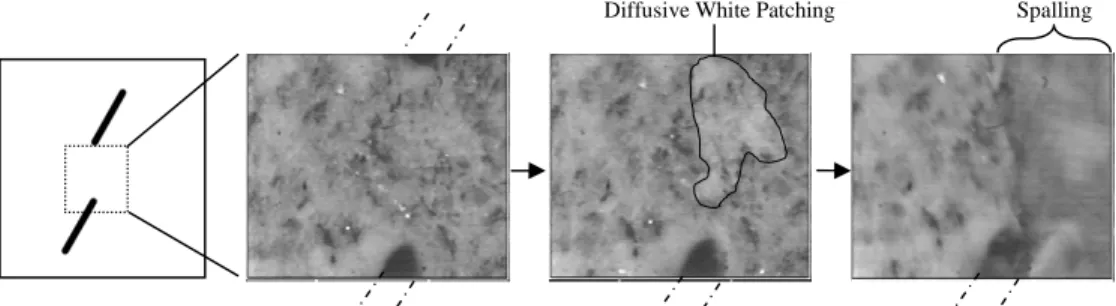
3.1.2 Diffusive White Patching
In diffusive white patching multiple grains whitened entirely with no preferential direction (Fig. 10). Diffusive white patching was found most often in an area before spalling occurred (
surface). Although spalling
associated with shear cracking, diffusive white patching was also observed to occur in some cases before both tensile and shear cracking. Diffusive white patching commonly occurred near a flaw tip and at the later
prior to cracking.
Linear white patching often initiated at or near the flaw edges or tips and extended toward the direction of loading. Linear white patching usually experienced branching during loading, when another line of white patching extended off from the main linear white patch (Fig. 9). As loading increased, additional linear white patching also occurred parallel to the initial white patching lines, producing wider linear white patching (Refer to Fig. 9). In some cases, linear white patching at
widened up to four times the initial width.
Progression of linear white patching, initiating from the inner tip of the left flaw and extending downwards, away from the flaw as the stress increases. Branching also occurs as stress
3.1.2 Diffusive White Patching
patching multiple grains whitened entirely with no preferential 10). Diffusive white patching was found most often in an area before spalling occurred (Fig. 10) (Spalling: Pieces detaching from the specimen surface). Although spalling and diffusive white patching were typically
associated with shear cracking, diffusive white patching was also observed to occur in some cases before both tensile and shear cracking. Diffusive white patching commonly occurred near a flaw tip and at the later stages of the test, just
13 Linear white patching often initiated at or near the flaw edges or tips and extended
loading. Linear white patching usually experienced branching during loading, when another line of white patching extended off from
9). As loading increased, additional linear white initial white patching lines, producing wider
linear white patching at
Progression of linear white patching, initiating from the inner tip of the left flaw and extending downwards, away from the flaw as the stress increases. Branching also occurs as stress
patching multiple grains whitened entirely with no preferential 10). Diffusive white patching was found most often in an area
from the specimen typically
associated with shear cracking, diffusive white patching was also observed to occur in some cases before both tensile and shear cracking. Diffusive white
stages of the test, just
White Patch Branching
White Patch Widening
Fig. 10 Diffusive white patching between flaw tips progressing to spalling
3.2 Progression of White Patching, Cracking and Coalescence
There were two types of cracks observed in Barre granite: tensile cracks and shear cracks. Using high speed images taken during cracking, these crack types were identified by the behavior in wh
cracks are characterized by an opening of the crack faces and shear cracks are characterized by a relative
cracking refers to cracks which
then propagate as the alternative crack
different cracking types in coalescence cracking could be clearly identified [Note: Combined tensile-shear cracking must not be confused
definition of mixed-mode cracking in which tensile and shear cracks appear to occur "simultaneously"
Early testing in granite primarily focused on cracking and coalescence only, therefore the progression of white patching to cracki
geometry pairs (45 tests),
propagation of white patching leading to cracking and coalescence. It should a be noted that cracking was
on the order in which it occurred. Primary cracking refers to the first crack to initiate at or near a flaw tip. Second
flaw at which primary cracking has already occurred. It is important to although other studies use the term secondary cracking and shear cracking interchangeably; this study uses these terms only to differentia
order of cracks. Crack coalescence will be differentiated between indirect
Diffusive white patching between flaw tips progressing to spalling
3.2 Progression of White Patching, Cracking and Coalescence
There were two types of cracks observed in Barre granite: tensile cracks and shear cracks. Using high speed images taken during cracking, these crack types were identified by the behavior in which the crack initiated and propagated. Tensile cracks are characterized by an opening of the crack faces and shear cracks are characterized by a relative sliding along the crack faces. Combined tensile cracking refers to cracks which initiate as one crack type, tensile or shear
the alternative crack type. With high speed observations, different cracking types in coalescence cracking could be clearly identified [Note:
shear cracking must not be confused with the traditional mode cracking in which tensile and shear cracks appear to occur "simultaneously"].
Early testing in granite primarily focused on cracking and coalescence only, therefore the progression of white patching to cracking was based on only 19 geometry pairs (45 tests), tested later, which specifically noted the initiation and propagation of white patching leading to cracking and coalescence. It should a be noted that cracking was characterized by two separate designations depending on the order in which it occurred. Primary cracking refers to the first crack to initiate at or near a flaw tip. Secondary cracks are any other crack that
flaw at which primary cracking has already occurred. It is important to although other studies use the term secondary cracking and shear cracking interchangeably; this study uses these terms only to differentiate between the
Crack coalescence will be differentiated between indirect
Diffusive White Patching
3.2 Progression of White Patching, Cracking and Coalescence
There were two types of cracks observed in Barre granite: tensile cracks and shear cracks. Using high speed images taken during cracking, these crack types were
ich the crack initiated and propagated. Tensile cracks are characterized by an opening of the crack faces and shear cracks are
Combined tensile-shear tensile or shear, and high speed observations, the different cracking types in coalescence cracking could be clearly identified [Note:
ith the traditional mode cracking in which tensile and shear cracks appear to
Early testing in granite primarily focused on cracking and coalescence only, ng was based on only 19 later, which specifically noted the initiation and propagation of white patching leading to cracking and coalescence. It should also
ions depending on the order in which it occurred. Primary cracking refers to the first crack to
ary cracks are any other crack that occurs at a flaw at which primary cracking has already occurred. It is important to note that although other studies use the term secondary cracking and shear cracking
te between the Crack coalescence will be differentiated between indirect
15 coalescence (involving two or more cracks which coalesce at a point outside the immediate bridging zone as defined by Wong [2008]) and direct coalescence (involving only cracks which directly coalesce between the flaws).
The progression of white patching to cracking and coalescence can be sub-divided into two categories based on the flaw and bridging angles. Flaw pairs with a low combined flaw and bridging angle (α+β < 60o) typically showed white patching, primary anti-wing cracks, secondary wing cracks and then indirect coalescence (Fig. 11). Flaw pairs with a high combined flaw and bridging angle (α+β ≥ 60o) typically showed white patching, primary wing cracks, coalescence and then, in some cases, secondary cracking (Fig. 12). In both scenarios, white patching was observed to initiate and fully propagate throughout the specimen before cracks had initiated. In a small number of tests, white patching was observed after cracking initiated but only for secondary cracking.
For flaw pairs with low flaw and bridging angles, initial white patching associated with primary tensile anti-wing cracks appeared near the inner flaw tips (Refer to Fig. 11). Secondary and coalescence white patching then appeared. Primary white patching expanded and propagated in the direction of loading and as the load increased the linear white patching branched and expanded. Coalescence of white patching occurred and typically had some diffusive white patching (white patching coalescence will be discussed in more detail later in section 3.4). Primary anti-wing cracks then initiated at the inner flaw tips near the initial white patching. Secondary wing cracks typically followed primary cracks. Indirect coalescence cracking then occurred between the primary anti-wing cracks that initiated at the inner flaw tips.
Fig 11 Systematic progression from white patching to coalescence observed in Barre granite between flaw pairs with low flaw angles a
Linear white patching initiates. Tensile anti-wing cracks will eventually follow the white patch
The linear white patching propagates. Secondary white patching occurs at the location of secondary cracking and coalescence. ~75% ~80% ~20% ~15% α β White patching associated with primary cracking Secondary white patching Percentage of Peak Load Standard Deviation Event Description
Systematic progression from white patching to coalescence observed in Barre granite between flaw pairs with low flaw angles a The linear white
patching propagates. Secondary white patching occurs at the location of secondary
White patching extends, branches and expands. White patching coalesces between the flaws. Coalescence white patching was either diffusive or linear.
Primary tensile anti-wing cracks initiate.
Primary tensile anti wing cracks Secondary (or anti-may initiate coalescence. ~80% ~90% ~15% ~10% Secondary white patching Coalescence white patching Primary tensile crack initiation Primary tensile crack initiation Secondary tensile crack initiation 16 Systematic progression from white patching to coalescence observed in Barre granite between flaw pairs with low flaw angles and low bridging angles (α+β < 60o)
Primary tensile anti-wing cracks propagate.
econdary tensile wing -wing) cracks itiate before coalescence. Secondary cracking propagates. Coalescence cracking forms indirectly between primary cracks initiated at the inner flaw tips.
~93% ~96% ~15% ~5% Secondary tensile initiation Indirect coalescence cracking
Fig. 12 Systematic progression from white patching to coalescence observed in Barre granite between flaw pairs with high flaw angles Note: This is a general progression from white patching to cracking to coalescence and there
anti-wing cracks occurring at the inner flaw tips, which did not always occur. the exterior edges of the outer flaw tips near primary crack initiation
Linear white patching initiates. Tensile wing cracks will eventually follow the white patch.
The linear white patching propagates. White patching coalesces between the flaws (diffusive for eventual shear coalescence and linear for eventual tensile coalescence). Secondary white patching occurs at the location of secondary cracking. ~50% ~55% ~15% ~15% Event Description Percentage of Peak Load Standard Deviation White patching associated with primary cracking White patching coalescence β α (a) (b)
Systematic progression from white patching to coalescence observed in Barre granite between flaw pairs with high flaw angles
Note: This is a general progression from white patching to cracking to coalescence and there were variations between tests series. The specific example above shows secondary wing cracks occurring at the inner flaw tips, which did not always occur. In a limited number of tests with high bridging angles, additional secondary cracks also occu
crack initiation (not shown above). The linear white
patching propagates. patching coalesces between the flaws (diffusive for coalescence and linear for eventual tensile coalescence). Secondary white patching occurs at secondary cracking.
White patching extends, branches and expands.
(In some tests secondary white patching and secondary cracking does not form.)
Primary tensile wing cracks initiate near the location of initial white patching.
Primary tensile wing cracks propagate coalescence occurs, and then secondary wing tensile initiate coalescence. ~55% ~80% ~15% ~15% Secondary white patching Primary tensile crack initiation Primary tensile wing crack initiation Direct coalescence cracking (c) (d) 17 Systematic progression from white patching to coalescence observed in Barre granite between flaw pairs with high flaw angles and high bridging angles (α+β ≥ 60o).
were variations between tests series. The specific example above shows secondary with high bridging angles, additional secondary cracks also occurred at
Primary tensile wing propagate, direct coalescence occurs, and
econdary anti-tensile cracks
after coalescence.
Secondary cracking propagates at the inner flaw tips. ~85% ~85% ~13% ~13% Secondary anti-wing crack initiation coalescence cracking Secondary anti-wing crack propagation (e) (f)
For flaw pairs with high flaw and bridging angles, initial white patching associated with primary tensile wing cracks appeared near the outer flaw tips (Refer to Fig. 12). Secondary and coalescence white patching then appeared. Primary white patching expanded and propagated in the direction of loading. Coalescence of white patching occurred and was typically diffusive for eventual direct shear coalescence and linear for eventual direct tensile coalescence. In tests where secondary cracking occurred, white patching associated with secondary cracks at the inner flaw tips propagated. Primary wing cracks then initiated at the outer flaw tips near the location of initial white patching. Direct coalescence cracking between the inner flaw tips followed primary cracking. In a limited number of tests with high bridging angles, additional secondary cracks occurred at the exterior edges of the outer flaw tips near primary crack initiation.
3.3 Cracking Characteristics 3.3.1 Tensile and Shear Cracks
Due to the fact that cracks typically followed grain boundaries and Barre granite has large grain sizes that are macroscopically visible, unique cracking
characteristics were observed:
Tensile cracking in granite specimens typically followed grain boundaries (Fig. 13). In very rare occasions grain splitting was observed. Therefore tensile cracking was typically very "jagged" in shape as it propagated along a meandering path defined by the grain boundaries (Fig. 13).
If shear cracking occurred it did so after primary cracking, typically as part of coalescence cracking but in rare occasions shear cracking occurred as part of secondary cracking. However, tests conducted on granite showed much less shear cracking compared to similar flaw pair geometries conducted on rocks with smaller grain sized such as gypsum or Carrara marble (See Table 3).
Fig. 13 Schematic representation of tensile cracking
example photograph in granite. Tensile cracks were jagged in shape due to large grains around which the crack propagated
Table 3 Percentage of tests in which one or more shear cracks were observed (either secondary or
coalescence shear cracking). Tests conducted on granite are compared to equivalent flaw pair geometries previously tested in marble and gypsum.
out of the total number of tests are shown in parenthesis *Tests were conducted by Wong (2008)
Flaw Pair Geometry 2a-Average Grain Boundary Mineral Grain
entation of tensile cracking along grain boundaries and a representative example photograph in granite. Tensile cracks were jagged in shape due to large grains around which the crack propagated
Percentage of tests in which one or more shear cracks were observed (either secondary or coalescence shear cracking). Tests conducted on granite are compared to equivalent flaw pair geometries previously tested in marble and gypsum. The number of tests observing shear cracks out of the total number of tests are shown in parenthesis
*Tests were conducted by Wong (2008)
Flaw Pair Geometry
Material
Granite Marble* Gypsum*
-0-0 33%(1/3) 100%(2/2) 100%(3/3) -30-0 33%(1/3) 100%(2/2) 100%(4/4) -45-0 67%(3/3) 100%(3/3) 100%(5/5) -60-0 100%(2/2) 100%(2/2) 100%(4/4) -75-0 100%(2/2) 50%(1/2) 100%(3/3) -30-30 50%(1/2) 100%(2/2) 100%(5/5) -30-60 50%(1/2) 67%(2/3) 100%(6/6) Average 62% 88% 100% "Jagged" Tensile Crack Observed Tensile Opening of Grain Boundary 19 along grain boundaries and a representative example photograph in granite. Tensile cracks were jagged in shape due to large grains around
Percentage of tests in which one or more shear cracks were observed (either secondary or coalescence shear cracking). Tests conducted on granite are compared to equivalent flaw pair
observing shear cracks "Jagged" Tensile Crack
Two important material parameters regarding the development of shear cracking are the mineral grain shear strength and grain size (See Table 4). Increasing mineral grain shear strength decreases mineral breakage, therefore less shear cracking appears to occur. Barre granite has stronger minerals (feldspar and quartz) compared to Carrara marble (calcite) and gypsum. Also, it is possible that larger grain sizes can increase dilatant shear resistance. Dilatancy, that is the displacement normal to the shearing direction, is related to the angle grain edges make relative to the direction to shearing and to grain size. Barre granite has a much larger average grain size (1705 µm) than Carrara marble (125 µm), which in turn has a larger average grain size compared to gypsum (50 µm) (Table 4). Therefore the reduction in observed shear cracking in granite is likely related to increased resistance to grain shearing as well as larger grains in granite possibly increasing dilatancy (Fig. 14).
Table 4 Grain size of previously materials tested rocks compared to Barre granite
*: From an SEM investigation by Wong and Einstein (2009c) +: From Igbal and Mohanty (2006)
++: From Goldsmith et al. (1976)
Material Grain Size Average Grain Sizes
Molded Gypsum* 50 µm long, 2 µm wide 50 µm
Carrara Marble* 50 µm - 200µm 125 µm Barre Granite 0.87 mm+ – 2.54 mm++ 1705 µm
Fig. 14 Schematic representation o
photograph in granite. Shear cracks appeared to follow grain boundaries observations.
Similar to tensile cracks, shear cracks appea high speed imagery.
that shear cracks were typically smoother than tensile cra residue indicating grain breakage
due to large sliding displacement al initiated and propagated.
When shear cracking occurred it was typically
Spalling, the detachment of sheet like pieces from the specimen surface, sometimes obscured the surface
with the high speed camera much more difficult
fractography observations had to be used to confirm that cracks occurred. Spalling varied in area (0.06
white patching. The spalled pieces were
hematic representation of shearing along grain boundaries and a representative example Shear cracks appeared to follow grain boundaries in high speed
Similar to tensile cracks, shear cracks appeared to follow grain boundaries i However, post-mortem fractography observations
that shear cracks were typically smoother than tensile cracking and had a powdery grain breakage. Grain breakage was believed to have occurred
displacement along the crack surface after the shear crack initiated and propagated.
When shear cracking occurred it was typically associated with surface , the detachment of sheet like pieces from the specimen surface,
sometimes obscured the surface of the specimen and made determining cracking with the high speed camera much more difficult, therefore post-mortem
observations had to be used to confirm that cracks occurred. Spalling varied in area (0.06-0.50 in2; 40-325 mm2) depending on the area of white patching. The spalled pieces were typically 0.04 - 0.08 in (1-2
Shearing Opening of Grain Boundary
21 long grain boundaries and a representative example
high speed
red to follow grain boundaries in the observations revealed d had a powdery Grain breakage was believed to have occurred
ong the crack surface after the shear crack
associated with surface spalling. , the detachment of sheet like pieces from the specimen surface,
made determining cracking mortem
observations had to be used to confirm that cracks occurred. n the area of
and occurred on both faces of the specimen (front and back). Although spalling breakage occurred out of plane in the specimens, the spalled pieces were much thinner than the specimen thickness (8-16% of specimen thickness). Therefore it is believed that out-of-plane surface spalling did not affect the cracks which persisted through the specimen thickness.
3.3.2 Crack Initiation
Primary cracking was always tensile and typically initiated near or at a flaw tip, where linear white patching was previously observed (Fig. 15). Primary tensile cracking typically initiated at either the inner or outer flaw tips. In some cases cracking was observed to initiate in the matrix away from the flaw tip (Refer to Fig. 15).
However, due to the heterogeneous nature of granite's mineral composition, it is very difficult to identify crack initiation away from the flaw tip. Isolated cracking near flaw tips has been previously observed numerically (Ingraffea and Heuze, 1980; Zhang and Wong, 2012) and experimentally (Morgan, 2011).
Tensile Crack Initiation Tensile Crack Initiation
23
Fig. 15 Primary tensile crack initiation observed near a flaw tip. In most instances primary tensile
cracks initiated at the flaw tip. In some tests, tensile cracking was also observed to initiate at a white patching location away from the flaw
3.4 Coalescence White Patching and Cracking 3.4.1 White Patching - Cracking Sequence
After white patching associated with primary cracking occurred, but before primary cracks appeared, white patching associated with subsequent secondary cracking and coalescence occurred. There were two different progressions of coalescence white patching based on the mode of coalescence cracking (tensile or shear) (Figs. 16-17).
Tensile coalescence typically began with a distinct linear white patch, which in some cases could be seen propagating from one flaw to the other (Fig. 16). After the linear white patch coalesced between the two flaws, it expanded diffusively into a larger white patching zone. Tensile cracking then occurred between the flaws.
Shear coalescence typically began with diffusive white patching appearing at the inner flaw tips (Fig. 17). As the load increased this diffusive white patching extended and coalesced between the flaws. The white patching zone then expanded diffusively creating a large white patch zone between the flaws. Shear cracking then occurred between the two inner flaw tips. Spalling was typically present when shear cracking occurred. It should be noted that shear crack coalescence was observed much less in granite than it was in marble and gypsum (Wong and Einstein 2009a), which will be discussed more thoroughly in section 3.4.2. As a result, the observable white patching progression for shear crack coalescence is based on fewer tests and is still not fully understood.
Initial Configuration A linear white patch forms at one or both of the inner flaw tips.
Fig. 16 Progression from white patching to tensile coalescence cracking (a)
A linear white patch forms at one or both of the inner flaw
The linear white patching connects the inner tips of the flaws.
Diffusive white patching is observed around the area of linear white patching before cracking.
Progression from white patching to tensile coalescence cracking. White patching has been outlined
(b) (c) (d) White Patching 24
Diffusive white patching is observed around the area of
patching before
A tensile crack forms between the inner flaw tips along the linear white patching line.
(e)
Tensile Crack
Initial Configuration Diffusive white patching forms at both of the inner flaw tips.
Fig. 17 Progression from white patching to shear coalescence c (a)
Diffusive white patching forms at both of the inner flaw tips.
The white patching extends and connects the inner tips of the flaws.
Diffusive white patching expands between the inner flaw tips before cracking.
Progression from white patching to shear coalescence cracking. White patching has been outlined
(b) (c) (d) White Patching 25
iffusive white patching expands between the inner flaw tips before cracking.
A shear crack forms between the inner flaw tips. Spalling typically occurs near diffusive white patching.
(e)
Shear Crack
3.4.2 Coalescence Patterns
The crack coalescence patterns observed for all of the geometries tested are summarized in Figs. 18-20. The geometric configurations were categorized by ligament length (L), bridging angle (α) and flaw angle (β). Each box represents the most common coalescence pattern observed for that flaw pair geometry. Based on the coalescence pattern observed, the corresponding Wong and Einstein (2009a) coalescence category number (Refer to Fig. 1) was assigned. Each coalescence behavior was also noted with a label whether there was no coalescence, indirect coalescence or direct coalescence.
From the coalescence behavior observed in granite the following trends regarding the coalescence behavior with respect to flaw angle and flaw pair bridging angle can be discerned (Fig. 21 for ligament length a and Fig. 22 for ligament length 2a). For each test, the Wong and Einstein coalescence number was plotted together with the indication if coalescence was “indirect”, “direct shear”, “direct combined tensile/shear", or “direct tensile” (See Fig. 1 for definitions).
Fig. 18 Schematic of the coalescence behavior from (a) the
where L is the ligament length between the two inner flaw tips (a is half the flaw length),
angle between the flaws. Each coalescence behavior observed was assigned the Wong and Einstein (2009 labeled with either "None" for no coalescence,
or "Direct" for coalescence involving cracks whi
β Flaw Angle 75 60 45 30 0 Flaw Spacing: L=a 0 Direct - (4) b Direct - (4)b Indirect - (2)b Indirect - (2)a,b Indirect - (2)a,b
Test Conducted By (See Caption for Key)
Schematic of the coalescence behavior from (a) the present series, (b) Miller (2008) and (c) Martinez (1999) tested in granite with flaw spacing L = a, the ligament length between the two inner flaw tips (a is half the flaw length), β is the flaw angle with respect to the hori
angle between the flaws. Each coalescence behavior observed was assigned the Wong and Einstein (2009a) coalescence category number in parenthesis and labeled with either "None" for no coalescence, "Indirect" for coalescence of two or more cracks which coalesce at a point outside the immediate bridging zone or "Direct" for coalescence involving cracks which directly coalesce between the flaws
15 30 45
α
Direct - (3)c
Indirect - (2) a Indirect - (2)a Direct - (6)a
Indirect - (2) a
- Bridging Angle Conducted By (See Caption for Key)
27 series, (b) Miller (2008) and (c) Martinez (1999) tested in granite with flaw spacing L = a,
is the flaw angle with respect to the horizontal, and α is the bridging a) coalescence category number in parenthesis and "Indirect" for coalescence of two or more cracks which coalesce at a point outside the immediate bridging zone
45 60
Wong-Einstein (2009a) Coalescence Category
Direct - (7) / None - (1)b
Direct - (6)b
Direct - (7)b
Direct - (3) / (5)b
Fig. 19 Schematic of the coalescence behavior of various geometric flaw pairs tested in granite with flaw spacing L = 2a. See figure β Flaw Angle 75 60 45 30 0 Flaw Spacing L=2a 0 Direct-(5)b Indirect - (2)b Indirect-(2) b Indirect - (2)b Indirect -(2) b
Schematic of the coalescence behavior of various geometric flaw pairs tested in granite with flaw spacing L = 2a. See figure
15 30
α
Direct-(8) / None
Direct-(3)c Direct - (7)b
Direct - (6)b
Indirect - (2)a Indirect - (2)a Direct - (7)b
Indirect - (2) / None
- Bridging Angle
28 Schematic of the coalescence behavior of various geometric flaw pairs tested in granite with flaw spacing L = 2a. See figure 18 caption for explanation
60
(8) / None–(1) b
Fig. 20 Schematic of the coalescence behavior of various geometric flaw pairs tested in granite
with flaw spacing L = 3a. See figure 18 caption for explanation
Fig. 21 The coalescence behavior observed in granite with a flaw spacing of L = a with respect to
flaw angle (β) and flaw pair bridging angle ( number is shown below each geometry tested. The c and Einstein #2), direct-shear (#3
Domains are defined based on indirect, direct shear 0 10 20 30 40 50 60 70 80 90 0 10 F la w A n g le β Flaw Angle 60 45 Flaw Spacing L=3a 2 2 2 4 4 Direct - (5)
Schematic of the coalescence behavior of various geometric flaw pairs tested in granite . See figure 18 caption for explanation
The coalescence behavior observed in granite with a flaw spacing of L = a with respect to ) and flaw pair bridging angle (α). The Wong and Einstein (2009a) coale
each geometry tested. The coalescence is characterized as indirect (Wong shear (#3-4), direct-combined tensile/shear (#5), and direct
Domains are defined based on indirect, direct shear-combined and direct tensile coalescence
20 30 40 50 60 70 80 Bridging Angle Indirect Direct - Shear Direct - Mixed Direct - Tensile 0 30 45 α Tensile Shear-Combined Indirect 2 2 2 2 6 6 7 7 3 5 (5)c Direct - (5)c *None - (1)c - Bridging Angle 29 Schematic of the coalescence behavior of various geometric flaw pairs tested in granite
The coalescence behavior observed in granite with a flaw spacing of L = a with respect to ) coalescence oalescence is characterized as indirect (Wong
(#5), and direct-tensile (#6-9). and direct tensile coalescence
90 Shear Mixed Tensile 45 Tensile
Fig. 22 The coalescence behavior observed in granite with a flaw spacing of L = 2a with respect to
flaw angle (β) and flaw pair bridging angle (
number is shown below each geometry tested. The coalescence is and Einstein #2), direct-shear (#3
Domains are defined based on indirect, direct shear
Three major domains
(labeled “indirect”), direct shear or
“shear-combined”), and tensile coalescence (labeled “tensile”). The shear combined domain includes direct shear or direct
coalescence. Due to the limited number of tests conducted, these coalescence domains were defined using linear boundaries as a first order approximation to predict the coalescence behavior based on flaw angle and bridging angle.
In the coalescence plots (
“a” and “2a” can be seen in the shifting of the boundary between the indirect and the shear-combined coalescence
19, more indirect coalescence was observed in tests with a flaw spacing of “2a” and this is reaffirmed in a shift of the indirect
0 10 20 30 40 50 60 70 80 90 0 10 F la w A n g le 2 2 2 5 2
The coalescence behavior observed in granite with a flaw spacing of L = 2a with respect to ) and flaw pair bridging angle (α). The Wong and Einstein (2009a) coales
each geometry tested. The coalescence is characterized as indirect (Wong shear (#3-4), direct-combined tensile/shear (#5), and direct
Domains are defined based on indirect, direct shear-combined and direct tensile coalescence
domains of coalescence can be defined for indirect coalescence (labeled “indirect”), direct shear or combined tensile-shear coalescence (labeled
”), and tensile coalescence (labeled “tensile”). The shear includes direct shear or direct combined tensile-shear coalescence. Due to the limited number of tests conducted, these coalescence
were defined using linear boundaries as a first order approximation to predict the coalescence behavior based on flaw angle and bridging angle.
the coalescence plots (Figs. 21 and 22), a difference between a flaw spacing of “a” and “2a” can be seen in the shifting of the boundary between the indirect and
coalescence domains. As previously observed in
rect coalescence was observed in tests with a flaw spacing of “2a” and this is reaffirmed in a shift of the indirect domain boundary.
10 20 30 40 50 60 70 80 Bridging Angle Indirect Direct - Shear Direct - Mixed Direct - Tensile Tensile Indirect 2 2 2 7 7 8 3 6 Shear-Combined
The coalescence behavior observed in granite with a flaw spacing of L = 2a with respect to coalescence characterized as indirect (Wong
(#5), and direct-tensile (#6-9). and direct tensile coalescence
escence can be defined for indirect coalescence oalescence (labeled ”), and tensile coalescence (labeled “tensile”). The
shear-shear coalescence. Due to the limited number of tests conducted, these coalescence
were defined using linear boundaries as a first order approximation to predict the coalescence behavior based on flaw angle and bridging angle.
21 and 22), a difference between a flaw spacing of “a” and “2a” can be seen in the shifting of the boundary between the indirect and
s. As previously observed in Figs. 18 and rect coalescence was observed in tests with a flaw spacing of “2a”
90 Shear Mixed Tensile
31 The observed coalescence trends as defined by the bridging angle (α), ligament length (L), or flaw angle (β) can be interpreted as follows:
• Bridging Angle (α)
The effect of bridging angle on coalescence is best exemplified by comparing the coalescence behaviors of flaw pairs with various bridging angles (α) at a constant flaw angle (β) of 30 degrees (Figs. 18-22). As the bridging angle between flaws increases the Wong and Einstein (2009a) coalescence category number increases. This corresponds to a trend from indirect coalescence, to direct shear or combined tensile-shear coalescence, to direct-tensile coalescence as the bridging angle increases.
• Ligament Length (L)
The coalescence of pairs with shorter ligament lengths appears to have slightly less indirect coalescence. This can be specifically seen in tests conducted for both "a" and "2a" ligament lengths with a bridging angle (α) of 30 degrees and flaw angles (β) of 30 degrees, as well as the flaw pairs with a bridging angle of 0 degrees and a flaw angle of 60 degrees (Figs. 18-22). In other words, as ligament length decreases there is a trend from indirect coalescence, to direct shear or combined tensile-shear coalescence, to direct tensile coalescence.
• Flaw Angle (β)
The effect of flaw angle on coalescence is best exemplified by comparing the coalescence behaviors of flaw pairs with various flaw angles (β) at constant bridging angles (α) of either 0 or 60 degrees (Refer to Figs. 18-22). As the flaw angle increases there is an increase in the Wong and Einstein (2009a) coalescence category number. This corresponds to a trend from indirect coalescence, to direct shear or combined tensile-shear coalescence, to direct tensile coalescence as flaw angle is increased.
3.4.3 Comparison to Previous Coalescence Research by Wong and Einstein (2009a) and Martinez (1999)
A similar coalescence plot can be developed for marble from previous research on Carrara and Vermont White marble tested by Wong and Einstein (2009a) and Martinez (1999) respectively (Fig 23). Another plot can also be developed from previous research conducted on gyspum by Wong and Einstein (2009a) (Fig 24). Comparing these rocks to the granite tests conducted with a ligament length “2a” (Fig. 22), a reduction in the indirect coalescence domain can be seen for gypsum and marble compared to granite. Marble experienced more direct tensile
coalescence compared to granite (Fig. 23). Gypsum experienced much more shear and combined tensile-shear coalescence compared to granite (Fig. 24).
An important consideration when comparing these trends are the mineral composition and grain size of each material. As previously stated, the two most important material parameters regarding the development of shear cracking are the grain (mineral) shear strength and grain size. Increasing mineral grain shear strength decreases mineral breakage, therefore less shear cracking occurs. Barre granite has the strongest minerals and largest grain size of the three materials. Gypsum has the weakest grain strength and smallest grain size of the three materials. Hence, it is expected that shear cracking occurs least in granite and the most in gypsum. This trend was confirmed by the increase in the shear domain as grain size and strength is decreased [granite>marble>gypsum] (Refer to Figs. 22-24)
Fig. 23 The coalescence behavior observed in
spacing of L = 2a with respect to flaw angle ( Einstein (2009a) coalescence number is shown below characterized as indirect (Wong and Einstein #2), dire tensile/shear (#5), and direct
combined and direct tensile coalescence *: Test conducted by Martinez (1999)
Fig. 24 The coalescence behavior observed in gypsum with a flaw spacing of L = 2a with respect
to flaw angle (β) and flaw pair bridging angle (
number is shown below each geometry tested. The coalescence is characterized as indirect (Wong and Einstein #2), direct-shear (#3
Domains are defined based on indirect, direct shea 0 10 20 30 40 50 60 70 80 90 0 10 F la w A n g le 0 10 20 30 40 50 60 70 80 90 0 10 F la w A n g le Indirect 3 5 2 5 5 2,3 2 2 3*,4*, 6 6 Indirect
The coalescence behavior observed in Carrara and Vermont White marble
spacing of L = 2a with respect to flaw angle (β) and flaw pair bridging angle (α). The Wong and cence number is shown below each geometry tested. The coalescence is characterized as indirect (Wong and Einstein #2), direct-shear (#3-4), direct-combined
5), and direct-tensile (#6-9). Domains are defined based on indirect, direct shear and direct tensile coalescence
*: Test conducted by Martinez (1999) on Vermont White marble
The coalescence behavior observed in gypsum with a flaw spacing of L = 2a with respect ) and flaw pair bridging angle (α). The Wong and Einstein (2009a) coales
each geometry tested. The coalescence is characterized as indirect (Wong shear (#3-4), direct-combined tensile/shear (#5), and direct
Domains are defined based on indirect, direct shear-combined and direct tensile coalescence
10 20 30 40 50 60 70 80 Bridging Angle Indirect Direct - Shear Direct - Mixed Direct - Tensile 10 20 30 40 50 60 70 80 Bridging Angle Indirect Direct - Shear Direct - Mixed Direct - Tensile Tensile Indirect 5 5 Shear-Combined 6 5 Tensile Indirect Shear-Combined 5* 5* 5* 33 with a flaw The Wong and each geometry tested. The coalescence is
combined
9). Domains are defined based on indirect, direct
shear-The coalescence behavior observed in gypsum with a flaw spacing of L = 2a with respect The Wong and Einstein (2009a) coalescence each geometry tested. The coalescence is characterized as indirect (Wong
(#5), and direct-tensile (#6-9). and direct tensile coalescence
90 Shear Mixed Tensile 90 Shear Mixed Tensile Tensile 6,7 6,7
4 Summary and Conclusions
Using high speed imagery, the detailed cracking and coalescence behavior in Barre granite was observed. Prior to cracking, process zones of visible grain brightening, so called "white patching", were observed. Two types of white patching were observed in granite: Linear white patching and diffusive white patching. Linear white patching typically preceded tensile cracking and diffusive white patching typically preceded shear cracking. It was shown quantitatively from observed stress levels that linear white patching process zones corresponded to pre-crack events. From this, it may be possible to determine when cracking or, more importantly, failure will occur based on the visualization of white patching.
The process zones (white patching) propagated, expanded and coalesced prior to the occurrence of cracks. For flaw pairs with low flaw and bridging angles (α+β < 60o), primary anti-wing cracks initiated and propagated at the inner flaw tips, followed by secondary wing cracks at the outer flaw tips and then indirect coalescence. For flaw pairs with high flaw and bridging angles (α+β ≥ 60o), primary wing cracks initiated and propagated at the outer flaw tips, followed by direct coalescence between the inner flaw tips and then, in some tests, secondary cracking.
Tensile cracks in Barre granite were typically jagged in shape as they followed along grain boundaries. Shear cracks, which were less common than tensile cracks in granite, also followed grain boundaries. Tests on Barre granite had more tensile cracking and less shear cracking compared to other brittle materials such as Carrara marble and gypsum (Wong and Einstein 2009a). This difference is best explained by the larger and stronger mineral grains in Barre granite.
Crack coalescence in granite was observed for various flaw pair bridging angles (α), ligament lengths (L), and flaw angles (β). It was shown that coalescence behavior trended from indirect to direct shear and combined shear-tensile to direct tensile coalescence as the flaw pair bridging angle (α) or the flaw angle (β) increased. More indirect coalescence was observed as the ligament length (L)
35 between flaws was increased. Also, there was much more indirect and tensile coalescence observed in granite compared to previously studied brittle materials.
It can therefore be concluded that significant insights were gained into the
cracking behavior of granites. More interesting is the fact that white patching, i.e. process zones, precede the entire cracking process, marking the entire path along which cracks initiate, propagate and coalesce. Similar to what was observed in other brittle materials (gypsum, marble), the cracking patterns depend on the geometry of the pre-existing flaws. While the cracking patterns are similar in all materials, they are associated with different flaw geometries for different
materials. Finally, and as expected, strength and grain size of the material affect the detailed growth of cracks. All this applies at the scale investigated. It would be too speculative to state that this would also apply at larger or smaller scales. However, what was observed may provide directions as to what to study when testing at different scales.
5 Acknowledgements
The experimental research underlying the study presented in this paper was conducted, in addition to the first and second author, by A. Martinez, J. Miller, M. Berry and J. Harrow. S. Rudolph, played an essential role in building the
equipment and instructing its use. The high speed video camera was made available by the MIT Edgerton Laboratory. Support of the research came from NSF (Award No. 0555053), DoE(DE-FG-06GO16061), ARO (Award No. 007492-001) and the MIT Energy Initiative. This support is gratefully acknowledged, as is the interaction with the associated project officers.
6 References
Bobet, A. and Einstein, H.H. (1998) Fracture coalescence in rock-type materials under uniaxial and biaxial compression. Int. J Rock Mech Min Sci, 35(7), pp. 863-88.
Brace, W.F. and Bombolakis, E.G. (1963) A note on brittle crack growth in compression. J. Geophys Res, 68(12), pp. 3709-3713.
Brooks, Z. (2010) A Nanomechanical Investigation of the Crack Tip Process Zone of Marble. MSc Thesis, Massachusetts Institute of Technology
Brooks, Z., Einstein, H.E.E, and Ulm, F. (2010) A Nanomechanical Investigation of the Crack Tip Process Zone. 44th U.S. Rock Mechanics Symposium and 5th U.S.-Canada Rock Mechanics Symposium, June 27-30, 2010 , Salt Lake City, Utah.
Goldsmith, Sackman, and Ewert. (1976) Static and dynamic fracture strength of Barre Granite, Int. J. Rock Mech. Min. Sci. and Geomech. Abstr., Vol. 13, pp 303-309.
Hamiel, Y., Katz, O., Lyakhovsky, V., Reches, Z., and Fialko, Y. ( 2006) Stable and unstable damage evolution in rocks with implications to fracturing of granite. Geophys. J. Int., 167, pp 1005-1016.
Ingraffea, A.R. and F.E. Heuze. (1980) Finite element models for rock fracture mechanics, Int. J. Num. Anal. Meths. in Geomechs., 4, pp.25.
Iqbal and Mohanty. (2006) Experimental calibration of stress intensity factors of the ISRM suggested cracked chevron-notched Brazilian disc specimen used for determination of mode-I fracture toughness. mode-Int. JRock Mech. Min. Sci., 43, pp 1270-1276.
Kranz, R.L. (1979) Crack Growth and Development During Creep of Barre Granite. Int. J. Rock Mech. Min. Sci. & Geomech. Abstr., Vol. 16, pp 23-35.
Labuz, J.H., Shah, S.P. and Dowding, C.H. (1987) The Fracture Process Zone in Granite: Evidence and Effect. Int J. Rock Mech. Min Sci. & Geomech. Abstr., Vol. 24, No. 4, pp 235-246 .
Li YP, Chen LZ, Wang YH (2005) Experimental research on pre-cracked marble under compression. Int J of Solids Struct 42:2505–2516
Martinez, A.R. (1999) Fracture coalescence in natural rock. MSc Thesis, Massachusetts Institute of Technology..
Miller, J.T. (2008) Crack coalescence in granite. MSc Thesis, Massachusetts Institute of Technology.
Miller, J.T. and Einstein, H.H (2008) Crack Coalescence Tests on Granite. The 42nd U.S. Rock Mechanics Symposium (USRMS), June 29 - July 2, 2008, San Francisco, CA
Moore D.E. and Lockner, D.A. (1995) The role of microcracking in shear-fracture propagation in granite. Journal of Structural Geology, Vol. 17, No. 1, pp 95-114.
Morgan S.P. (2011) The effect of complex inclusion geometries on fracture and crack coalescence behavior in brittle material. Thesis, Massachusetts Institute of Technology.
Nasseri, M.H.B., Mohanty, B., and Young, R.P. (2006) Fracture Toughness Measurements and Acoustic Emission Activity in Brittle Rock. Pure appl. geophys., 163. 917-945.