HAL Id: hal-02368916
https://hal.archives-ouvertes.fr/hal-02368916
Submitted on 18 Nov 2019
HAL is a multi-disciplinary open access archive for the deposit and dissemination of sci-entific research documents, whether they are pub-lished or not. The documents may come from teaching and research institutions in France or abroad, or from public or private research centers.
L’archive ouverte pluridisciplinaire HAL, est destinée au dépôt et à la diffusion de documents scientifiques de niveau recherche, publiés ou non, émanant des établissements d’enseignement et de recherche français ou étrangers, des laboratoires publics ou privés.
Distributed under a Creative Commons Attribution| 4.0 International License
Raphaël Aguillon, Romain Madelaine, Marion Aguirrebengoa, Harendra
Guturu, Sandra Link, Pascale Dufourcq, Virginie Lecaudey, Gill Bejerano,
Patrick Blader, Julie Batut
To cite this version:
Raphaël Aguillon, Romain Madelaine, Marion Aguirrebengoa, Harendra Guturu, Sandra Link, et al.. Morphogenesis is transcriptionally coupled to neurogenesis during peripheral olfactory organ devel-opment. Development (Cambridge, England), Company of Biologists, 2020, �10.1242/dev.192971�. �hal-02368916�
Morphogenesis is transcriptionally coupled to neurogenesis during olfactory placode development
Raphaël Aguillon1, Romain Madelaine1, Harendra Guturu2, Sandra Link3§, Pascale Dufourcq1, Virginie Lecaudey3&, Gill Bejerano4, Patrick Blader1* and Julie Batut1*
1 Centre de Biologie du Développement (CBD, UMR5547), Centre de Biologie Intégrative (CBI, FR 3743), Université de Toulouse, CNRS, UPS, 31062, France. 2 Department of Electrical Engineering, Stanford University, Stanford, CA 94305, USA. 3 BIOSS Centre for Biological Signalling Studies, Albert Ludwigs University of Freiburg, Freiburg im Breisgau, Germany.
4 Department of Developmental Biology, Department of Computer Science, Department of Pediatrics, Department of Biomedical Data Science, Stanford University, Stanford, CA 94305, USA.
§ Present address: Universitäts-Herzzentrum Freiburg, Kardiovaskuläre Biologie/AG Moser, Breisacher Straße 33 · 79106 Freiburg, Germany.
& Present address: Goethe-Universität - Campus Riedberg, Institute for Cell Biology and Neuroscience, Department of Developmental Biology of Vertebrates, Max-von-Laue-Straße 13, D-60438 Frankfurt am Main, Germany.
*Correspondence to: patrick.blader@univ-tlse3.fr; julie.batut@univ-tlse3.fr
One Sentence Summary: Neurog1 controls olfactory placode morphogenesis via
Abstract
Morphogenesis of sense organs occurs concomitantly with the differentiation of sensory cells and neurons necessary for their function. While our understanding of the mechanisms controlling morphogenesis and neurogenesis has grown, how they are coordinated remains relatively unknown. The earliest wave of neurogenesis in the zebrafish olfactory placode requires the bHLH proneural transcription factor Neurogenin1 (Neurog1). To address whether Neurog1 couples neurogenesis and morphogenesis in this system, we analyzed the morphogenetic behavior of early olfactory neural progenitors. Our results indicate that the oriented movements of these progenitors are disrupted in neurog1 mutants. Morphogenesis is similarly affected by mutations in the chemokine receptor, cxcr4b, making it a potential Neurog1 target gene. We find that Neurog1 directly regulates cxcr4b through an E-boxes cluster located just upstream of the cxcr4b transcription start site. Our results suggest that proneural transcription factors, such as Neurog1, directly couple distinct aspects of nervous system development.
Results and Discussion
The morphology of sense organs of the head, such as the olfactory epithelium and retina, are exquisitely adapted for detecting specific stimuli. Concomitant with the morphogenetic movements that sculpt these structures during development, cell types are specified that will participate in their function either by detecting specific stimuli or transmitting sensory information to the brain. There is a growing literature concerning the molecular mechanisms controlling morphogenesis and specification of different cell types in sensory organs. Whether morphogenesis and cell fate specification are coupled molecularly during the development of these organs, on the other hand, is largely unexplored.
Neurogenesis in the developing zebrafish olfactory placode occurs in two distinct waves, with both requiring the proneural gene neurog1, which encodes a bHLH transcription factor (Blader et al., 1997; Madelaine et al., 2011). Concomitant with the earliest wave of neurogenesis in the developing olfactory placode, morphogenetic
movements shape placodal progenitors and newly born neurons into a rudimentary cup (Whitlock and Westerfield, 2000; Miyasaka et al., 2007; Breau et al., 2017). We hypothesized that in parallel to its role in olfactory neurogenesis Neurog1 is ideally placed to control the cell movements that underlie morphogenesis of the olfactory cup, thus coupling morphogenesis and neurogenesis. To address this possibility, we analyzed morphogenesis of the olfactory cup by time-lapse imaging neurog1 mutant or wild-type embryos carrying a Tg(-8.4neurog1:gfp) transgene (Golling et al., 2002; Blader et al., 2003); this transgenes recapitulates the expression of endogenous
neurog1 in the developing placode/cup and can be used as a short-term lineage label
for the progenitors of early olfactory neurons, referred to hereafter as EON (Madelaine et al., 2011; Breau et al., 2017). As recently described by Breau and colleagues, we found that EON reach their final position in wild-type embryos by converging towards a point close to the center of the future cup (as represented in Figure 1A; (Breau et al., 2017)). Considering overall antero-posterior (AP) length of the placode, this convergence appears to happen quickly between 12 and 18 hours post-fertilization (hpf), after which it slows (Figure S1A,B). In neurog1hi1059 mutants, we observed a delay in convergence, which translates into a longer AP length spread of EON than seen in wild-type embryos (Figure S1B). This delay is overcome, however, with the final cup in
neurog1hi1059 mutant embryos attaining AP length of control embryos around 27 hpf (Figure S1B).
To assess the morphogenetic phenotype of neurog1hi1059 mutant embryos at cellular resolution, we injected synthetic mRNAs encoding Histone2B-RFP (H2B-RFP) into Tg(-8.4neurog1:gfp) transgenic embryos, which were again imaged from 12 to 27 hpf. Morphogenetic parameters of individual EON located in the anterior, middle and posterior thirds of the neurog1:GFP+ population were then extracted from datasets generated by manually tracking H2B-RFP positive nuclei. The position of each tracked EON was then plotted according to their medio-lateral (X) and (Y) position. As for the global analysis, the behavior we observe for single EON in control embryos largely recapitulates those already reported (Figure 1B; (Breau et al., 2017)). Comparing the behavior of EON in neurog1hi1059 mutants and siblings, we found that whereas EON in the middle and posterior regions of mutant placodes migrate similarly to their wild-type
counterparts, the migratory behavior of anterior EON is profoundly affected in
neurog1hi1059 mutant embryos from 12 to 18 hpf (Figure 1B,C and Figure S2A);
morphogenetic movements of individual skin cells showed no obvious differences in control versus neurog1 mutants suggesting that the effect is specific to EON (Figure S3). Principal component analysis (PCA) of the morphometric datasets confirmed that the major difference between olfactory placode morphogenesis in control and
neurog1hi1059 mutant embryos (PC1) lies in the migratory behavior of anterior EON along the AP axis; PCA revealed a more subtle difference in migration of the middle EON population along the same axis (Figure 1D and Figure S2B) and between the posterior EON populations along the medio-lateral axis (Figure S2B). These migratory defects are not due to a decrease in cell mobility as EON in neurog1 mutants displayed increase displacement over time compare to controls (Figure S1C,D); little or no difference was detected in the displacement of skin cells between control and
neurog1hi1059 mutant embryos (Figure S1C,E). Taken together, our results indicate that
Neurog1 is required for an early phase of morphogenesis of the olfactory placode.
The chemokine receptor Cxcr4b and its ligand Cxcl12a (also known as Sdf1a) have been implicated in olfactory placode morphogenesis in the zebrafish (Miyasaka et al., 2007). To address whether the behavior of EON in neurog1hi1059 mutants resembles that caused when the activity of this guidance receptor/ligand pair is abrogated, we analyzed the morphogenetic parameters of EON migration in cxcr4bt26035 and
cxcl12at30516 mutants (Knaut et al., 2003; Valentin et al., 2007). As previously reported, olfactory placodes of embryos lacking Cxcr4b or Cxcl12a function display convergence defects, highlighted by an increase in the AP length of the cup relative to controls (Figure S4A; (Miyasaka et al., 2007)). Analysis of the behavior of individual cells in
cxcr4bt26035 and cxcl12at30516 mutant embryos indicates that defects in EON migration are largely restricted to the anterior cohort of EON (Figure 2A,B and Figure S5A,B); EON show increased displacement over time in both cxcr4bt26035 and cxcl12at30516 mutants (Figure S4B,C) and no difference is apparent in the behavior of skin cells in either mutant relative to wild-type siblings (Figure S4B,D and S6). A combined PCA of morphometric datasets from anterior EON of neurog1hi1059, cxcr4bt26035 and cxcl12at30516
along the AP axis (PC1; Figure 2C). Finally, unbiased clustering of the PCA analysis reveals that there is more resemblance in the behavior of anterior EON between the three mutants than between any single mutant and controls (Figure 2D).
The similarity between the migration phenotype of EON in neurog1hi1059,
cxcr4bt26035 and cxcl12at30516 mutant embryos suggests that the proneural transcription
factor and the receptor/ligand couple act in the same pathway. To determine if the expression of either the receptor or its ligand are affected in the absence of Neurog1, we assessed their expression in neurog1hi1059 mutant embryos. We found that cxcr4b expression is dramatically reduced or absent in EON progenitors at 12 and 15 hpf in this context (Figure 3A); the expression of cxcr4b recovers in neurog1hi1059 mutant embryos from 18 hpf, a stage at which we have previously reported that the expression of a second bHLH proneural gene, neurod4, also becomes Neurog1-independent (Figure 3A; Madelaine et al., 2011). Contrary to cxcr4b, the expression of cxcl12a is unaffected in neurog1hi1059 mutant embryos at all stages analyzed (Figure 3B). Taken together, these results suggest that the EON migration phenotype in neurog1hi1059 mutant embryos results from the lack of Cxcr4b during the early phase of olfactory cup morphogenesis.
If the absence of early cxcr4b expression in the olfactory placodes of
neurog1hi1059 mutants underlies the morphogenesis defects, we hypothesized that
restoring cxcr4b expression should rescue these defects. To test this, we generated a transgenic line where expression of the chemokine receptor is controlled by a -8.4 kb fragment of genomic DNA responsible for neurog1 expression in EON,
Tg(-8.4neurog1:cxcr4b-mCherry), and introduced it into the neurog1hi1059 mutant
background (Blader et al., 2003; Madelaine et al., 2011). Analysis of the migratory behavior of anterior EON in neurog1hi1059 mutant embryos carrying the transgene indicates that they display oriented posterior migration similar to wild-type siblings carrying the transgene (Figure 3C,D). The similarity in the behavior of the anterior EON is also evident after PCA analysis (Figure 3E). Here, neurog1hi1059 mutant cells carrying the transgene cluster primarily with control cells rather than mutant cells lacking the transgene (Figure 3E,F). These data lead us to conclude that Cxcr4b is the predominant downstream effector of Neurog1 during the early phase of olfactory cup morphogenesis.
Finally, we asked whether cxcr4b is a direct transcriptional target of Neurog1 by searching for potential Neurog1-dependent cis-regulatory modules (CRM) at the cxcr4b locus. Proneural transcription factors bind CANNTG sequences known as E-boxes, which are often found in clusters (Bertrand et al., 2002). We identified 18 E-boxes clusters in the sequences from -100 to +100 kb of the cxcr4b initiation codon, but only 1 of these clusters contains more than one of the CAA/
GATG E-box sequence preferred by Neurog1 (Figure 4A and data not shown; (Madelaine and Blader, 2011)). Coherent with a role for this E-box cluster in the regulation of cxcr4b expression, a transgenic line generated using a 35kb fosmid clone that contains this cluster, TgFOS(cxcr4b:eGFP), shows robust expression of GFP in the olfactory cup (Figure 4A,D). To investigate whether this cluster act as a bona fide Neurog1-dependent CRM, we performed chromatin immunoprecipitation (ChIP) experiments. In the absence of a ChIP compatible antibody against endogenous zebrafish Neurog1, we chose a strategy based on mis-expression of a Ty1-tagged form of Neurog1. Mis-expression of Neurog1-Ty1 efficiently induces the expression of deltaA, a known Neurog1 target, and cxcr4b suggesting that tagging Neurog1 does not affect its transcriptional activity and that
cxcr4b behaves as a Neurog1 target (Figure 4B). We have previously shown that the deltaA locus contains two proneural regulated CRMs (Madelaine and Blader, 2011);
whereas CRM HI is a Neurog1-dependent CRM, HII underlies regulation of deltaA by members of the Ascl1 family of bHLH proneural factors (Hans and Campos-Ortega, 2002; Madelaine and Blader, 2011). We found that ChIP against Neurog1-Ty1 after mis-expression effectively discriminates between the Neurog1-regulated HI and Ascl1-regulated HII CRM at the deltaA locus, thus providing a control for the specificity of our ChIP experiments (Figure 4C). Similarly, we were able to ChIP the potential CRM containing the E-box cluster 7 suggesting that this region is also a target for Neurog1 (Figure 4C).
To confirm the importance of the E-box cluster in the regulation of cxcr4b expression, we employed a Crispr/Cas9 approach to delete this CRM using a pair of sgRNAs flanking the CRM (Figure S7A). The sgRNA pair efficiently induces deletions in the targeted sequence, as judged by PCR on genomic DNA extracted from injected embryos (Figure S7B). Injection of the sgRNA pair into TgFOS(cxcr4b:eGFP)
transgenic embryos caused mosaic disruption of the eGFP expression pattern (Figure 4D). Loss of TgFOS(cxcr4b:eGFP) transgene expression is not due to cell death as eGFP-negative cells maintain the expression of the early neuronal marker HuC/D (insert in Figure 4D). Taken together, the results from our ChIP and Cripsr/Cas9 experiments strongly suggest that the CATATG E-box cluster upstream of cxcr4b is regulated directly by Neurog1.
In zebrafish, the proneural transcription factor Neurog1 directly regulates the expression of the neurogenic genes deltaA and deltaD (Hans and Campos-Ortega, 2002; Madelaine and Blader, 2011). We have shown that Neurog1 is required for the development of an early wave of neurons in the olfactory placode (Madelaine et al., 2011). The data presented here show that Neurog1 controls an early phase of morphogenesis of the zebrafish peripheral olfactory sensory organ via its target gene
cxcr4b. We propose that Neurog1 couples neurogenesis with morphogenesis in this
organ via the transcriptional regulation of distinct targets. That members of the Neurog family regulate Delta1 and Cxcr4 expression, as well as development the olfactory epithelium in mouse suggests that this role may be conserved (Beckers et al., 2000; Mattar et al., 2004; Shaker et al., 2012).
Acknowledgments
This work was supported by the Centre National de la Recherche Scientifique (CNRS); the Institut National de la Santé et de la Recherche Médicale (INSERM); Université de Toulouse III (UPS); Fondation pour la Recherche Médicale (FRM; DEQ20131029166); Fédération pour la Recherche sur le Cerveau (FRC); and the Ministère de la Recherche. We thank Kristen Kwan and Chi-Bin Chien for providing plasmids of the Tol2kit, Stéphanie Bosch and the Toulouse RIO Imaging platform, and Aurore Laire and Richard Brimicombe for taking care of the fish. We also thank Marie Breau, Magali Suzanne, Christian Mosimann and members of the Blader lab for advice on experiments and comments on the manuscript.
Materials and Methods Fish Husbandry and lines
Ethics Statement and Embryos: All embryos were handled according to relevant national and international guidelines. French veterinary service and national ethical committee approved the protocols used in this study, with approval ID: A-31-555-01 and APAPHIS #3653-2016011512005922v6.
Fish were maintained at the CBD-CBI zebrafish facility in accordance with the rules and protocols in place. The neurog1hi1059Tg, cxcr4bt26035 and cxcl12at30516 mutant lines have previously been described (Golling et al., 2002; Knaut et al., 2003; Valentin et al., 2007), as has the Tg(-8.4neurog1:gfp)sb1 (Blader et al., 2003). Embryos were obtained through natural crosses and staged according to (Kimmel et al., 1995).
Establishment of new transgenic lines
The TgFOS(cxcr4b:eGFP)fu10Tg transgenic line was generated using homologous
recombination by replacing the second exon of cxcr4b by LynGFP in the Fosmid CH1073-406F3, followed by zebrafish transgenesis (Revenu et al., 2014). The first 5 amino acid encoded by the first exon of cxcr4b are fused to LynGFP, preventing targeting to the membrane. The GFP localizes to the cytoplasm in this transgenic line.
The Tg(-8.4neurog1:cxcr4b-mCherry) transgene was generated by first cloning the coding region of cxcr4b minus its endogenous stop codon in frame upstream of mCherry in pCS2. The resulting cxcr4b-mCherry fusion coding sequence was transferred into the middle entry clone, pME, of the Tol2kit developed in the Chien lab (Kwan et al., 2007). The final transgene vector was generated using LR recombination with a previously described p5'-8.4neurog1 (Madelaine et al., 2011), the
pME-cxcr4b-mCherry, and the p3E-polyA and pDestTol2pA/pDestTol2pA2 from the Tol2kit (Kwan et
al., 2007). The new line was then generated by co-injecting the transgene with mRNA encoding Tol2 transposase into freshly fertilized zebrafish embryos.
In situ Hybridization, Immunostaining and Microscopy
In situ hybridization was performed as previously described (Oxtoby and Jowett, 1993). Antisense DIG-labeled probes for cxcr4b and cxcl12a (David et al., 2002) were
generated using standard procedures. In situ hybridizations were visualized using BCIP and NBT (Roche) as substrates.
Embryos were immunostained as previously described (Madelaine et al., 2011); primary antibody used was mouse anti-HuC/D (1:500; 16A11, Molecular Probes, USA), which was detected using Alexa Fluor 555 conjugated goat anti-mouse IgG diluted 1/1000: (A-28180, Molecular Probes, USA). Immunolabelings were counterstained with Topro3 (T3605, Molecular Probes, USA). Labeled embryos were imaged using an upright SP8 Leica confocal and analyzed using ImageJ and Imaris 8.3 (Bitplane, Switzerland) software.
Cell tracking in time-lapse confocal datasets
Embryos carrying the Tg(-8.4neurog1:gfp) transgene (Blader et al., 2003) were injected with synthetic mRNA encoding an H2B-RFP fusion protein; for analysis of the global behavior of olfactory placode morphogenesis, un-injected embryos were used. Embryos were then grown to 12 hpf at which point they were dechorionated and embedded for imaging in 0.7% low-melting point agarose in embryos medium. A time-lapse series of confocal stacks (1 mm slice/180 mm deep) was generated of the anterior neural plate and flanking non-neural ectoderm on an upright Leica SP8 Confocal microscope using a 25x HC Fluotar water-immersion objective. Acquisitions each 7 min were stopped at 27 hpf, when the olfactory rosette was clearly visible. The lineage of anterior, midline and posterior early olfactory neuron cohorts were subsequently constructed semi-automatically following H2B-RFP of neurog1:GFP+ EON using Imaris 8.3 analysis software (Bitplane, Switzerland); for each of three embryos, two anterior, middle and posterior cells from the left and right olfactory placode were tracked.
Track analysis
Track parameters were extracted from Imaris as Excel files and analyzed using a custom script generated in R (The R Project for Statistical Computing, www.r-project.org). First, tracks were rendered symmetric across the left-right axis for ease of interpretation. Tracks were then color coded according to their genotype and to the phase of migration (early from 12-18 hpf; late from 18-27 hpf) and plotted. Finally, the
mean for each set of tracks was generated using the “RowMeans” function and a plot was generated.
Principal component analysis (PCA) and clustering were performed using the built-in R function “prcomp” from the “FactoMineR” package and the “kmeans” function, from the “stats” package, respectively. Finally, the “barplot” function (“graphics” package) was used to represent either the EON cluster composition or the Skin cluster composition.
Chromatin Immunoprecipitation and qPCR
ChIP experiments were performed as previously described using approximately 300 embryos (12 to 15 hpf) per immunoprecipitation (Wardle et al., 2006). Two to four separate ChIP experiments were carried out with corresponding independent batches of either control un-injected embryos or embryos injected with a synthetic mRNA encoding Neurog1-Ty1; ChIP-grade mouse anti-Ty1 (BB2; Sigma-Aldrich, USA) was used. Primers used for qPCR on ChIPs were:
cxcr4b CATATG cluster fw 5’- CTACATCTAAAAATTGAAAGA-3’ cxcr4b CATATG cluster rev 5’- CAAACCCAACACCCCTACTG-3’ deltaA HI fw 5’- GCGGAATGAACCACCAACTT-3’
deltaA HI rev 5’- GTGTGACTAAAGGTGTATGGGTG-3’ deltaA HII fw 5’- TATTGTGTGCAGGCGGAATA-3’ deltaA HII rev 5’-GTTTGAATGGGCTCCTGAGA-3’.
Reactions were carried out in triplicates on a MyIQ device (Bio-Rad). The specific signals were calculated as the ratio between the signals with the Ty1 antibody and beads alone, and were expressed as percentage of chromatin input.
For qPCR experiments, to determine expression levels of cxcr4b and deltaA after mis-expression of Neurog1-Ty1, total RNAs were extracted from 20 injected embryos at 15 hpf with the RNeasy Mini Kit (QIAGEN), and reverse-transcribed with the PrimeScript RT reagent kit (Ozyme) according to the supplier’s instructions. Q-PCR analyzes were performed on MyIQ device (Bio-Rad) with the SsoFast EvaGreen Supermix (Bio-Rad), according to the manufacturer’s instructions. All experiments include a standard curve. Samples from embryos were normalized to the number of
ef1a mRNA copies. Primers for qPCR to determine the expression levels of cxcr4b and deltaA after mis-expression of Neurog1-Ty1 normalized to the expression of ef1a were: cxcr4b coding fw 5’- GCTGGCATATTTCCACTGCT-3’
cxcr4b coding rev 5’- AGTGCACTGGACGACTCTGA-3’ deltaA coding fw 5’- CGGGTTTACAGGCATGAACT-3’ deltaA coding rev 5’- ATTGTTCCTTTCGTGGCAAG-3’ ef1a fw 5’-GCATACATCAAGAAGATCGGC-3’
ef1a rev 5’-GCAGCCTTCTGTGCAGACTTTG-3’.
Crispr/Cas9 deletion of potential CRM at the cxcr4b locus
sgRNA sequences flanking the E-box cluster 7 at the cxcr4b locus were designed using the web-based CRIPSRscan algorithm (Moreno-Mateos et al., 2015; http://www.crisprscan.org). The targeted sequences are 5'-GGCTTATGATGGAGGCGACTGG-3' and 5'-GGCTTGTATTGCCCTTGAGGG-3'; the PAM sequence at the target site are underlined. Templates for the transcription of sgRNAs were generated by PCR following previously described protocols (Nakayama et al., 2014). Injection of sgRNAs was performed as described by Burger and colleagues, using a commercially available Cas9 protein (New England Biolabs). The efficiency of creating deletion after co-injection of the sgRNA pair was determined by PCR on genomic DNA extracted from injected embryos using the following primers: 5'-AACTCGCATTCGGCAAACTCTC-3'
5'-AAGGGGATAATGAGCAGTCAGC-3'.
While a 500 base-pair PCR fragment is generated from a wild-type locus, an approximately 200 base-pair fragment is amplified if a deletion has been induced.
Figures
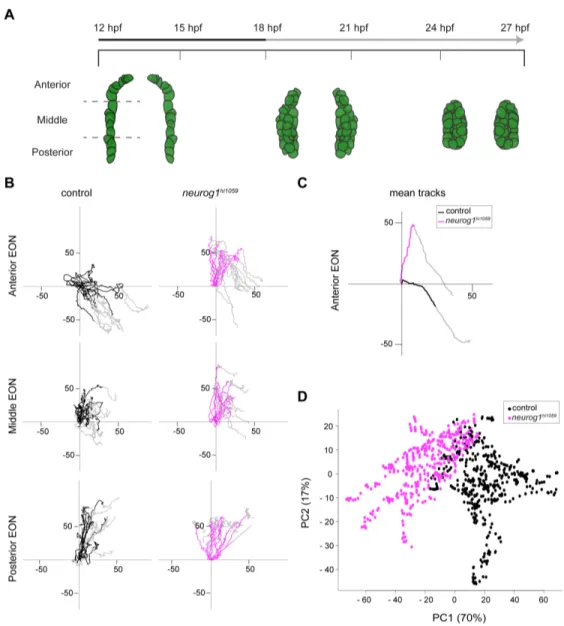
Figure 1. Oriented cell movements are affected in neurog1hi1059 mutant embryos during olfactory placode formation.
(A) Graphic representation of the morphogenesis of olfactory placodes from 12 hpf to 27 hpf showing a dorsal view of the three olfactory stages: olfactory territory (12 hpf), olfactory placode (18 hpf) and olfactory epithelium (24 hpf). Placode EON progenitors are represented in green as visualized with the
Tg(-8.4neurog1:gfp) transgene. At 12 hpf, the -8.4neurog1:GFP+ placodal domain can be divided in
anterior, middle and posterior regions. The early (12-18 hpf; Black) and late (18-27 hpf; Grey) phases of morphogenesis are noted in the time line. (B) Tracks showing migration of EON of control (Black) or
placodes from 3 embryos) for each of the anterior, middle and posterior domains of the developing placode indicated in (A). The origin of the tracks has been arbitrarily set to the intersection of the X/Y axis and the early (colored) and late (Grey) phases of migration have been highlighted. (C) Mean tracks for anterior EON of control (Black) or neurog1hi1059 mutant (Magenta) embryos. (D) Pairwise principal component analysis scatterplots of morphogenetic parameters extracted from the datasets corresponding to the tracks in (C). The major difference between control and neurog1hi1059 mutant embryos (PC1) corresponds to the antero-posterior axis.
Figure 2. Morphogenetic defects in cxcr4bt26035 and cxcl12at30516 mutant embryos resemble those of neurog1hi1059.
(A) Tracks showing migration of anterior EON from control (Black), cxcr4bt26035 (Blue) and cxcl12at30516 (Green) embryos. 12 anterior tracks are represented (2 cells each from the left and right placodes from 3 embryos). The origin of the tracks has been arbitrarily set to the intersection of the X/Y axis and the early (colored) and late (Grey) phases of migration have been highlighted. (B) Mean tracks showing migration of anterior EON of control (Black), neurog1hi1059 (Magenta), cxcr4bt26035 (Blue) and cxcl12at30516 (Green) mutant embryos. (C) Pairwise principal component analysis scatterplots of morphogenetic parameters extracted from the datasets corresponding the tracks in (B). The major difference between control,
neurog1hi1059, cxcr4bt26035 and cxcl12at30516 mutant embryos (PC1) corresponds to the antero-posterior axis. (D) Clustering analysis of morphogenetic parameters extracted from the datasets corresponding the tracks in (B) and analyzed in (C). One cluster, k1, contains almost exclusively control tracks (Black),
whereas tracks from neurog1hi1059 (Magenta), cxcr4bt26035 (Blue) and cxcl12at30516 (Green) mutant embryos clustered together in k2, k3 and k4.
Figure 3. Cxcr4b is the predominant downstream effector of Neurog1 during olfactory placode morphogenesis.
(A) cxcr4b whole mount in situ hybridization at 12, 15 and 18 hpf in control and neurog1hi1059 mutant embryos. cxcr4b expression is dramatically reduced or absent in EON progenitors at 12 and 15 hpf in
neurog1hi1059 mutant embryos (white arrowheads) but from 18 hpf the expression of cxcr4b recovers. (B)
cxcl12a whole mount in situ hybridization at 12, 15 and 18 hpf in control and neurog1hi1059 mutant embryos, in which cxcl12a expression is not affected. (C) Tracks showing migration of anterior EONs of control (Black) embryos, neurog1hi1059 mutant embryos (Magenta), neurog1hi105 mutant embryos carrying the Tg(-8.4neurog1:cxcr4b) transgene (Cyan) and control embryos carrying Tg(-8.4neurog1:cxcr4b)
(Light Blue). 12 anterior tracks are represented (from 4 embryos). The origin of the tracks has been arbitrarily set to the intersection of the X/Y axis and the early (colored) and late (Grey) phases of migration have been highlighted. (D) Mean tracks showing migration of anterior EON of the tracks in (C). (E) Pairwise principal component analysis scatterplots of morphogenetic parameters extracted from the datasets corresponding the tracks in (D). The major difference between control, neurog1hi1059, and control or neurog1hi1059 with the rescue transgene (PC1) corresponds to the antero-posterior axis. (F) Clustering analysis of morphogenetic parameters extracted from the datasets corresponding the tracks in (D) and analyzed in (E). One cluster, k2, contains only neurog1hi1059 tracks (Magenta), whereas tracks from control (Black), rescue (Cyan) and control/rescue (Light Blue) embryos clustered together in k1, k3 and k4.
Figure 4. Neurog1 directly controls cxcr4b expression via an upstream Cis-regulatory module (CRM).
(A) Schematic representation of the cxcr4b locus indicating the position of exons of the cxcr4b gene (orange) and E-box clusters, which are color-coded depending on the nature of the E-box sequences. Also presented is the approximate position of the genomic sequences found in the TgFOS(cxcr4b:eGFP) transgene. (B) qPCR analysis of the effect of Neurog1-Ty1mRNA mis-expression on the relative mRNA levels of the known Neurog1 target gene deltaA and cxcr4b. A significant increase in expression is detected for both genes. Shown are mean ± s.e.m, p values are calculated using a two-tailed Student's
t-test, *p=0.01, ***p=0.0001. (C) Chromatin immunoprecipitation (ChIP) using an antibody against Ty1 and chromatin prepared from 15 hpf embryos mis-expressing Neurog1-Ty1 mRNA (Grey). Control (Black) represents ChIP with IgG alone. Shown are mean ± s.e.m, p values are calculated using a two-tailed Student's t-test, n.s. not significant, *p=0.01. (D) Single confocal sections of TgFOS(cxcr4b:eGFP) embryos at 24 hpf showing eGFP expression in the olfactory placodes, and either HuC/D expression or nuclear labeling (TOPRO). Embryos were injected with an sgRNA pair flanking the E-box containing CRM at the cxcr4b locus plus or minus Cas9 as a control. Insets show HuC/D expression in both conditions.
Supplemental Figures
Figure S1. neurog1 mutant embryos display specific defects in olfactory placode development.
(A) Schematic representation of the relative antero-posterior length calculation. Lengths are normalized relative to the 12 hpf antero-posterior length. (B) Graph showing normalized antero-posterior length of the developing olfactory placode in control (Black) and neurog1hi1059 mutant embryos (Magenta) over time. The mean ± s.e.m of 12 tracks are represented per condition; 2 cells each from the left and right placodes from 3 embryos for each of the anterior, middle and posterior domains of the developing placode. (C) Histogram showing the global displacement of EON (empty) and skin cells (checkered) of control (Black) and neurog1hi1059 mutant embryos (Magenta) during olfactory placode development. The mean ± s.e.m of 12 tracks are represented per condition. (D) Graph showing the global displacement along antero-posterior axis of control (Black) or neurog1hi1059 mutant (Magenta) EON during five indicated time periods. The mean ± s.e.m of 36 tracks are represented (12 tracks per embryo and 3 embryos per genotype) per condition. (E) Graph showing the global displacement along antero-posterior axis of control (Black) or
neurog1hi1059 mutant (Magenta) skin cells during five indicated time periods. The mean ± s.e.m of 36 tracks are represented (12 tracks per embryo and 3 embryos per genotype) per condition.
Figure S2. Anterior EON population tracks are specifically affected in neurog1 mutated embryos.
(A) Mean tracks for anterior, middle and posterior EON set of control (Black) or neurog1hi1059 mutant (Magenta) embryos. 12 tracks are represented (2 cells each from the left and right placodes from 3 embryos) for each region. The origin of the tracks has been arbitrarily set to the intersection of the X/Y axis and the early (colored) and late (Grey) phases of migration have been highlighted. (B) Pairwise
principal component analysis scatterplots of morphogenetic parameters extracted from the datasets corresponding to the tracks in (A).
Figure S3. Morphogenetic movements of skin cells in neurog1hi1059 mutant embryos.
Tracks showing migration of skin cells in control (Black) or neurog1hi1059 mutant (Magenta) embryos. 12 tracks are represented for cells overlying the anterior, middle and posterior domains of the developing placode. The origin of the tracks has been arbitrarily set to the intersection of the X/Y axis and the early (coloured) and late (Grey) phases of migration have been highlighted. Morphogenetic movements of individual skin cells showed no obvious differences in control versus neurog1 mutants.
Figure S4. Morphogenetic movements of EON are globally affected in cxcr4bt26035 and
cxcl12at30516 mutant embryos.
(A) Graph showing normalized antero-posterior length of the developing olfactory placode in control (Black) and cxcr4bt26035 (Green) and cxcl12at30516 (Blue) mutants over time. The mean ± s.e.m of 12 tracks are represented per condition; 2 cells each from the left and right placodes from 3 embryos for each of the anterior, middle and posterior domains of the developing placode. (B) Histogram showing the global displacement of EON (empty) and skin cells (checkered) for control (Black), neurog1hi1059 (Magenta) cxcr4bt26035 (Green) and cxcl12at30516 (Blue) mutants during olfactory placode development. The mean ± s.e.m of 12 tracks are represented per condition. (C) Graph showing the global displacement along antero-posterior axis of control (Black), neurog1hi1059 (Magenta) cxcr4bt26035 (Green) and
cxcl12at30516 (Blue) EON during five indicated time periods. The mean ± s.e.m of 36 tracks are represented (12 tracks per embryo and 3 embryos per genotype) per condition. (D) Graph showing the
global displacement along antero-posterior axis of control (Black), neurog1hi1059 (Magenta) cxcr4bt26035 (Green) and cxcl12at30516 (Blue) skin cells during five indicated time periods. The mean ± s.e.m of 36 tracks are represented (12 tracks per embryo and 3 embryos per genotype) per condition.
Figure S5. Morphogenetic parameters in cxcr4bt26035 and cxcl12at30516 mutant embryos.
(A) Tracks showing migration of EON of control (Black), cxcr4bt26035 (Green) and cxcl12at30516 (Blue) embryos. 12 tracks are represented (2 cells each from the left and right placodes from 3 embryos) for each of the anterior, middle and posterior domains of the developing placode. The origin of the tracks has been arbitrarily set to the intersection of the X/Y axis and the early (colored) and late (Grey) phases of migration have been highlighted. (B) Mean tracks for anterior EON of control (Black), cxcr4bt26035 (Green) and cxcl12at30516 (Blue) embryos.
Figure S6. Morphogenetic movements of skin cells in cxcr4bt26035 and cxcl12at30516 embryos.
Tracks showing migration of skin cells of control (Black), cxcr4bt26035 (Green) and cxcl12at30516 (Blue) embryos. 12 tracks are represented for cells overlying the anterior, middle and posterior domains of the developing placode. The origin of the tracks has been arbitrarily set to the intersection of the X/Y axis and the early (colored) and late (Grey) phases of migration have been highlighted. Morphogenetic movements of individual skin cells showed no obvious differences in control versus neurog1 mutants.
Figure S7. Crispr-Cas9 deletion of the Neurog1-regulated CRM upstream of the cxcr4b locus.
(A) Schematic representation of the cxcr4b locus indicating the position of exons of the cxcr4b gene (orange) and E-box clusters, which are color-coded depending on the nature of the E-box sequences, the approximate position of the genomic sequences found in the TgFOS(cxcr4b:eGFP) transgene. Also presented is a schematic representation of the PCR fragment used to genotype potential deletions with the sequence of the E-box cluster. (B) Ethidium bromide stained agarose gel showing the results of PCR genotyping for the induction of deletions of the E-box cluster. The magenta arrowhead shows the 500bp control band. A 200 bps band appears (black arrowhead) when the sgRNA pair is injected with Cas9 but not when the sgRNA pair or Cas9 is injected alone.
References
Beckers, J., Caron, A., Hrabe de Angelis, M., Hans, S., Campos-Ortega, J. A. and Gossler, A. (2000)
Distinct regulatory elements direct delta1 expression in the nervous system and paraxial mesoderm of transgenic mice, Mech Dev 95(1-2): 23-34.
Bertrand, N., Castro, D. S. and Guillemot, F. (2002) Proneural genes and the specification of neural cell
types, Nat Rev Neurosci 3(7): 517-30.
Blader, P., Fischer, N., Gradwohl, G., Guillemot, F. and Strahle, U. (1997) The activity of neurogenin1
is controlled by local cues in the zebrafish embryo, Development 124(22): 4557-69.
Blader, P., Plessy, C. and Strahle, U. (2003) Multiple regulatory elements with spatially and temporally
distinct activities control neurogenin1 expression in primary neurons of the zebrafish embryo, Mech Dev 120(2): 211-8.
Breau, M. A., Bonnet, I., Stoufflet, J., Xie, J., De Castro, S. and Schneider-Maunoury, S. (2017)
Extrinsic mechanical forces mediate retrograde axon extension in a developing neuronal circuit, Nat
Commun 8(1): 282.
Burger, A., Lindsay, H., Felker, A., Hess, C., Anders, C., Chiavacci, E., Zaugg, J., Weber, L. M., Catena, R., Jinek, M. et al. (2016) Maximizing mutagenesis with solubilized CRISPR-Cas9
ribonucleoprotein complexes, Development 143(11): 2025-37.
David, N. B., Sapede, D., Saint-Etienne, L., Thisse, C., Thisse, B., Dambly-Chaudiere, C., Rosa, F. M. and Ghysen, A. (2002) Molecular basis of cell migration in the fish lateral line: role of the chemokine
Golling, G., Amsterdam, A., Sun, Z., Antonelli, M., Maldonado, E., Chen, W., Burgess, S., Haldi, M., Artzt, K., Farrington, S. et al. (2002) Insertional mutagenesis in zebrafish rapidly identifies genes
essential for early vertebrate development, Nat Genet 31(2): 135-40.
Hans, S. and Campos-Ortega, J. A. (2002) On the organisation of the regulatory region of the zebrafish
deltaD gene, Development 129(20): 4773-84.
Kimmel, C. B., Ballard, W. W., Kimmel, S. R., Ullmann, B. and Schilling, T. F. (1995) Stages of
embryonic development of the zebrafish, Dev Dyn 203(3): 253-310.
Knaut, H., Werz, C., Geisler, R., Nusslein-Volhard, C. and Tubingen Screen, C. (2003) A zebrafish
homologue of the chemokine receptor Cxcr4 is a germ-cell guidance receptor, Nature 421(6920): 279-82.
Kwan, K. M., Fujimoto, E., Grabher, C., Mangum, B. D., Hardy, M. E., Campbell, D. S., Parant, J. M., Yost, H. J., Kanki, J. P. and Chien, C. B. (2007) The Tol2kit: a multisite gateway-based construction kit
for Tol2 transposon transgenesis constructs, Dev Dyn 236(11): 3088-99.
Madelaine, R. and Blader, P. (2011) A cluster of non-redundant Ngn1 binding sites is required for
regulation of deltaA expression in zebrafish, Dev Biol 350(1): 198-207.
Madelaine, R., Garric, L. and Blader, P. (2011) Partially redundant proneural function reveals the
importance of timing during zebrafish olfactory neurogenesis, Development 138(21): 4753-62.
Mattar, P., Britz, O., Johannes, C., Nieto, M., Ma, L., Rebeyka, A., Klenin, N., Polleux, F., Guillemot, F. and Schuurmans, C. (2004) A screen for downstream effectors of Neurogenin2 in the embryonic
neocortex, Dev Biol 273(2): 373-89.
Miyasaka, N., Knaut, H. and Yoshihara, Y. (2007) Cxcl12/Cxcr4 chemokine signaling is required for
placode assembly and sensory axon pathfinding in the zebrafish olfactory system, Development 134(13): 2459-68.
Moreno-Mateos, M. A., Vejnar, C. E., Beaudoin, J. D., Fernandez, J. P., Mis, E. K., Khokha, M. K. and Giraldez, A. J. (2015) CRISPRscan: designing highly efficient sgRNAs for CRISPR-Cas9 targeting in
vivo, Nat Methods 12(10): 982-8.
Nakayama, T., Blitz, I. L., Fish, M. B., Odeleye, A. O., Manohar, S., Cho, K. W. and Grainger, R. M.
(2014) Cas9-based genome editing in Xenopus tropicalis, Methods Enzymol 546: 355-75.
Oxtoby, E. and Jowett, T. (1993) Cloning of the zebrafish krox-20 gene (krx-20) and its expression
during hindbrain development, Nucleic Acids Res 21(5): 1087-95.
Revenu, C., Streichan, S., Dona, E., Lecaudey, V., Hufnagel, L. and Gilmour, D. (2014) Quantitative
cell polarity imaging defines leader-to-follower transitions during collective migration and the key role of microtubule-dependent adherens junction formation, Development 141(6): 1282-91.
Shaker, T., Dennis, D., Kurrasch, D. M. and Schuurmans, C. (2012) Neurog1 and Neurog2
coordinately regulate development of the olfactory system, Neural Dev 7: 28.
Valentin, G., Haas, P. and Gilmour, D. (2007) The chemokine SDF1a coordinates tissue migration
through the spatially restricted activation of Cxcr7 and Cxcr4b, Curr Biol 17(12): 1026-31.
Wardle, F. C., Odom, D. T., Bell, G. W., Yuan, B., Danford, T. W., Wiellette, E. L., Herbolsheimer, E., Sive, H. L., Young, R. A. and Smith, J. C. (2006) Zebrafish promoter microarrays identify actively
transcribed embryonic genes, Genome Biol 7(8): R71.
Whitlock, K. E. and Westerfield, M. (2000) The olfactory placodes of the zebrafish form by convergence
of cellular fields at the edge of the neural plate, Development 127(17): 3645-53.


![[PDF] Introduction àla méthode d'analyse et conception Merise PDF - Cours Merise](data:image/gif;base64,R0lGODlhAQABAIAAAP///wAAACH5BAEAAAAALAAAAAABAAEAAAICRAEAOw==)