HAL Id: hal-00296347
https://hal.archives-ouvertes.fr/hal-00296347
Submitted on 4 Oct 2007
HAL is a multi-disciplinary open access
archive for the deposit and dissemination of
sci-entific research documents, whether they are
pub-lished or not. The documents may come from
teaching and research institutions in France or
abroad, or from public or private research centers.
L’archive ouverte pluridisciplinaire HAL, est
destinée au dépôt et à la diffusion de documents
scientifiques de niveau recherche, publiés ou non,
émanant des établissements d’enseignement et de
recherche français ou étrangers, des laboratoires
publics ou privés.
cloud from Soufrière Hills volcano, Montserrat
A. J. Prata, S. A. Carn, A. Stohl, J. Kerkmann
To cite this version:
A. J. Prata, S. A. Carn, A. Stohl, J. Kerkmann. Long range transport and fate of a stratospheric
vol-canic cloud from Soufrière Hills volcano, Montserrat. Atmospheric Chemistry and Physics, European
Geosciences Union, 2007, 7 (19), pp.5093-5103. �hal-00296347�
www.atmos-chem-phys.net/7/5093/2007/ © Author(s) 2007. This work is licensed under a Creative Commons License.
Chemistry
and Physics
Long range transport and fate of a stratospheric volcanic cloud
from Soufri`ere Hills volcano, Montserrat
A. J. Prata1, S. A. Carn2, A. Stohl1, and J. Kerkmann3
1Norwegian Institute for Air Research (NILU), P.O. Box 100, 2027 Kjeller, Norway
2Joint Center for Earth Systems Technology (JCET), University of Maryland Baltimore County, Baltimore, MD 21250, USA
3European Organisation for the Exploitation of Meteorological Satellites (EUMETSAT), Am Kavalleriesand 31, 64295
Darmstadt, Germany
Received: 31 January 2007 – Published in Atmos. Chem. Phys. Discuss.: 3 April 2007 Revised: 16 July 2007 – Accepted: 24 September 2007 – Published: 4 October 2007
Abstract. Volcanic eruptions emit gases, ash particles and hydrometeors into the atmosphere, occasionally reaching heights of 20 km or more, to reside in the stratospheric over-world where they affect the radiative balance of the atmo-sphere and the Earth’s climate. Here we use satellite mea-surements and a Lagrangian particle dispersion model to de-termine the mass loadings, vertical penetration, horizontal extent, dispersion and transport of volcanic gases and par-ticles in the stratosphere from the volcanic cloud emitted during the 20 May 2006 eruption of Soufri`ere Hills vol-cano, Montserrat, West Indies. Infrared, ultraviolet and mi-crowave radiation measurements from two polar orbiters are used to quantify the gases and particles, and track the move-ment of the cloud for 23 days, over a distance of ∼18 000 km. Approximately, 0.1±0.01 Tg(S) was injected into the
stratosphere in the form of SO2: the largest single sulphur
input to the stratosphere in 2006. Microwave Limb Sounder measurements indicate an enhanced mass of HCl of ∼0.003– 0.01 Tg. Geosynchronous satellite data reveal the rapid na-ture of the stratospheric injection and indicate that the erup-tion cloud contained ∼2 Tg of ice, with very little ash reach-ing the stratosphere. These new satellite measurements of volcanic gases and particles can be used to test the sensitiv-ity of climate to volcanic forcing and assess the impact of stratospheric sulphates on climate cooling.
1 Introduction
The current low sulphate content of the stratosphere is largely due to the recent absence of significant stratospheric
in-jections of volcanic SO2. The last major injections
oc-curred during the eruptions of El Chich´on, March/April 1982 (∼4 Tg S), the eruptions of Pinatubo from June 12– 15, 1991 (∼10 Tg S), followed soon after by the eruption of
Correspondence to: A. J. Prata
(fred.prata@nilu.no)
Cerro Hudson, in August 1991 (∼2 Tg S). Trend estimates using mostly longterm balloon measurements (Deshler et al., 2006), suggest that there is no detectable change in the background stratospheric aerosol. Recently it has been sug-gested that injecting sulphur into the stratosphere could be employed as a strategy to reduce global warming due to
in-creasing CO2 levels (Crutzen, 2006; Wigley, 2006). Such
potentially dangerous tampering with the climate system re-quires very careful consideration, involving modelling the effects on the climate system. Volcanic eruptions that in-ject S into the stratosphere provide a natural analogue for assessing the impact on the climate system (Robock, 2004; Wigley, 2006). While there is a crucial difference to the
cli-mate response from low-level episodic SO2injections,
high-level (stratospheric) injections and continuous injections of the kind suggested in the geo-engineering approach, all
re-quire accurate observations of the SO2 loading in order to
model the climate’s response. Accurate measurements of the amount, transport and chemical fate of stratospheric
vol-canogenic SO2 are therefore of some value, and satellite
measurements are well suited to this task.
Stratospheric sulphate causes surface cooling and strato-spheric warming (Robock, 2000). Crutzen (2006) estimates that the average annual injection required to effect a cooling
of 1.4 Wm−2 is about 1–2 Tg(S) per year, but this assumes
average stratospheric sulphur loading from volcanoes. On average, volcanoes are believed to inject 0.5–1.5 Tg(S) per year into the stratosphere (Halmer et al., 2002); with a large portion of this due to fewer than 2–3 events each year, but this is highly variable. At the present time, the annual injec-tion of S into the stratosphere from volcanoes is very poorly known. Measurements of total S injected into the atmosphere from volcanoes are based on low accuracy, largely intermit-tent and incomplete ground-based correlation spectrometer (COSPEC) and differential optical absorption spectroscopy measurements (McGonigle et al., 2002), while since 1979 the NASA Total Ozone Mapping Spectrometer – TOMS has
provided (also with limited accuracy) global estimates of
vol-canic SO2 emissions to the upper troposphere and
strato-sphere (Krueger et al., 1995), leading to a best estimate of 7.5–10.5 Tg(S) per year for volcanic sulphur (Halmer et al., 2002).
Our knowledge of the stratospheric sulphate content has been greatly improved through the use of satellite-borne in-struments capable of providing global data on a continuous basis (e.g. TOMS), and these have been used to determine
volcanic SO2burdens (Bluth et al., 1993). While there is no
single satellite instrument dedicated to this task, several in-struments with alternate primary objectives can be exploited
to determine SO2concentrations. The main objective of this
paper is to report satellite observations of stratospheric
load-ings of SO2due to the May 2006 eruption of Soufri`ere Hills
volcano. We are also able to derive loadings of ice and HCl in the stratospheric cloud from rapid-scan geosynchronous infrared satellite measurements and from passive microwave satellite measurements, respectively. In the following sec-tions we describe the satellite data used, provide some back-ground on the Soufri`ere Hills volcanic eruption, describe the
methodologies used to derive SO2from the satellite
measure-ments, and discuss the transport of the SO2cloud and
com-pare this to results from a particle dispersion model. The
paper suggests ways to utilise SO2measurements in climate
models and stresses the need for more accurate global esti-mates of stratospheric S.
2 Satellite data
2.1 AIRS
The Atmospheric Infrared Sounder – AIRS on board the polar-orbiting EOS-Aqua platform is an echelle spectrom-eter designed to measure atmospheric profiles of tempera-ture, moisture and trace gases for climate and weather pre-diction applications. AIRS covers the infrared spectrum from
∼3.3 µm to ∼16.7 µm which includes SO2 absorption
fea-tures at 4, 7.3, and 8.6 µm. Carn et al. (2005) and Prata and Bernardo (2007) have shown that AIRS measurements can
be used to derive SO2column abundances. The data are
pro-vided via anonymous FTP from the data processing centre at NASA Goddard. Level 1b v4.0.0 calibrated and georefer-enced radiances on an image grid comprising 2378 channels by 90 pixels by 135 lines are used. The radiometric accuracy is better than 0.5 K, but this does vary with channel. Further information about the AIRS instrument and data processing methods can be found at http://airs.jpl.nasa.gov.
2.2 MSG-SEVIRI
The Meteosat Second Generation (MSG), Spin Enhanced Visible and InfraRed Imager (SEVIRI) provides data at
15 min intervals in 8 discrete spectral bands over a 70◦field
of view centred at the Greenwich Meridian and the equa-tor. This sensor is specifically designed to provide data for the European weather services and is an operational satellite. SEVIRI has channels at 4, 7.3 and 8.6 µm which, like AIRS,
cover SO2absorption features, albeit at much reduced
spec-tral resolution. The rapid scan nature of SEVIRI, coupled with multispectral infrared measurements permit estimates
of both SO2and ice mass loadings and allow us to follow the
development of the stratospheric injection over the first 36 h or so after the eruption.
2.3 MLS
The Microwave Limb Sounder – MLS measures microwave emission from the atmospheric limb to determine concen-tration profiles and total columns of a variety of chemical
species including HCl and SO2 (Waters et al., 2006). At
the present time only HCl profiles were available and we make use of version 1.52 level 2 geolocated geophysical pa-rameter data from the NASA Goddard Space Flight Center Earth Sciences (GES) Data and Information Services Center (DISC). Further details of the data can be found in docu-ments available from the GES-DISC website (http://mls.jpl. nasa.gov/data/overview.php).
2.4 OMI and CALIOP
Details of the SO2 ultra-violet measurements from the
Ozone Monitoring Instrument (OMI) and backscatter from the Cloud-Aerosol Lidar and Infrared Pathfinder Satellite Observations (CALIPSO) utilising the Cloud-Aerosol Lidar with Orthogonal Polarization (CALIOP) for this volcanic gas cloud, with a focus on the volcanology are described by Carn et al. (2007). The focus here is on the use of infrared mea-surements and a dispersion model to study the gas and parti-cle constituents and subsequent stratospheric transport of the cloud. The combined use of these satellite instruments for studying the atmospheric chemistry of volcanic emissions is new, and allows much greater confidence in assessing the dy-namics and structure of volcanic gas clouds. The infrared
in-struments provide column SO2measurements and ice
load-ings, while the MLS retrieves HCl profiles.
3 Soufri`ere Hills eruption, 20 May 2006
Soufri`ere Hills volcano, on the island of Montserrat (16.7◦N,
62.2◦W, 915 m) has been in a state of eruption since 18
July 1995. On the morning of 20 May 2006 after several months of lava dome building, the eastern flank of the cano suffered a major collapse involving an estimated
vol-ume of 90×106m3 of lava, much of it entering the ocean.
During or immediately following this event, a highly buoy-ant eruption column of ash and gases rose to heights of at least 17 km, and as we will show, the gases penetrated the tropopause and entered the stratosphere reaching as high as
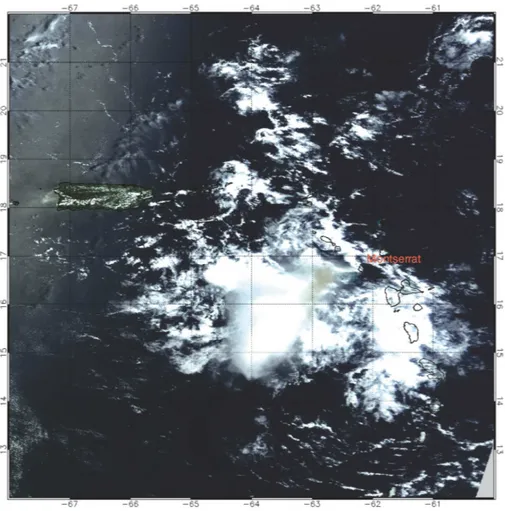
Fig. 1. MODIS-Terra image of the Soufri`ere Hills eruption cloud acquired at 15:15 UT on 20 May 2006. The colour enhancement was the
following: R=Band 1 (0.62–0.67 µm), G=Band 4 (0.54–0.57 µm), B=Band 3 (0.46–0.48 µm). In this enhancement (sometimes referred to as “true-colour”, since the channel assignments match the red, green and blue parts of the light spectrum) clouds appear white or grey, the ocean appears in shades of blue and the land in shades of green, yellow and brown. Particulates in the cloud, or gases that preferentially absorb more strongly in one band or another bring colour to that region of the image.
20 km. There was also a large quantity of ice in the erup-tion cloud. A MODIS-Terra image obtained about 6 h af-ter the eruption shows a large and high cloud moving west-wards away from the volcano on Montserrat (Fig. 1). There is a slight yellowish discoloration1on the eastern flank of the eruption cloud, which we assume is due to a higher propor-tion of volcanic ash there. The cloud also contained copious
amounts of SO2and some HCl.
1Experience with analysing MODIS images of volcanic ash
us-ing the “true-colour” enhancement (see caption to Fig. 1 for details) leads us to believe that the discoloration is due to particulate matter and that this is most likely volcanic ash.
4 Satellite measurements of the volcanic cloud con-stituents
4.1 Early evolution – SEVIRI measurements
The initial phase of the eruption was not captured well by the afternoon polar orbiting satellite instruments due to tim-ing with the eruption onset. However, sensors on board two geosynchronous satellites (GOES-W and MSG-SEVIRI) and the MODIS sensor on board the morning EOS-Terra satellite were able to image the eruption cloud within the first few hours of the eruption.
SO2column retrievals were carried out using the SEVIRI
channels centred at 6.7, 7.3 and 11 µm based on the method-ology described by Prata and Kerkmann (2007). The
SE-VIRI 7.3 µm channel covers a strong SO2absorption feature
and Prata et al. (2003) have shown that this spectral region
can be used to determine SO2columns, provided the SO2is
200 220 240 260 280 300 10.8 µm brightness temperature (K) 0 5 10 15 20 1 0 .8 -1 1 .9 µ m B T D (K ) reff=8 µm reff=15 µm reff=25 µm
BTD < 3 K not used in the analysis
0 5 10 15 20 25 30
Effective particle radius (µm) 0 500 1000 1500 2000 N u m b e r
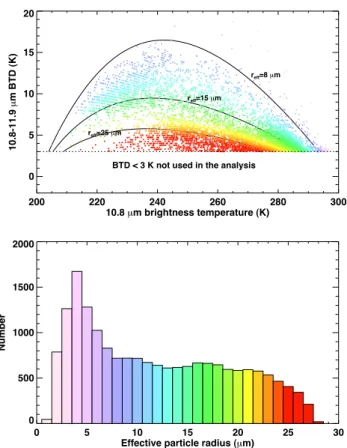
Fig. 2. Ice mass retrievals from SEVIRI 11 and 12 µm data.
Ob-served 11–12 µm brightness temperature difference (BTD in K) vs. 11 µm brightness temperature (K) for 9 consecutive SEVIRI images spanning the time interval 19:30 to 21:30 UT on 20 May 2006 (top panel). The points are colour coded to show particle size; lilac rep-resents small particles (<8 µm) and red reprep-resents larger particles (>25 µm). The effective particle size histogram for ∼50 000 data points is also shown (bottom panel).
Ice can be inferred from brightness temperature differences (BTDs) between SEVIRI 11 and 12 µm channels. Methods for retrieving cloud microphysics from satellite infrared mea-surements have been described by Inoue (1985), Wu (1987), Prata (1989), Parol et al. (1991), Prata and Barton (1993), Wen and Rose (1994), Rose et al. (1995) and Prata and Grant
(2001), among others. The technique used here follows
closely that described by Wen and Rose (1994) and Prata and Grant (2001) in which Mie scattering code is used to deter-mine phase functions and absorption/scattering parameters for prescribed particle size distributions – the Gamma distri-bution (Deirmendjian, 1969) is used, and prescribed refrac-tive indices of ice (Warren, 1984) averaged over the band-passes of the SEVIRI channels. A discrete ordinate radiative transfer model (Stamnes et al., 1988) is applied to determine the 11 and 12 µm brightness temperatures. The observations of 11 and 12 µm brightness temperatures are then used with the model values in an inversion algorithm that generates ef-fective particle radius and infrared optical depth. Integration
of these values over all image pixels provides an estimate of ice mass in the cloud.
The retrievals are carried out on an image-by-image basis and ice masses are calculated over all pixels for which the BTD>3 K. This criterion is used to reject pixels with either high infrared opacity, or very transparent pixels, for which the cloud fraction is small. Retrieval of cloud parameters for highly opaque or highly transparent pixels is subject to large errors (Prata and Barton, 1993). Figure 2 shows the ice retrieval results for 9 images, spanning the time interval from 19:30 to 21:30 UT on 20 May 2006. The top panel shows BTD vs. 11 µm brightness temperature observations and modelled behaviour for three different effective particle sizes (solid black line). The particle sizes are colour coded with smallest sizes (1 µm) in lilac and largest sizes (28 µm) in red. The bottom panel of this figure shows the retrieved particle size distribution for ∼50 000 data points. The obser-vations and the model results suggest that largest ice particle sizes give rise to smallest BTDs. Similar results would be ex-pected for water droplets, however it is more likely that the particles are in the ice phase as cloud top temperatures are in the range 200–220 K. Ash particles cannot produce posi-tive BTDs, irrespecposi-tive of their size (Prata, 1989; Wen and Rose, 1994) and it is unlikely that there are any other chemi-cal species or particle types (soot or windblown dust) present in the cloud.
A sequence of 97 SEVIRI retrievals of SO2 column
and ice mass for the time period 11:00 UT, 20 May to 11:00 UT, 21 May are presented as a movie loop (Movie 1 – http://www.atmos-chem-phys.net/7/5093/2007/ acp-7-5093-2007-supplement.zip) to show the rapid
move-ment of the SO2and the remarkable changes in the mass of
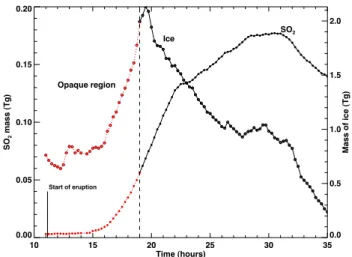
ice and SO2as the cloud evolves. Figure 3 shows the
tem-poral development of the ice and SO2 masses for the first
34 h after the eruption. This clearly shows the SO2mass
in-creasing as the ice mass decreases, and the peak in SO2mass
occurs ∼8 h after the peak in ice mass.
The effective ice cloud particle radii may have been re-duced by ash pollution (Rosenfeld, 2000), and the abundance of ice in the cloud supports previous work on the ubiquity of ice in eruption clouds (Rose et al., 1995; Tupper et al., 2004), especially at tropical latitudes. The ice must also have pen-etrated the tropopause and moistened the stratosphere, with potential radiative impacts and consequences for the strato-spheric water vapour budget. The temporal development of the eruption cloud (Fig. 3) suggest that in the early phase, the
ice masked the SO2signature, probably because much of the
SO2gas was sequestered by the ice particles, only to
subli-mate at a later stage as the ice evaporated. Approxisubli-mately 2 Tg of ice is evident ∼20 h after the initial eruption (Fig. 3). The ice may also have played a role in depleting the cloud of HCl.
Minimum temperatures at the centre of the eruption cloud were 200 K, while there is evidence of warmer temperatures (218 K) near the cold core suggesting overshooting and
pen-etration into the stratosphere. Based on a radiosonde ascent
from Guadeloupe (16.218◦N, 61.517◦W) at 12:00 UT on 20
May, the cloud-top temperatures imply geopotential heights of 17.5 km (200 K) and 20.6 km (218 K). A tropopause can be identified between 16.3 and 17.2 km in this profile.
The development of the eruption column and subsequent
injection of SO2into the atmosphere occurred within the
rel-atively short time frame of 15 min. The eruption cloud ap-pears to have penetrated the stratosphere in the first 15 min and then experienced rapid transport towards the WSW at
speeds of 15 ms−1 at a likely maximum altitude of 20 km.
Some parts of the cloud travel further south, reaching Venezuela and further inland towards Colombia. This more southerly branch of the cloud was lower in the atmosphere, below the tropopause, causing some disruption to aviation
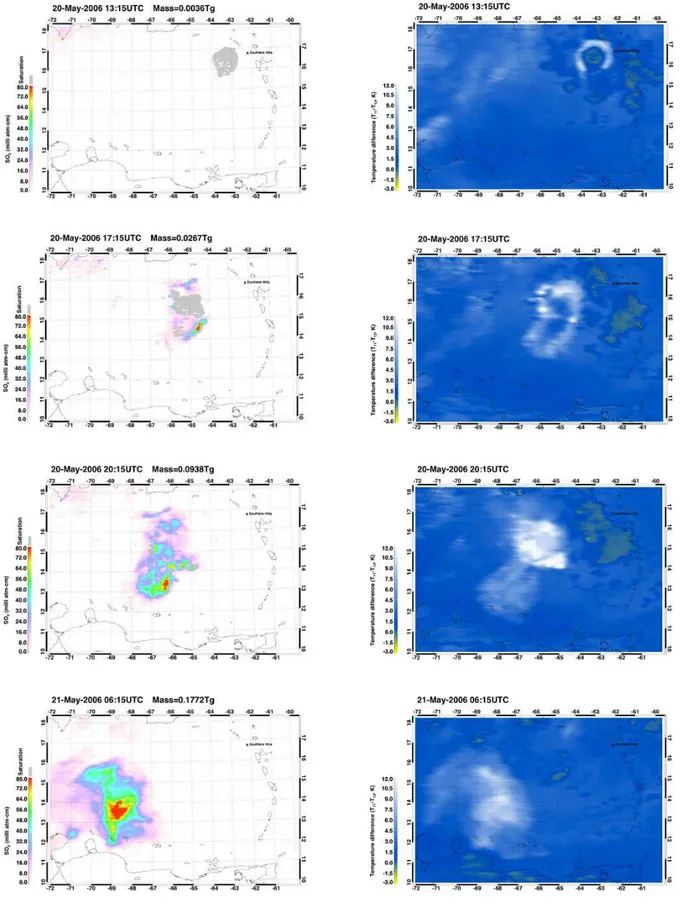
across the Caribbean. Figure 4 shows the SO2and ice cloud
at four different times during 20–21 May. At the start (top
panels) the SO2is completely obscured (grey areas on
left-most panels) by cloud. The regions of semi-transparent cloud are revealed by very large positive BTDs (indicated in white on the scale of the right-most panels). By 18:00 UT on 20
May the SO2 content of the cloud is fully revealed by the
SEVIRI data. A maximum loading of 0.177±0.04 Tg (SO2)
is estimated by SEVIRI at 06:15 UT, 21 May (Fig. 4, bottom-right panel). We caution that the SEVIRI algorithm has yet to be validated and interference from clouds may produce
errors as large as 30% in certain circumstances. The SO2
cloud reached 72◦W by 11:00 UT, 21 May and subsequently
moved out of the field-of-view of the SEVIRI instrument.
4.2 Later evolution – AIRS, OMI and MLS measurements
Beyond the first day, the A-train polar-orbiters Aqua (AIRS) and Aura (OMI and MLS) were able to capture and detail
the movement of the SO2 cloud as it rapidly moved
west-wards in the stratospheric winds. Algorithms for
determin-ing SO2 from AIRS (Carn et al., 2005) exploit the strong
SO2anti-symmetric stretch absorption feature centred near
7.3 µm (1363 cm−1). This band is difficult to use to detect
SO2because water vapour absorbs strongly across the band,
however, accurate retrievals can be made provided the SO2
is above the water vapour, nominally above ∼3 km (Prata et al., 2003). Furthermore, the masking of lower tropospheric
SO2 by water vapour in this band provides a natural filter
for estimating upper troposphere/lower stratosphere
(UTLS)-only SO2, the component that has highest impact on climate.
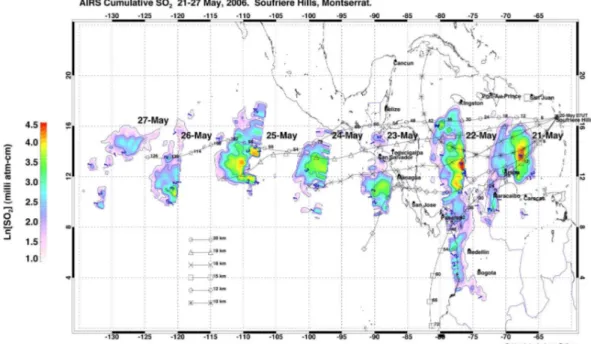
Figure 5 shows AIRS SO2 column amounts (in DU) for a
sequence of 6 days after the eruption. Overlaid onto this Fig-ure are 6 trajectories determined from the HYSPLIT model (Draxler and Rolph, 2003). The trajectories were initialised at 11:00 UT on 20 May and plotted at 6 h intervals. The best correspondence between the location of the cloud on 26 May and HYSPLIT is for the trajectory at 20 km. Lower trajecto-ries either move the cloud too slowly, too far north or too far
south. AIRS and OMI tracked a part of the SO2cloud
south-10 15 20 25 30 35 Time (hours) 0.00 0.05 0.10 0.15 0.20 SO 2 m a s s (T g ) Ice SO2 Start of eruption 0.0 0.5 1.0 1.5 2.0 Ma s s o f ic e (T g ) Opaque region
Fig. 3. Temporal development of the SO2total column and ice mass
(both in Tg) derived from SEVIRI data.
wards or SSW across Venezuela and Colombia. This portion fits a trajectory at 15 km. The best estimate of the
strato-spheric SO2burden from AIRS data is 0.178±0.02 Tg(SO2).
The abruptness of the eastern edge of the SO2cloud
notice-able in the sequence is due to the narrowness of the AIRS swath.
The Soufri`ere Hills SO2 cloud was also analysed using
an updated OMI SO2 algorithm optimised for large SO2
column amounts (Krotkov et al., 2006). OMI detected the
SO2 cloud on 20 May and continued to track the cloud
until 11 June, when it was located over the Indian Ocean (Movie 2 – http://www.atmos-chem-phys.net/7/5093/2007/ acp-7-5093-2007-supplement.zip). OMI uses UV reflected
sunlight to determine SO2 column amount and therefore
cannot detect at night; however the greater swath width and superior accuracy of OMI complement retrievals from AIRS and SEVIRI. The peak burden measured by OMI was
∼0.22 Tg (SO2)(see Carn et al., 2007); this difference from
the AIRS result may reflect the contiguous spatial coverage of OMI that permitted mapping of the entire cloud.
Fig-ure 6 shows the OMI SO2 volume mixing ratio (vmr)
de-termined by assuming that the cloud was centred at ∼20 km and had a vertical extent of 2 km, which is in accord with CALIPSO lidar estimates (Carn et al., 2007) and with
FLEX-PART modelling (see next section). SO2vmrs at 20 km vary
from ∼0.5 ppm to ∼5 ppm.
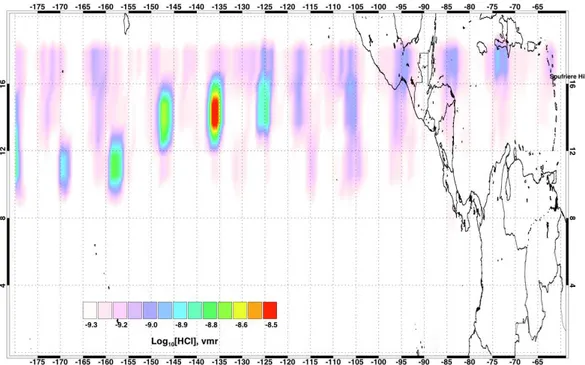
HCl was detected in the plume using retrievals from the Microwave Limb Sounder–MLS (Waters et al., 2006; Froide-vaux et al., 2006). The MLS field-of-view of ∼30 km across-track and ∼150 km along-across-track and the sparse sampling of the moving gas cloud make accurate estimates of the erupted HCl mass difficult. Thus we have accumulated the HCl re-trievals at 68.13 hPa (∼20 km) over the period 1–31 May and
within the geographic region bounded by 180◦W to 60◦W
Fig. 4. Column SO2 derived from MSG-SEVIRI (left-most panels) and 11–12 µm BTDs (right-most panels) for four different times:
06:15 UT, 20 May, 17:15 UT, 20 May, 20:15 UT, 20 May and 06:15 UT, 21 May. Grey coloured areas are regions of the cloud where SO2
31
Fig. 5. AIRS SO2total column retrievals for 21–26 May 2006. Also shown are HYSPLIT trajectories at six different altitudes. The trajectory at 20 km matches the AIRS observations best.
-175 -170 -165 -160 -155 -150 -145 -140 -135 -130 -125 -120 -115 -110 -105 -100 -95 -90 -85 -80 -75 -70 -65 -175 -170 -165 -160 -155 -150 -145 -140 -135 -130 -125 -120 -115 -110 -105 -100 -95 -90 -85 -80 -75 -70 -65 4 8 1 2 1 6 4 8 1 2 1 6 Soufriere Hills 0.03 0.04 0.06 0.10 0.16 0.25 0.40 SO2 (ppm)
Cumulative OMI/Aura SO2 total column 20 May - 6 June, 2006. Soufriere Hills, Montserrat.
Fig. 6. OMI SO2volume mixing ratio calculated for a plume at 20 km with a width of 2 km for the period 20 May to 6 June.
maximum HCl vmr occurs later than the maximum SO2vmr
and gas ratios HCl:SO2 vary from 0.03 to 0.1. This ratio
is smaller than that inferred for Pinatubo and El Chich´on of
∼0.2–0.25 (Westrich and Gerlach, 1992), but similar to that
found for the stratospheric portion from Pinatubo of ∼0.1
(Mankin et al., 1992) and for the Hekla 2000 volcanic plume of ∼0.07 (Rose et al., 2006). The lack of coincidence
be-tween the OMI SO2and MLS HCl vmrs may be due to the
different processing methods (the MLS data have been accu-mulated) or possibly due to the inadequate sampling of the
Fig. 7. MLS HCl volume mixing ratios at ∼68 hPa (∼20 km) for the period 20–31 May.
cloud by the MLS as the cloud travelled westwards. The MLS has both coarser ground field of view resolution and poorer sampling than the OMI so it is possible that it did not sample the position of the maximum HCl in the cloud.
The small mass of HCl, particularly at the early stages of the cloud’s evolution could also suggest that “scrubbing” of HCl is occurring, either through scavenging by ice or by removal in condensed supercooled water (Tabazedeh and Turco, 1993). Assuming that the HCl is coincident with the
SO2cloud, the mass of HCl erupted is ∼3–10 kt, which is
much smaller than might be expected based on petrologic ar-guments (Gerlach et al., 1996) or from observations in the Soufri`ere Hills volcano tropospheric plume (Edmonds et al., 2002).
5 Modelling the dispersion of the cloud
To simulate the dispersion of the SO2 cloud,
calcu-lations with the Lagrangian particle dispersion model
FLEXPART (Stohl et al., 1998, 2005) were made
(Movie 3 – http://www.atmos-chem-phys.net/7/5093/2007/ acp-7-5093-2007-supplement.zip). FLEXPART was origi-nally developed to simulate the dispersion of dangerous sub-stances from point sources and was validated for such appli-cations with data from continental-scale tracer experiments (Stohl et al., 2005). Since then it has been applied in a large number of studies on atmospheric transport, for instance in-tercontinental pollution transport or stratosphere-troposphere
exchange. FLEXPART is a pure transport model and no removal processes were considered here. FLEXPART was driven with operational analyses from the European Centre
for Medium-Range Weather Forecasts with 1◦×1◦
resolu-tion (derived from T319 spectral truncaresolu-tion) and a nest with 0.36◦×0.36◦resolution (derived from T799 spectral
trunca-tion) in the region 108–27◦W and 9–54◦N. The resolution
of the 91-level ECMWF data in the altitude range of interest here, 17–20 km, is about 500 m. In addition to the analyses at 00:00, 06:00, 12:00 and 18:00 UTC, 3-h forecasts at inter-mediate times (03:00, 09:00, 15:00, 21:00 UTC) were used.
Since the altitude of the SO2injection was not well known
beforehand, FLEXPART scenarios with injections at differ-ent 500 m altitude intervals were made and the model results
were compared with the satellite SO2retrievals. Finally, a
simulation injecting 0.027, 0.044, 0.108∼Tg (SO2)into
alti-tude bins of 17.5–18, 18–18.5, and 18.5–19.5 km was made, which most closely matched the observed plume.
In order to account for loss of SO2due to chemical
conver-sion of the SO2to H2SO4, a simple exponential decay factor
was applied, with an e-folding time of 24 days (Guo et al., 2004). Comparing the two movie loops of the OMI observa-tions (Movie 2 – http://www.atmos-chem-phys.net/7/5093/ 2007/acp-7-5093-2007-supplement.zip) with the FLEX-PART simulations (Movie 3 – http://www.atmos-chem-phys. net/7/5093/2007/acp-7-5093-2007-supplement.zip) it can be seen that in the initial phase there is good correspondence. By 21:00 UT on 23 May there is still very good correspon-dence between OMI and FLEXPART. OMI shows the cloud
as being broader, but the column amounts are quite close. A day later and some noticeable differences are apparent. FLEXPART has moved the cloud further north than OMI and the cloud is still broader in the OMI data. Both movies show a narrow trailing edge ending near the coast of Costa Rica and Panama. On 27 May at 21:00 UT the cloud has developed a SW-NE tilt, noticeable in both OMI and FLEX-PART. FLEXPART has moved the cloud further west and north compared to OMI observations. One reason for the dif-ferences in cloud shape between FLEXPART and OMI is due to the sampling differences. FLEXPART data are portrayed at 3-h time intervals, while the OMI sampling is variable and in some cases shows the cloud development over 22 h. FLEXPART simulations analysed over a similar time inter-val (∼22 h) show a much broader and longer cloud, in better agreement with the OMI observations. The faster movement of the cloud and its more northerly position in FLEXPART relative to OMI are likely due to cumulative errors in the wind field over the 12 day forecast period shown in addi-tion to any model deficiencies. The correspondence between the column amounts in FLEXPART and OMI after 10 days of travel is encouraging and suggests the e-folding time of 24
days for chemical loss of SO2is reasonable.
The simulation confirms that the SO2 observed by the
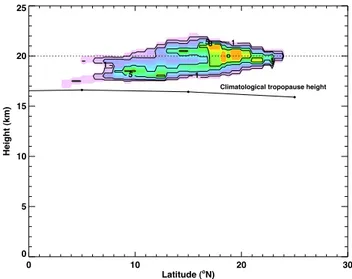
satellite instruments was indeed stratospheric, located at po-tential temperatures >380 K, or altitudes >17 km. A verti-cal section through the cloud on 7 June 2006, as it neared
the Philippines (∼127◦E) is shown in Fig. 8. The
full-width at half-maximum of the layer is ∼2 km, the height of the maximum concentration is 20 km and it is located
be-tween 17–21◦N. This is further north than OMI retrievals
suggest (∼10◦N), but the height and layer depth agree well
with CALIPSO first-light data. The section also suggests a double-layer structure and a slight tilt with latitude. Since the material was initially injected below 19.5 km, there must have been substantial uplift in the ascending branch of the Brewer-Dobson circulation, indicating future global
redistri-bution of the SO2in the stratospheric overworld. The fate of
the SO2will likely be complete conversion to aqueous
sul-phuric acid in the stratosphere where it will remain for 1–2 years.
6 Discussion
The combined use of three different satellite-based
measure-ments of the total column of SO2 provide a high degree
of confidence that 0.1±0.01 Tg (S) was injected into the stratosphere from the 20 May 2006 eruption of Soufri`ere
Hills volcano. A Lagrangian model confirms that the SO2
layer travelled rapidly westwards at a height of ∼20 km. The layer thickness (∼2 km, full width half-maximum) and height agree with first-light observations from the CALIPSO
lidar. The typical time constant for conversion of SO2 to
H2SO4 is ∼3 weeks, so much of this layer is likely to be
0 10 20 30 Latitude (oN) 0 5 10 15 20 25 H e ig h t (k m ) 1 1 1 5 58
Climatological tropopause height
Fig. 8. Vertical section through the FLEXPART model simulation
near 127◦E showing SO2concentrations in units of µg m−3. The
climatological lapse-rate tropopause height for May/June is also shown.
sulphate. The ability of OMI/AIRS to track the clouds for 23 days and over more than 18 000 km suggests these instru-ments will be very useful for providing better estimates of volcanic emissions and assist Volcanic Ash Advisory Centres (VAACs) to locate these hazardous clouds. It is worth noting that as the cloud approached the busy Australian/Japan flight routes, advisories were issued to the Meteorological Watch
Offices and airlines based on these satellite SO2 retrievals.
The airline industry chose to fly underneath the cloud, rather than divert flights and incur extra fuel costs. No encounters were reported.
The AIRS 7.3 µm band is most sensitive to UTLS SO2,
where interference from water vapour effects is minimised
and thus the AIRS SO2is indicative of SO2likely to have an
impact on global climate. Climate models use Aerosol Opti-cal Depth (AOD) or indices of volcanic eruption magnitude, as measures of the radiative effect of stratospheric aerosols. AOD is linearly related to the total column sulphate (Kiel and Briegleb, 1993), and the radiative forcing is linearly related to AOD (Hansen et al., 2002). These new satellite estimates
of SO2column amount can be used directly in climate
mod-els to assess the impact on atmospheric radiation. However, since it is the sulphate aerosol that causes the major climate
effect (SO2and ash also have climate effects), there is still
a need to use a chemical model to convert SO2 to H2SO4
aerosol.
The stratospheric transport and spread of this SO2cloud
has similarities to that of Pinatubo and Hudson in 1991, albeit
both produced much more SO2. The Pinatubo SO2cloud was
observed as a discrete cloud travelling predominantly west-wards and spreading laterally (see Fig. 4 of Guo et al., 2004).
with less lateral spread and greater zonal elongation as it trav-elled eastwards at the outer fringe of the southern polar vor-tex (Doiron et al., 1991; Schoeberl et al., 1993; Barton et al., 1992). It could be observed in TOMS data for 19 days (Do-iron et al., 1991) and Prata et al. (2003) show the movement
of the SO2cloud in TOVS retrievals for 9 days. Once these
SO2 clouds reach the stratosphere, rapid transport and
dis-persion ensure that they will spread globally and convert to
H2SO4aerosol with an e-folding time of the order ∼3 weeks.
The climate response of these kinds of stratospheric
injec-tions is governed by the quantity of SO2injected, as well as
by the latitude of injection.
Serious concern over the warming effects of increasing
CO2 levels in the atmosphere has led to a proposal to
in-ject S into the tropical stratosphere as a geo-engineering tool for cooling the climate (Crutzen, 2006; Wigley, 2006). An approach like this will rely on knowledge of the current sul-phate loading of the stratosphere and means for estimating the loading due to volcanic eruptions, some in very remote
locations and with little infrastructure to make reliable SO2
measurements. Applying linear scaling arguments based on the impact of Pinatubo on surface temperatures, viz. 10 Tg
(S) produced ∼0.6 K surface cooling, the Soufri`ere Hills SO2
cloud would cause <0.01 K of global surface cooling and is unlikely to have any noticeable affect. Less than 10 kt of HCl was detected in the cloud suggesting that HCl is effi-ciently removed and reduces the likelihood of serious ozone depletion from this stratospheric injection. The long-range transport and dispersion also suggests there would be negli-gible local effects due to this cloud.
Acknowledgements. The AIRS Science Team are thanked for
providing the AIRS level 1b geolocated radiance data and the MLS Science Team are thanked for supplying the v5.2 HCl retrievals. The three anonymous reviewers of this paper are thanked for their insightful comments and for suggesting improvements to our paper. Edited by: R. MacKenzie
References
Barton, I. J., Prata, A. J., Watterson, I. G., and Young, S. A.: Iden-tification of the Mt. Hudson volcanic cloud over SE Australia, Geophys. Res. Lett., 19, 1211–1214, 1992.
Bluth, G. J. S., Schnetzler, C. C., Krueger, A. J., and Walter, L. S.: The contribution of explosive volcanism to global atmospheric sulphur dioxide concentrations, Nature, 366, 327–329, 1993. Carn, S. A., Krotkov, N. A., Yang, K., Hoff, R. M., Prata, A. J.,
Krueger, A. J., Loughlin, S. C., and P. F. Levelt: Extended
obser-vations of volcanic SO2and sulphate aerosol in the stratosphere,
Atmos. Chem. Phys. Discuss., 7, 2857–2871, 2007, http://www.atmos-chem-phys-discuss.net/7/2857/2007/. Carn, S. A., Strow, L. L., de Souza-Machado, S., Edmonds, Y., and
Hannon, S.: Quantifying tropospheric volcanic emissions with AIRS: the 2002 eruption of Mt. Etna (Italy), Geophys. Res. Lett., 32(2), L02301, doi:10.1029/2004GL021034, 2005.
Crutzen, P.: Albedo enhancement by stratospheric sulphur in-jections: A contribution to resolve a policy dilemma?, Cli-matic Change, 77, 3–4, 211–220, doi:10.1007/s10584-006-9101-y, 2006.
Deirmendjian, D.: Electromagnetic scattering on spherical polydis-persions, Elsevier, 290 pp., 1969.
Deshler, T., Andersen-Sprecher, R., Jager, H., Barnes, J., Hofmann, D. J., Clemensha, B., Simonich, D., Osborn, M., Grainger, R. G., and Godin-Beekmann, S.: Trends in the nonvolcanic component of stratospheric aerosol over the period 1971–2004, J. Geophys. Res., 111, D10201, doi:10.1029/2005JD006089, 2006.
Doiron, S. D., Bluth, G. J. S., Schnetzler, C. C., Krueger, A. J., and
Walter, L. S.: Transport of Cerro Hudson SO2clouds, EOS Trans
AGU, 72, 489–498, 1991.
Draxler, R. R. and Rolph, G. D.: HYSPLIT (Hybrid Single-Particle Lagrangian Integrated Trajectory) Model access via NOAA ARL READY Website (http://www.arl.noaa.gov/ready/hysplit4.html), NOAA Air Resources Laboratory, Silver Spring, MD, USA, 2003.
Edmonds, M., Pyle, D., and Oppenheimer, C.: HCl emissions at Soufri`ere Hills Volcano, Montserrat, West Indies, during a sec-ond phase of dome building: November 1999 to October 2000, B. Volcanol., 64, 21–30, 2002.
Froidevaux, L., Livesey, N. J., Read, W. G., et al.: Early Validation Analyses of Atmospheric Profiles From EOS MLS on the Aura Satellite, IEEE T. Geosci. Remote, 45(5), 1106–1121, 2006. Gerlach, T. M., Westrich, H. R., and Symonds, R. B.: Pre-eruption
vapour in magma of the climactic Mt. Pinatubo eruption: Source of the giant stratospheric sulphur dioxide cloud, in: Fire and Mud, Eruptions and Lahars of Mount Pinatubo, Philippines, edited by: Newhall and Punongbayan, University of Washing-ton Press, Seattle, 415–433, 1996.
Guo, S., Bluth, G. J. S., Rose, W. I., Watson, M., and Prata, A. J.:
Re-evaluation of SO2release of the 15 June 1991 Pinatubo
erup-tion using ultraviolet and infrared satellite sensors, Geochem. Geophy. Geosy., 5(4), Q04001, doi:10.1029/2003GC000654, 2004.
Halmer, M. M., Schmincke, H.-U., and Graf, H.-F.: The annual vol-canic gas input into the atmosphere, in particular into the strato-sphere: a global data set for the past 100 years, J. Volcanol. Geoth. Res., 115, 511–528, 2002.
Hansen, J., Lacsis, A., Ruedy, R., and Sato, M.: Potential climate impact of Mount Pinatubo eruption, Geophys. Res. Lett., 19(2), 21–218, 2002.
Inoue, T.: On the transparent and effective emissivity determina-tion of semitransparent clouds by bispectral measurements in the 10 µm region, J. Meteorol. Soc. Jpn., 63, 88–98, 1985.
Kiehl, J. T. and Briegleb, B. P.: The relative roles of sulphate aerosols and greenhouse gases in climate forcing, Science, 260, 311–314, 1993.
Krotkov, N. A., Carn, S. A., Krueger, A. J., Bhartia, P. K., and Yang, K.: Band Residual Difference algorithm for
re-trieval of SO2 from the Aura Ozone Monitoring Instrument
(OMI), IEEE T. Geosci. Remote Sensing, 44(5), 1259–1266, doi:10,1109/TGRS.2005.861932, 2006.
Krueger, A. J., Walter, L. S., Bhartia, P. K., Schnetzler, C. C., Krotkov, N. A., Sprod, I., and Bluth, G. J. S.: Volcanic sulphur dioxide measurements from the total ozone mapping spectrome-ter instruments, J. Geophys. Res., 100, 14 057–14 076, 1995.
Mankin, W. G., Coffey, M. T., Goldman, A.: Airborne observations
of SO2, HCl, and O3in the stratospheric plume of the Pinatubo
volcano in July 1991, Geophys. Res. Lett., 19(2), 179–182, 1992. McGonigle, A. J. S., Oppenheimer, C., Galle, B., Mather, T. A, and Pyle, D. M.: Walking traverse and scanning DOAS mea-surements of volcanic gas emission rates, Geophys. Res. Lett., 29(20), 1985, doi:10.1029/2002GL015827, 2002.
Parol, F., Buriez, J. C., Brogniez, G., and Fouquart, Y.: Information content of AVHRR channels 4 and 5 with respect to the effective radius of cirrus cloud particles, J. Appl. Meteorol., 30, 973–984, 1991.
Prata, A. J.: Infrared radiative transfer calculations for volcanic ash clouds, Geophys. Res. Lett., 16(11), 1293–1296, 1989.
Prata, A. J. and Barton, I. J.: A multichannel, multiangle method for the determination of infrared optical depth of semi-transparent high cloud from an orbiting satellite, Part 1: Formulation and simulation, J. Appl. Meteorol., 32, 1623–1637, 1993.
Prata, A. J. and Bernardo, C.: Retrieval of volcanic SO2column
abundance from AIRS data, J. Geophys. Res., in press, 2007. Prata, A. J. and Grant, I. F.: Retrieval of microphysical and
mor-phological properties of volcanic ash plumes from satellite data: Application to Mt. Ruapehu, New Zealand, Q. J. Roy. Meteor. Soc., 127, 2153–2179, 2001.
Prata, A. J. and Kerkmann, J.: Simultaneous retrieval of volcanic
ash and SO2using MSG-SEVIRI measurements, Geophys. Res.
Lett., 34, L05813, doi:10.1029/2006GL028691, 2007.
Prata, A. J., O’Brien, D. M., Rose, W. I., and Self, S.: Global, long-term sulphur dioxide measurements from TOVS data: A new tool for studying explosive volcanism and climate, Volcan-ism and the Earth’s Atmosphere, Geophysical Monograph, 139, 75–92, doi:10.1029/139GM05, 2003.
Robock, A.: Climatic impact of volcanic emissions, in: State of the Planet, edited by: Sparks, R. S. J. and Hawkesworth, C. J., physical Monograph, 150, IUGG Volume 19, (American Geo-physical Union, Washington, DC), 125–134, 2004.
Robock, A.: Volcanoes and Climate, Rev. Geophys., 38(2), 191– 219, 2000.
Rosenfeld, D.: Suppression of rain and snow by urban and industrial air pollution, Science, 287, 1793–1796, 2000.
Rose, W. I., Delene, D. J., Schneider, D. J., Bluth, G. J. S., Krueger, A. J., Sprod, I., McKee, C., Davies, H. L., and Ernst, G. G. J.: Ice in the 1994 Rabaul eruption cloud: Implications for volcano hazard and atmospheric effects, Nature, 375, 477–479, 1995.
Rose, W. I., Millard, G. A., Mather, T. A., et al.: The atmospheric chemistry of a 33–34 hour old volcanic cloud from Hekla Vol-cano (Iceland): Insights from direct sampling and the applica-tion of chemical box modeling, J. Geophys. Res., 111, D20206, doi:10.1029/2005JD006872, 2006.
Schoeberl, M. R., Doiron, S. D., Lait, L. R., Newman, P. A., and
Krueger, A. J.: A Simulation of the Cerro Hudson SO2Cloud, J.
Geophys. Res., 98, 2949–2955, 1993.
Stamnes, K., Tsay, S.-C., Wiscombe, W., and K. Jayaweera: Nu-merically stable algorithm for discrete-ordinate-method radiative transfer in multiple scattering and emitting layered media, Appl. Optics, 27, 2502–2509, 1988.
Stohl, A., Hittenberger, M., and Wotawa, G.: Validation of the Lagrangian particle dispersion model FLEXPART against large scale tracer experiment data, Atmos. Environ., 32, 4245–4264, 1998.
Stohl, A., Forster, C., Frank, A., Seibert, P., and Wotawa, G.: Tech-nical note: The Lagrangian particle dispersion model FLEX-PART version 6.2, Atmos. Chem. Phys., 5, 2461–2474, 2005, http://www.atmos-chem-phys.net/5/2461/2005/.
Tabazedeh, A. and Turco, R. P.: Stratospheric chlorine injection by volcanic eruptions: HCl scavenging and implications for ozone, Science, 260, 1082–1086, 1993.
Tupper, A., Carn, S. A., Davey, J., Kamada, Y., Potts, R. J., Prata, A. J., and Tokuno, M., An evaluation of volcanic cloud detec-tion techniques during recent significant erupdetec-tions in the western “Ring of Fire”, Remote Sens. Environ., 91, 27–46, 2004. Warren, S. G.: Optical constants of ice from the ultraviolet to the
microwave, Appl. Optics, 23(8), 1206–1225, 1984.
Waters, J. W., Froidevaux, L., Harwood, R. S., et al.: The Earth Observing System Microwave Limb Sounder (EOS MLS) on the Aura satellite, IEEE T. Geosci. Remote, 44(5), 1075–1092, 2006. Wen, S. and Rose, W. I.: Retrieval of sizes and total masses of parti-cles in volcanic clouds using AVHRR bands 4 and 5, J. Geophys. Res., 99(D3), 5421–5431, 1994.
Westrich, H. R. and Gerlach, T. M.: Magmatic gas source for
the stratospheric SO2cloud from the 15 June 1991 eruption of
Mount Pinatubo, Geology, 20(10), 867–870, doi:10.1130/0091-7613, 1992.
Wigley, T. M. L.: A combined mitigation/geoengineering approach to climate stabilization, Science, 314, 452–454, 2006.
Wu, M.-L.: A method for remote sensing the emissivity, fractional cloud cover and cloud top temperature of high-level, thin cirrus, J. Clim. Appl. Meteorol., 26(2), 225–233, 1987.