HAL Id: hal-00298894
https://hal.archives-ouvertes.fr/hal-00298894
Submitted on 11 Sep 2007HAL is a multi-disciplinary open access
archive for the deposit and dissemination of sci-entific research documents, whether they are pub-lished or not. The documents may come from teaching and research institutions in France or abroad, or from public or private research centers.
L’archive ouverte pluridisciplinaire HAL, est destinée au dépôt et à la diffusion de documents scientifiques de niveau recherche, publiés ou non, émanant des établissements d’enseignement et de recherche français ou étrangers, des laboratoires publics ou privés.
Response of ”Glacier-Runoff” system in a typical
monsoonal temperate glacier region, Hailuogou Basin in
Mt. Gongga of China, to global warming
Zongxing Li, Yuanqing He, Xiaomei Yang, Xianzhong He, Hongxi Pang,
Wenxiong Jia, Caixia Zhang, Linlin Yuan, Haoyu He, Xinxin Zuo
To cite this version:
Zongxing Li, Yuanqing He, Xiaomei Yang, Xianzhong He, Hongxi Pang, et al.. Response of ”Glacier-Runoff” system in a typical monsoonal temperate glacier region, Hailuogou Basin in Mt. Gongga of China, to global warming. Hydrology and Earth System Sciences Discussions, European Geosciences Union, 2007, 4 (5), pp.3395-3412. �hal-00298894�
HESSD
4, 3395–3412, 2007 Response of “Glacier-Runoff” system Zongxing Li et al. Title Page Abstract Introduction Conclusions References Tables Figures ◭ ◮ ◭ ◮ Back CloseFull Screen / Esc
Printer-friendly Version
Interactive Discussion
EGU
Hydrol. Earth Syst. Sci. Discuss., 4, 3395–3412, 2007 www.hydrol-earth-syst-sci-discuss.net/4/3395/2007/ © Author(s) 2007. This work is licensed
under a Creative Commons License.
Hydrology and Earth System Sciences Discussions
Papers published in Hydrology and Earth System Sciences Discussions are under open-access review for the journal Hydrology and Earth System Sciences
Response of “Glacier-Runoff” system in a
typical monsoonal temperate glacier
region, Hailuogou Basin in Mt. Gongga of
China, to global warming
Zongxing Li1, Yuanqing He1, Xiaomei Yang2, Xianzhong He1, Hongxi Pang1, Wenxiong Jia1, Caixia Zhang1, Linlin Yuan1, Haoyu He1, and Xinxin Zuo1
1
The State Key Laboratory of Cryosphere Science, Cold and Arid Region Environment and Engineering Research Institute ,Chinese Academy of Sciences, Lanzhou 730000, China
2
College of Geography and Environment Science, Northwest Normal University, Lanzhou 730070, China
Received: 27 August 2007 – Accepted: 10 September 2007 – Published: 11 September 2007 Correspondence to: Zongxing Li ([email protected])
HESSD
4, 3395–3412, 2007 Response of “Glacier-Runoff” system Zongxing Li et al. Title Page Abstract Introduction Conclusions References Tables Figures ◭ ◮ ◭ ◮ Back CloseFull Screen / Esc
Printer-friendly Version
Interactive Discussion
EGU
Abstract
The method of correlation analysis and trend analysis were used in this research in order to confirm the response of “glacier-runoff” system to global warming. Hailuogou glacier had retreated by 1871.8 m over the past 76 years, Hailuogou No. 2 glacier had also retreated by 1100 m. Glaciers retreats are contrary to the climatic warming trend 5
in China and the Northern Hemisphere. Glaciers in Hailuogou basin were in the loss with a fluctuating manner since 1950s, and accumulative value of mass balance is −10 825.5 mm water equivalent with an annual mean value of −240.6 mm. The inverse correlation is highly significant between mass balance variation and climatic fluctuation of China and the Northern Hemisphere after 1950s. Glacier ablation is intensive with a 10
ratio of 7.86 m yr−1. A steady rise tendency toward glaciers runoff has been observed since 1980s, and the runoff rise is mainly responsible for melt water in Hailuogou basin. It is noticeable that climatic warming not only strengthened ablation extent and enlarged ablation area, but also prolonged ablation period. Global warming is the main cause of glacier retreat, mass loss and runoff rise in Hailuogou basin.
15
1 Introduction
Global warming has already become the focus of attention for both governments and scientists all over the world. The report of IPCC (2007) indicated that global warming has a accelerative tendency since 1910s, and the global annual mean temperature increased by 0.74◦C from 1906 to 2005, and global annual mean temperature will in-20
crease by 1.1–6.4◦C in 2100. The temperature has increased by 0.4–0.5◦C from 1860 to 2005 in China, and temperature rise in winter was obvious after 1951 and it has expe-rienced 19 green winters since 1986/1987 (Climate and Environment in China, 2006). Global warming has caused shrinking of most glaciers and ice caps in the word over the last century, especially in recent decades (Johannesson et al., 1989; Shen Yongping, 25
HESSD
4, 3395–3412, 2007 Response of “Glacier-Runoff” system Zongxing Li et al. Title Page Abstract Introduction Conclusions References Tables Figures ◭ ◮ ◭ ◮ Back CloseFull Screen / Esc
Printer-friendly Version
Interactive Discussion
EGU
Yafeng and Liu Shiying, 2000; Shi Yafeng, 2001; Yao Tandong et al., 2004; Dyurgerov, 2003). The retreat extent of glaciers all over the world during 1884–1978 is equivalent to that of global warming (temperature increased by 0.66±0.1◦C) in the same period, and the total area of mountainous glaciers in the world will decrease by 1/3–2/3 in the 21st century (Oerlemans, 1994). Runoff will increase by 10–40% in 2050 in these rivers 5
dominated by melt water in high latitude and alpine region of eastern equatorial Africa, southern America, Northern America and Eurasia (Blain and Milly, 1991; Milly, 1994, 1999; Chiew and Mcmahon, 1994).Glacier mass balance is directly linked to glacier fluctuations and climate change and also directly reflects changes of glacier volume, melting and runoff. Monsoonal temperate glaciers in China are distributed in the region 10
of the southeastern plateau of Tibetan plateau, including Mt. Hengduan and Mt. Daxue, the eastern part of the Himalayas, and the eastern segments of the Nyainqentanglha range (Fig. 1). This region is characterized by high precipitation (1000–3000 mm) in the glacier-covered area, a low snowline (4200–5200 m), which is 800–1200 m lower than that of the polar glaciers in the western Tibetan plateau, and relatively high tem-15
perature (equilibrium line mean annual value −6◦C, summer value from −1 to −5◦C). According to Chinese glacier inventory, there are 8607 monsoonal temperate glaciers in China covering an area of 13 200 km2, which is 18.6% of the total glacier number and 22.2% of total glacier area, which are the main component elements of alpine cold environment in the western China. Monsoonal temperate glaciers is the most sensitive 20
and clear indictor of climatic change, which have a shorter lag time in response to cli-matic change than polar glacier, whose lag phase is 10–20 years or so (He Yuanqing et al., 2003). This paper, taking the Hailuogou basin in Mt. Gongga as an example, is intended to explore the response of the “glaciers-runoff” system in Hailuogou basin, to global warming, and provide proofs on global warming from cryosphere of the mon-25
HESSD
4, 3395–3412, 2007 Response of “Glacier-Runoff” system Zongxing Li et al. Title Page Abstract Introduction Conclusions References Tables Figures ◭ ◮ ◭ ◮ Back CloseFull Screen / Esc
Printer-friendly Version
Interactive Discussion
EGU
2 Study area, data and methodology
As the part of Qinghai-Tibet plateau, MT. Gongga is 7556 m high which is situated in the middle segment of MT. Daxue (29◦20′∼30◦20′N, 101◦30′∼102◦15′E). Hailuogou basin is located at the eastern slope of MT. Gongga with an area of 80.5 km2. The regional climate is dominated by the southwest and southeast monsoons in wet sea-5
son, whereas westerly and Qinghai-Tibet monsoon in dry season. Hailuogou basin is one of main glaciers areas in the eastern slope of MT. Gongga (Fig. 1), where are 7 glaciers covering an area of 36.44 km2(Pujiancheng, 1994), Hailuogou glacier, Hailu-ogou No. 1 glacier, HailuHailu-ogou No. 2 glacier and other 4 smaller glaciers. The annual precipitation at glacier’s tongue (3000 m a.s.l.) is about 1960 mm with a maximum from 10
June to September, and the annual mean air temperature is 4◦C. The annual mean air temperature at the ELA (4900 m a.s.l.) is about −4.4◦C with an annual precipitation of 3000 mm (Su Zheng and Liu Shiying, 2001).
Glacier variation data are based on field survey in 1936, 1966, 1982, 1989, 1994 and 2006. In addition, the previous research (Heim, 1936; Li Jijun and Su Zhemng, 15
1996; He Yuanqing et al., 2003; Li Zongxing et al., 20071), and aerial photographs of December 1966 and November 1982, 1:200 000 topographic map of 1966 are also em-ployed to rebuild the change process of Hailuogou glacier and Hailuogou No. 2 glacier which were connected to each other during the historical stage. Mass balance data are available from 1959 to 2003, which have been reconstructed by the meteorological and 20
hydrological data using the method of glacial mass balance (Shi Yafeng et al., 2000). The meteorological data during 1988–2004 have been collected at the Alpine Meteo-rological Station located at 3000 m a.s.l. The hydMeteo-rological data during 1999–2004 have been collected at the Glacier Hydrological Station located at 2920 m a.s.l., about 1 km downstream of the glacier terminus. Glacier ablation data during 1990–1994 in the 25
1
Li Zongxing, He yuanqing, and Theakstone, W. H.: Changes of Glacier Hailuogou under the Background of Global Warming in Recent 100 Years, Mt. Gongga, China, J. Glaciol., in review, 2007.
HESSD
4, 3395–3412, 2007 Response of “Glacier-Runoff” system Zongxing Li et al. Title Page Abstract Introduction Conclusions References Tables Figures ◭ ◮ ◭ ◮ Back CloseFull Screen / Esc
Printer-friendly Version
Interactive Discussion
EGU
study area were provided by Ecological System and Environment Research Station, Chengdu Institute of Mountain Hazards and Environment, CAS. The climatic data of Kangding station was obtained at Kanding Meteorological Bureau. The climatic data of China and The Northern Hemisphere was from the previous study (Wang Shaowu and Ye Jingling, 1998). We carried out trend analysis by the linear regression for the 5
long-term climate and glacier data, and used correlation analysis for meteorological, hydrological and mass balance data to quantify the response of “glacier-runoff” system to global warming, in Hailuogou basin, China.
3 Discussions and results
3.1 Sensitivity of glaciers retreat to global warming 10
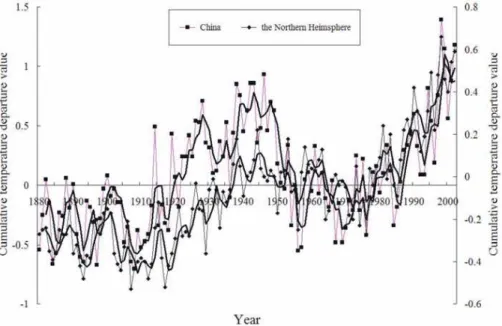
Since the early of the 20th century, a steady tendency toward glaciers retreat has been observed, which can be manifested by glacier retreat and rise of glaciers fronts elevation (Table 1). Meanwhile, temperature has increased with a fluctuating manner in China and the Northern Hemisphere during the 20th century (Fig. 2). At least four main phases (two cold phases and two warm phases) are distinguishable. The first cold 15
phase is from the end of 19th century to 1920s, glaciers were in steady or advance. In the second cold phase from beginning of 1970s to mid of 1980s, Glaciers were in relative stationery or speed-down recession. Hailuogou glacier retreated 177.8 m in length and raised 20 m in elevation, and the annual mean value is 11.8 m yr−1, which is 19.3 m and 12.2 m lower than that of the second stage and the fourth stage, whereas 20
Hailuogou No. 2 glacier was in steady. Hailuogou glacier retreated more than 1150 m in length and 30–50 m in elevation, and Hailuogou No. 2 glacier retreated 800 m and glacier front have been separated from Hailuogou glacier in the first warm phase during from 1930s to the end of 1960s. Glaciers have been in intensive recession in response to rapid climatic warming in the second warm phase during the period from the mid 25
HESSD
4, 3395–3412, 2007 Response of “Glacier-Runoff” system Zongxing Li et al. Title Page Abstract Introduction Conclusions References Tables Figures ◭ ◮ ◭ ◮ Back CloseFull Screen / Esc
Printer-friendly Version
Interactive Discussion
EGU
an annual mean value of 24 m, and elevation has risen by 60 m from 1989 to 2006, whereas elevation of Hailuogou No. 2 glacier raised by 280 m from 1994 to 2006.
By the contrast between glaciers variation and temperature fluctuation in China and the Northern Hemisphere over the past 100 years, it is clear that they have significant relationship taken into account a lag phase when glaciers retreat respond to climatic 5
fluctuation. Glaciers retreat stages were in the warm phase, and vice versa. This meant strong ablation is mainly responsible for the glacier retreat in the warm phase. It is distinct that the lag phase of glacier retreat responded to climatic fluctuation is shorter in the second warm phase (the lag phase is 10 years or so) than that of other two glacier retreat stages (the lag phase is 20 years or so). There are three reasons 10
can explain it. Firstly, the glacier scale, area and volume gradually become smaller ow-ing to the continuant glacier mass loss. The smaller glacier scale is, the more sensitive to climate fluctuation is. Secondly, The rapid temperature rise since 1980s which has been the most distinct temperature rise since the Little Ice Age, it not only accelerated glacier ablation but also enlarged ablation area and prolonged ablation period. Thirdly, 15
Hailuogou basin is mainly dominated by monsoonal climate, so high temperature pe-riod, high ablation period and high precipitation period are the same period from May to October per year, which farther accelerated the velocity of glacier ablation and the extent of glacier retreat under the background of global warming.
3.2 Sensitivity of mass balance to global warming 20
It can be seen clearly from Fig. 3 that glaciers in Hailuogou basin were in a con-stant snow-ice masses loss over the past 45 years when the climate warming is rein-forced in both China and the Northern Hemisphere. The accumulative mass balances value is −10 825.5 mm water equivalent, with an annual mean value of −240.6 mm from 1959/60 to 2003/04. There are two inflexion point of mass balance variation be-25
tween 1970/71 and 1984/85 (Fig. 3), the annual mean mass balance value varied from −178.8 mm yr−1 from 1959/60–1970/71 to 109.4 mm yr−1 during the period 1971/72– 1984/85 to −537.5 mm yr−1 during 1985/86–2003/04. Three main phases are
distin-HESSD
4, 3395–3412, 2007 Response of “Glacier-Runoff” system Zongxing Li et al. Title Page Abstract Introduction Conclusions References Tables Figures ◭ ◮ ◭ ◮ Back CloseFull Screen / Esc
Printer-friendly Version
Interactive Discussion
EGU
guishable: (1) negative phase between 1959/60–1970/71; (2) positive phase between 1971/72–1984/85; (3) intensively negative phase between 1985/86–2003/04, with the accumulative mass balance values in these three phases of −2145.6 mm, 1532.2 mm and −10 212 mm water equivalent, respectively.
Temperature of China and the Northern Hemisphere over the last 45 years and the 5
mass balance shows a significant inverse correlation with temperature (Table 2). This indicated that strong melting is mainly responsible for the significantly negative mass balance. These facts confirmed that glacier mass loss is the result of global warming, because glacier ablation is intensive in the negative balance phase and the ablation period is long due to obvious temperature rise. In addition, ablation area also enlarged 10
owing to the rise of the ELA under the influence of temperature rise. Glaciers were in the stationery or speed-down retreat in the positive balance phase because of a low temperature. The correlation coefficient between mass balance and temperature of the Northern Hemisphere is even higher than that of China, two reasons can account for it, on the one hand, the variation of mass balance has more active response to 15
large scope climatic change than that of small scope; on the other hand, the extent of climatic warming in the Northern Heimsphere is more remarkable than that of China according to the previous research (Wang Shaowu and Ye Jingling, 1998).
3.3 Sensitivity of runoff to global change
Temperature in China, Northern Heimsphere and Hailuogou basin since 1988 has ap-20
parently increased (Figs. 4c, d, e). The annual mean value in Hailuogou basin dur-ing 1997–2004 is 0.4◦C higher than that of during 1988–1996, and temperature at Kangding, 80 km northwest of Hailuogou basin, also increase by 0.44◦C in the same period. In addition, instrumental climatic data, ice core signals and tree ring indices indicate that the temperature in China’s monsoonal temperate glacier region has in-25
creased in a variable manner during the 20th century, and the rate of change has accelerated since the 1980s (He Yuanqing et al., 2003). Temperature rise, on the one hand, has resulted in an obvious increase of glacial runoff in Hailuogou basin. Annual
HESSD
4, 3395–3412, 2007 Response of “Glacier-Runoff” system Zongxing Li et al. Title Page Abstract Introduction Conclusions References Tables Figures ◭ ◮ ◭ ◮ Back CloseFull Screen / Esc
Printer-friendly Version
Interactive Discussion
EGU
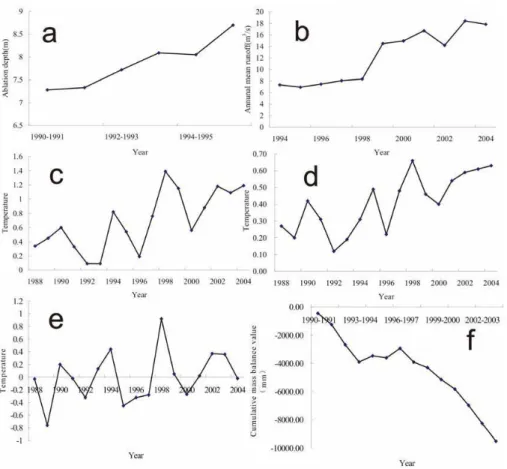
mean runoff during 1999–2004 is 5.65 m3/s higher than that of 1994–1998 (Fig. 4b); on the other hand, glacier ablation becomes stronger with the annual mean ablation ratio of 7.86 m yr−1, equal to 7199.76 mm water equivalent and to 3.7 year total precipitation of the study area (Fig. 4a). Because glacier ablation is intensive in the negative bal-ance phase and the ablation period gets longer under the background of temperature 5
rise. This meant the strong warming has led to enhanced glacier ablation. Climatic warming has intensified during 1980s in China’s monsoonal temperate glacier region has also caused reduction of cold energy in the glacier-covering area. It means a small temperature increase will lead to a nonlinear rise of glacier ablation.
Feedings of Hailuogou basin are precipitation, groundwater and melt water. Ground-10
water is often considered as a stationery part with the weak fluctuation in long-term according to hydrology theory (Li jijun and Su zheng, 1996). Which is the main contri-bution of runoff rise in recent years, precipitation or melt water? Some fact can explain it, (1) the winter mean runoff in the period 1999–2004 is 2.74 m3s−1 (264.6 mm water equivalent) higher than that of the period 1994–1998, whereas the winter mean pre-15
cipitation is only 87.7 mm which accounts for 4% of annual mean precipitation, so the runoff rise in winter is only the result of melt water supply, because the winter tem-perature increased by 0.69◦C from 1994–1998 to 1999–2004 in Hailuogou basin; (2) the statistical relationship(r=0.90, p<0.0001) between runoff and summer temperature of the local is more significant than that of (r=0.80, p<0.0001) between runoff and 20
summer precipitation; (3) the annual mean precipitation only increased by 53 mm from the period 1994–1998 to the period 1999–2004, while the runoff depth increased by 2234 mm. obviously that the melt water rise preceded the precipitation rise, so it is in-dicated that melt water has made a great contribution on the increase of runoff making allowance for the precipitation rise; (4) the annual mean ablation value (7199.76 mm 25
water equivalent) is 3.67 times higher than the annual mean precipitation (1960 mm); (5) the statistical relationship is inverse correlation (r=−0.82, p<0.0001) between runoff and the mass balance during 1994–2004 (Figs. 4b, f), which also indicated that the main factor of runoff rise is melt water rise.
HESSD
4, 3395–3412, 2007 Response of “Glacier-Runoff” system Zongxing Li et al. Title Page Abstract Introduction Conclusions References Tables Figures ◭ ◮ ◭ ◮ Back CloseFull Screen / Esc
Printer-friendly Version
Interactive Discussion
EGU
Figure 5 shows the peak value of runoff depth in August, two month latter than that of precipitation in June. The runoff depth value in October is 162 mm higher than that in April, but precipitation between October and April is equal. It is noticeable that runoff depth is higher than corresponding precipitation all the year round. Hailuogou basin is smaller and is rocky mountainous region, and hydrological station is located at the 5
front of the glacier, so the cause of the hysteresis between runoff and precipitation is ice-snow melt water, being compared with precipitation, ice and snow can feed runoff after a long ablation time. It is indicated that the variation of ice-snow melt water arouse the seasonal variation of runoff in Hailuogou basin, and also manifested ice-snow melt water is the main feeding in Hailuogou basin.
10
4 Conclusions
1. Since the early of the 20th century, a steady tendency toward glaciers retreat has been observed, this is manifested in glacier retreat and rise of glaciers fronts ele-vation. Under the background of global warming, Hailuogou glacier had retreated by 1871.8 m in 76 years during the last century, with a mean annual retreat rate 15
of 24.7 m. Hailuogou No. 2 glacier had also retreated by 1100 m. Glaciers retreat stages were in the warm phase, and vice versa. Glaciers retreats are contrary to the climatic warming trend in China and the Northern Hemisphere in Hailuogou basin over the last 100 years.
2. Glaciers are in the loss with a fluctuating manner over the last 45 years in Hailu-20
ogou basin, which is in opposition to the temperature fluctuation in China and the Northern Hemisphere. The accumulative mass balances value is −10 825.5 mm water equivalent and the annual average value is −240.6 mm yr−1 water equiva-lent during from 1959/60 to 2003/04. The statistical relationship is inverse corre-lation between mass balance variation and climatic fluctuation.
25
HESSD
4, 3395–3412, 2007 Response of “Glacier-Runoff” system Zongxing Li et al. Title Page Abstract Introduction Conclusions References Tables Figures ◭ ◮ ◭ ◮ Back CloseFull Screen / Esc
Printer-friendly Version
Interactive Discussion
EGU
the period 1997–2004 to the period 1988–1996, and runoff also increased by 5.65 m3s−1, whereas precipitation only increased by 53 mm. Glacier ablation is very strong with an ration of 7.86 m yr−1. Ice-snow melt water is mainly respon-sible for runoff rise in Hailuogou basin, and it is also the main cause of runoff interannual and seasonal variation.
5
Acknowledgements. This study was jointly supported by an Important Directionality Program
of Chinese Academy of Sciences (KZCXZ-YW-317), a key Project of National Natural Sci-ence Foundation of China (90511007), an Innovative Research International Partnership Project, Chinese Academy Sciences (CXTD-Z2005-2), a Project for Outstanding Young Sci-entists of Chinese Natural Science Foundation (40121101), and a Natural Science Foundation,
10
No. 40501014. Thanks also to the editorial staff.
References
Blain, C. A. and Milly, P. C. D.: Development and application of a hillslope hydrologic model, Adv. Water Resour., 14(4), 168–174, 1991.
Chiew, F. H. S. and Mcmahon, T. A.: Application of daily rainfall-runoff model hydrology to 28
15
Australian catchments, J. Hydrol., 153, 386–416, 1994.
CWB: Climate and Environment in China, Science Press, Beijing, 2006.
He Yuanqing, Zhang Zhonglin, Theakstone, W. H., Tuo Chen, Tandong Yao, and Hongxi Pang: Changing features of climate and glaciers in China’s monsoonal temperate glacier region, J. Geophys. Res., 108(D17), 4530–4536, 2003.
20
Heim, A.: The glaciation and soliefluction of MinyaGongkaR, Geographical Journal, 87, 444– 454, 1936.
Johannesson, T., Raymond, C. F., and Waddington, E. D.: Time-scale for adjustment of glaciers to changes in mass balance, J. Glaciol., 35(121), 355–369, 1989.
Li Jijun and Su Zheng: Glaciers of MT.Hengduan, Science press, Beijing (in Chinese), 1996.
25
Mark Dyurgerov: Mountain and subpolar glaciers show an increase in sensitivity to climate warming and intensification of the water cycle, J. Hydrol., 282(1–4), 164–176, 2003.
Oerlemans, J. and Fortuin, J. P. E.: Sensitivity of glaciers and small ice caps to greenhouse warming, Science, 258, 115–118, 1992.
HESSD
4, 3395–3412, 2007 Response of “Glacier-Runoff” system Zongxing Li et al. Title Page Abstract Introduction Conclusions References Tables Figures ◭ ◮ ◭ ◮ Back CloseFull Screen / Esc
Printer-friendly Version
Interactive Discussion
EGU
Oerlemans, J.: Quantifying global warming from the retreat of glaciers, Science, 264, 243–245, 1994.
Milly, P. C. D.: Climate, interpersonal storage of soil water, and the annual water balance, Adv. Water Resour., 17(1–2), 19–24, 1994.
Milly, P. C. D.: Comment on “Antiphasing between Rainfall in Africa’s Rift Valley and North
5
America’s Great Basin”, Quat. Res., 51(1), 104–107, 1999.
Pu Jiancheng: Glacier Inventory of China (the changjiang river drainage basin), Gansu culture press, Lanzhou, 117–129 (in Chinese), 1994.
Shen Yongping: An Overview of Glaciers, Glacier Retreating and Its Impact in the Tibetan Plateau, A Consultative Report for Climate Impact and Adaptation Project in the Tibetan
10
Plateau submitted to the World Wide Fund for Nature – China Programme Office (WWF-China), 2004.
Shi Yafeng: Estimation of the water resources affected by climatic warming and glacier shrink-age before 2050 in west China, J. Glaciol. Geocryology (in Chinese), 23(4), 333–341, 2001. Shi Yafeng, Huang Maohuan, Yao Tandong, and Deng Yangxin: Glaciers and their
Environ-15
ments in China – the present, past and future, Science Press, Beijing (in Chinese), 2000. Shi Yafeng and Liu Shiying: Estimation on the response of glaciers in China to the global
warming in the 21st century, Chinese Science Bulletin, 45(4), 668–672, 2000.
Su Zheng and Liu Shiying: Glacier changes on the Hengduan Mountain and their response to climatic response, in: Environment and Ecosystem in the Eastern Edge of Qinghai-Xizang
20
Plateau, Sichuan University Press, 102–109, Chengdu (in Chinese), 2001.
The report of IPCC: Climate change 2007: the Physical Science Basis. Report of Working Group I of the Intergovernmental Panel on Climate Change, Cambridge University Press, Cambridge, 2007.
Wang Shaowu and Ye Jingling: Foundation of temperature change of China in the last 100
25
years, Q. J. Appl. Meteorol. (in Chinese), 9(4), 392–400, 1998.
Yao Tandong, Liu Shiyin, Pu Jianchen, Shen Yongping, and Lu Anxin: Recent glaciers retreat-ing in High Asia and their impact on the water resources of Northwest China, Science in China (Series D), 34(6), 535–543, 2004.
HESSD
4, 3395–3412, 2007 Response of “Glacier-Runoff” system Zongxing Li et al. Title Page Abstract Introduction Conclusions References Tables Figures ◭ ◮ ◭ ◮ Back CloseFull Screen / Esc
Printer-friendly Version
Interactive Discussion
EGU
Table 1. Advances and retreats of main glaciers in Hailuogou basin since the early of the 20th
century.
Glacier Time period Advance/retreat, m Altitude of front, m Annual mean change, m References
Hailuogou Glacier
Early 20th century to 1930s Steady or advance 2850 in 1930 Steady or advance Heim (1936)
1930–December 1966 −1150 2880–2900 in 1966 −31.1 Local studies in 1966;
satellite imagery of
December 1966 and
topographic map of
1966
December 1966–January 1983 −200 2920 in 1982 −11.8 Local studies in
1982;spatial images
of January 1982 and local studies in 1981
January 1983–December 1989 −147.8 2940(in 1989) −21.1 Local studies in 1983
April 1990–March 2004 −274 2980 in 1994 −18.2 Local studies in 1990,
1994, 2004
March 2004–June 2006 −100 or so 3000 in 2006 −50 or so Local studies in 2006
Hailuogou No.2 glacier
Early 20th century–1930 Front in contact with
glacier Hailuogou
Steady or advance Heim(1936)
1930–January 1966 −800 −21.6 Local studies in
1966;satellite imagery
of December 1966
and topographic map of 1966
December 1966–January 1981 Steady Steady Local studies in 1982;
spatial images of
November 1982 and local studies in 1981
January 1981–December 1990 −250 to 300 3600(in 1994) −25 to 30 Local studies in 1990
January 1991–June 1998 Rapid retreat 3880 (in 2006) Rapid retreat Local studies in 1994,
HESSD
4, 3395–3412, 2007 Response of “Glacier-Runoff” system Zongxing Li et al. Title Page Abstract Introduction Conclusions References Tables Figures ◭ ◮ ◭ ◮ Back CloseFull Screen / Esc
Printer-friendly Version
Interactive Discussion
EGU
Table 2. Statistical relationship between mass balance and temperature.
Correlation sample R(Correlation coefficient) Nnumber)(Sample P (Confidence level ) The Northern
Heimsphere
China The Northern
Heimsphere
China Between cumulative
balance value and cumulative temper-ature value during 1960–2004
−0.96 −0.94 45 <0.0001 <0.0001
Between cumulative balance value and cumulative temper-ature value during 1972–1985
−0.69 −0.6 14 0.006 0.0025
Between cumulative balance value and cumulative temper-ature value during 1986–2004
HESSD
4, 3395–3412, 2007 Response of “Glacier-Runoff” system Zongxing Li et al. Title Page Abstract Introduction Conclusions References Tables Figures ◭ ◮ ◭ ◮ Back CloseFull Screen / Esc
Printer-friendly Version
Interactive Discussion
EGU
HESSD
4, 3395–3412, 2007 Response of “Glacier-Runoff” system Zongxing Li et al. Title Page Abstract Introduction Conclusions References Tables Figures ◭ ◮ ◭ ◮ Back CloseFull Screen / Esc
Printer-friendly Version
Interactive Discussion
EGU
Figure 2. Variations of annual mean temperature in Northern Hemisphere and China over the p Fig. 2. Variations of annual mean temperature in Northern Hemisphere and China over the
HESSD
4, 3395–3412, 2007 Response of “Glacier-Runoff” system Zongxing Li et al. Title Page Abstract Introduction Conclusions References Tables Figures ◭ ◮ ◭ ◮ Back CloseFull Screen / Esc
Printer-friendly Version
Interactive Discussion
EGU
Figure 3. The relationship between mass balance variation in Hailuogou basin and the annual
﹤ ﹤
Fig. 3. The relationship between mass balance variation in Hailuogou basin and the annual
mean temperature variation (a stands for China, b stands for the Northern Heimsphere).
HESSD
4, 3395–3412, 2007 Response of “Glacier-Runoff” system Zongxing Li et al. Title Page Abstract Introduction Conclusions References Tables Figures ◭ ◮ ◭ ◮ Back CloseFull Screen / Esc
Printer-friendly Version
Interactive Discussion
EGU
℃
℃
Figure 4. variation of ablation amount in Hailuogou glacier tongue(a); variation of mean annual
Fig. 4. Variation of ablation amount in Hailuogou glacier tongue (a); variation of mean annual
runoff in Hailuogou basin (b); variation of annual mean temperature in China since 1988 (c); variation of annual mean temperature in the Northern Heimsphere since 1988 (d); variation of annual mean temperature in the 3000 m Meteorological Station since 1988 (e): Mass balance Variation of Hailuogou basin (f).
HESSD
4, 3395–3412, 2007 Response of “Glacier-Runoff” system Zongxing Li et al. Title Page Abstract Introduction Conclusions References Tables Figures ◭ ◮ ◭ ◮ Back CloseFull Screen / Esc
Printer-friendly Version
Interactive Discussion
EGU
℃
Figure 5. Seasonal variation between precipitation and runoff in Hailuogou b Fig. 5. Seasonal variation between precipitation and runoff in Hailuogou basin.