i
UNIVERSITÉ DE SHERBROOKE
Faculté de génie
Département de génie mécanique
Simulation CFD et analyse des flux exergétiques de dispositifs
pour l'expansion de CO
2supercritique afin d'améliorer la performance
énergétique du système de pompe à chaleur
CFD simulation and exergy flow analysis inside devices for
expansion of supercritical CO
2streams to improve the energy
performance of a heat pump system
Thèse de doctorat
Spécialité : Génie Mécanique
ABBAS AGHAGOLI
Sherbrooke (Québec) Canada
November 2020
Jury: Prof. Mikhail Sorin (directeur) Prof. Dahai Qi (rapporteur) Prof. Hachimi Fellouah (examinateur)
RÉSUMÉ
Les cycles de pompes à chaleur sont largement utilisés dans des applications résidentielles et commerciales dans le monde entier grâce à ses avantages attrayants d'une efficacité énergétique élevée, de sa fiabilité et ses impacts environnementaux. Le souci d'économie d'énergie continue d'augmenter en raison du coût de l'énergie et de la réduction des sources de combustibles fossiles. En outre, les pompes à chaleur sont capables de fonctionner une multitude des sources de chaleur. Le grand potentiel d'économie d'énergie d’une pompe à chaleur a attiré beaucoup d'attention et de nombreux chercheurs ont tenté d'améliorer son efficacité globale. Malgré le rendement énergétique élevé de pompe à chaleur, il y a un problème concernant les énormes pertes d'exergie ou l'irréversibilité lors du processus isenthalpique d’expansion dans la vanne de détente. Il y a plusieurs équipements destinés à la diminution de ces pertes d'exergie, tels que : des éjecteurs, des tubes vortex, etc.; Cependant, le problème réside dans l’intégration et le dimensionnement optimals de ces équipements à l’intérieur des pompes à chaleur.
L'objectif principal du présent projet est d'introduire une nouvelle configuration de pompe à chaleur au CO2 supercritique afin de maximiser l'efficacité thermique du cycle due à la
réduction des irréversibilités à l’intérieur du dispositif de détente. L'énergie est une quantité conservée, ce qui signifie qu'elle ne peut pas être détruite ou créée, mais l'exergie est la caractéristique de la qualité d'énergie qui n’est pas conservée. La présente recherche propose deux dispositifs d'expansion différents à savoir, le Tube à vortex et la turbine Tesla qui sont employés sur le système de pompe à chaleur qui permettent de réduire les pertes d'exergie comparées au processus de détente isenthalpique. Les principaux composants de ces pompes à chaleur au CO2 sont: le compresseur, le refroidisseur de gaz, l'évaporateur, le tube vortex ou la
turbine Tesla. La première étape de travail est la simulation de la dynamique des fluides par calcul (CFD) du tube vortex et de la turbine Tesla en basant sur des différentes conditions aux limites d'entrée et de sortie qui sont les conditions de sortie du refroidisseur de gaz et les conditions d'entrée de l'évaporateur respectivement. L'étape suivante consiste à extraire les résultats CFD et à les importer comme les données initiales à la modélisation du cycle de la pompe à chaleur. La troisième étape consiste à appliquer la première et la deuxième loi de thermodynamique et maximiser le coefficient de performance (COP) et l'efficacité exergétique du cycle via la réduction des irréversibilités de détente.
L'approche a été tout d'abord appliquée au tube vortex CO2 basse pression dans lequel la
pression d'entrée a été choisie de 1,3 MPa. Les résultats ont démontré que le tube vortex à CO2
est capable de produire deux flux dans lesquels un flux qui est évacué au centre du tube vortex à une température inférieure à la température d'entrée et un second flux qui se déplace en périphérie et extrait loin de l'entrée à une température plus élevée. Il a été démontré qu'une
iii
pression d'entrée plus élevée produit une différence de température plus élevée. Ensuite, l'approche utilisait le tube vortex de CO2 haute pression dans lequel la pression d'entrée était
supérieure à la pression critique de CO2 (7,37 MPa). Les résultats ont montré qu'en raison de la
faible vitesse d'entrée dans le tube vortex, il ne fonctionne pas dans une situation idéale et en raison de la présence de la phase liquide dans le tube vortex. En conséquence, la séparation d'énergie diminue rapidement à mesure que la qualité de la vapeur diminue. La troisième approche consistait à intégrer la turbine Tesla dans la pompe à chaleur en tant que dispositif d'expansion. L'analyse numérique de la turbine Tesla aux différentes pressions d'entrée et de sortie a été conduite pour évaluer l’impact sur l'efficacité exergétique transitoire et la perte exergétique de la turbine Tesla et sur l'efficacité globale du cycle de la pompe à chaleur. Les résultats ont montré que la turbine Tesla peut améliorer le COP du système de pompe à chaleur jusqu'à 16,3%.
ABSTRACT
The heat pumps cycles have been used in residential and commercial application throughout the world due to the attractive advantages of high energy efficiency, reliability, and environmental impacts. The concern on energy-saving continues to rise due to the cost of energy and reducing the sources of fossil fuel. Besides, the heat pump systems are capable of working under various heat sources. The great potential of energy saving of the heat pump system has attracted much attention and many researchers have been attempting to improve its overall efficiency. Despite the high energy efficiency, there is an issue regarding the enormous exergy losses or irreversibility during the isenthalpic process in the expansion valve. There are several pieces of equipment intended to reduce these exergy losses, such as: ejectors, vortex tubes, etc.; however, the problem lies in the optimal integration and sizing of this equipment inside the heat pumps.
The main objective of this project is to introduce a new configuration of supercritical CO2 heat
pump system in order to maximize the thermal efficiency of the cycle due to the reduction of irreversibilities inside the expansion device. Energy is a conserved quantity, which means that it cannot be destroyed or created, but exergy is the characteristic of the quality of energy that is not consumed. The present research proposes to investigate the use, in the heat pump system, of two different expansion devices namely, the vortex tube and the Tesla turbine The main components of these CO2
heat pumps are: the compressor, gas cooler, evaporator, vortex tube, or Tesla turbine. The first step is the simulation of computational fluid dynamic (CFD) of the vortex tube and Tesla turbine based on different inlet and outlet boundary conditions which are the outlet conditions of the gas cooler and the entry conditions of the evaporator, respectively. The next step is to extract the CFD results and import them as the initial data for modeling the heat pump cycle. The results of the CFD modeling of the second step will be imported into the heat pump system as inputs. The third step is applying the first and second laws of thermodynamics and analyzing the coefficient of performance (COP), exergy efficiency, and irreversibilities.
Applying the numercial analysis for the proposed expansion device was, first, applied to the low-pressure CO2 vortex tube in which the inlet pressure was chosen 1.3 MPa. The results indicates that the
CO2 vortex splits the inlet stream into two main streams. One stream is discharged at the center of the
vortex tube has a temperature lower than the inlet temperature and second flow that moves peripherally and extracts far from the inlet has the higher temperature. It was depicted that higher inlet pressure produces a higher temperature difference. Afterward, the approach was employing the high-pressure CO2 vortex tube in which the inlet pressure was higher than the critical pressure of CO2 (7.37 MPa). The
results showed that due to low inlet velocity in the vortex tube, the vortex tube doesn’t work in an ideal situation and due to the presence of the liquid phase in the vortex tube. Therefore, the energy separation diminishes rapidly as the quality of the vapor decreases. The third approach was integrating the Tesla turbine in the heat pump system as an expansion device. The numerical analysis of the Tesla turbine at different inlet and outlet pressures is investigated on the transiting exergy efficiency and exergy loss of the Tesla turbine and overall efficiency of the heat pump cycle. The results showed that the Tesla turbine can improve the COP of the heat pump system by up to 16.3%.
v
v
ACKNOWLEDGMENTS
Throughout the writing of this dissertation I have received a great deal of support and assistance.
I would first like to thank my supervisor, Professor Mikhail Sorin for providing guidance and feedback throughout this project
I would like to extend my sincere thanks to my committee member, Dr. Etienne Saloux, Prof. Dahai Qi and Prof. Hachimi Fellouah.
I take this opportunity to express gratitude to all of my colleagues and friends.
In addition, I would like to thank my parents and my brother for supporting me spiritually throughout my life. You are always there for me.
Finally, I could not have completed this dissertation without the support of my beloved wife, Forouzan Kazemi.
vi RÉSUMÉ ... ii ABSTRACT ... iv ACKNOWLEDGMENTS ... v TABLE OF CONTENTS ... vi LIST OF FIGURES ... xi
LIST OF TABLES ... xiv
1 Chapter 1 ... 1 INTRODUCTION ... 1 1-1 Motivation ... 1 1-2 Objectives ... 1 1-3 Thesis outline ... 2 2 Chapter 2 ... 4
STATE OF THE ART ... 4
2-1 Heat pump system ... 4
2-2 Heat pump system modification ... 5
2-2-1 Ejector expansion device ... 6
2-2-2 Vortex tube expansion device ... 7
2-2-3 Work Recovery Expansion device ... 9
2-3 Refrigerant ... 10
3 Chapter 3 ... 13
TABLE OF CONTENTS
vii
3-1 Abstract ... 14
3-2 Introduction ... 15
3-3 Mathematical modeling ... 18
3-3-1 Governing equations of CFD modeling ... 18
3-3-2 Boundary conditions ... 19
3-3-3 Mesh ... 20
3-3-4 Grid independency ... 22
3-3-5 Validation ... 22
3-4 Thermodynamic model of the vortex tube ... 23
3-4-1 Cold and hot exit temperature difference ... 24
3-4-2 Efficiencies of the vortex tube system based on the first thermodynamics law 24 3-4-3 Exergy efficiency ... 25
3-5 Results and discussion ... 27
3-6 Conclusions ... 49
3-7 Acknowledgments... 49
3-8 Nomenclature ... 50
4 Chapter 4 ... 52
3D CFD modelling and exergy loss minimization within a high-pressure vortex tube .... 52
4-1 Abstract ... 53
4-2 Introduction ... 54
4-3 Mathematical modelling ... 56
4-3-1 Governing equations of CFD modelling ... 56
viii
4-3-3 Fluid Property Table ... 59
4-3-4 Mesh independency and validation ... 60
4-4 Exergy analysis ... 62
4-4-1 Exergy loss and transiting exergy efficiency ... 62
4-4-2 Local entropy generation ... 64
4-5 Results and discussion ... 65
4-6 Conclusion ... 73
4-7 Acknowledgments... 74
4-8 Nomenclature ... 74
5 Chapter 5 ... 76
Thermodynamic analysis of a novel transcritical CO2 vortex tube heat pump cycle ... 76
5-1 Abstract ... 77
5-2 Introduction ... 78
5-3 System description ... 79
5-4 Mathematical simulation ... 80
5-5 Results and Discussion ... 81
5-6 Conclusion ... 84
5-7 Nomenclature ... 84
6 Chapter 6 ... 86
CFD modeling and exergy analysis of a heat pump cycle with Tesla Turbine using CO2 as a working fluid ... 86
6-1 Abstract ... 87
6-2 Introduction ... 88
TABLE OF CONTENTS
ix
6-3-1 Internal-external exergy losses and exergy efficiency of Tesla turbine. ... 92
6-4 CFD model ... 94
6-4-1 Fluid Property Table ... 94
6-4-2 The shear stress transport model ... 97
6-4-3 Boundary conditions ... 97
6-4-4 Mesh and grid independency ... 100
6-4-5 Model validation ... 100
6-5 Thermodynamic analysis ... 101
6-5-1 Flow coefficient and isentropic efficiency of the Tesla turbine ... 102
6-5-2 The effect of rotor angular velocity on Tesla turbine exergy losses at constant inlet and outlet pressures ... 104
6-5-3 The effect of inlet and outlet pressures on Tesla turbine exergy losses at constant angular velocity ... 110
6-5-4 The effect of inlet and outlet pressures on transiting exergy efficiency of the turbine at different rotor angular velocity ... 111
6-5-5 The effect of inlet and outlet pressures on COP of the heat pump cycle at different rotor angular velocities ... 112
6-5-6 Comparison of a cycle with an expansion valve and a cycle integrated with a Tesla turbine 114 6-6 Conclusions ... 115
6-7 Acknowledgments... 116
6-8 Nomenclature ... 116
7 Chapter 7 ... 118
CONCLUSION AND FUTURE VIEW ... 118
x
Travail futur et perspective ... 119
Thesis conclusions ... 119
Future work and perspective ... 120
xi
LIST OF FIGURES
Figure 2-1. The schematic of heat pump [5]. ... 4
Figure 2-2. P–h diagrams showing: (a) subcritical cycle and (b) transcritical cycle. ... 5
Figure 2-3. Schematic of an ejector. ... 6
Figure 2-4. (a) The schematic and (b) P-h diagram of transcritical CO2 ejector heat pump system. ... 7
Figure 2-5. The schematic of vortex tube. ... 8
Figure 2-6. (a) The schematic and (b) P-h diagram of transcritical CO2 vortex tube heat pump system. ... 9
Figure 2-7. The schematic of Tesla turbine. ... 10
Figure 3-1. Flow pattern and schematic diagram of vortex tube (Dutta et al. 2013). ... 16
Figure 3-2. The geometry of EXAIR model 3202. ... 20
Figure 3-3. 3D CFD model of vortex tube. ... 22
Figure 3-4. Comparison of CFD results with experimental results and hot exit results are shown in the upper part of the figure, with solid markers, while the cold exit results are in the low part. ... 23
Figure 3-5. Effect of inlet pressure and cold mass fraction on cold exit temperature difference. ... 28
Figure 3-6. Effect of inlet pressure and cold mass fraction on hot exit temperature difference. ... 29
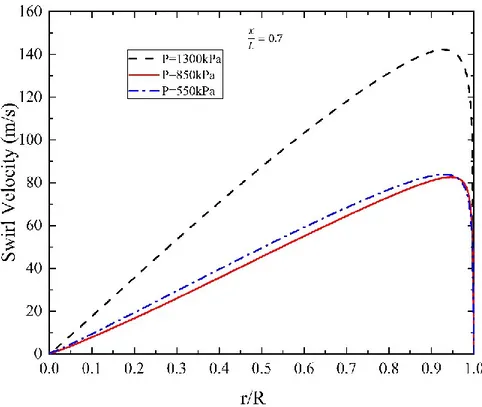
Figure 3-7. Radial profile of swirl velocity for inlet pressure 550, 850 and 1300kPa and dimensionless axial locations (x/ L) 0.1, 0.4 and 0.7. ... 31
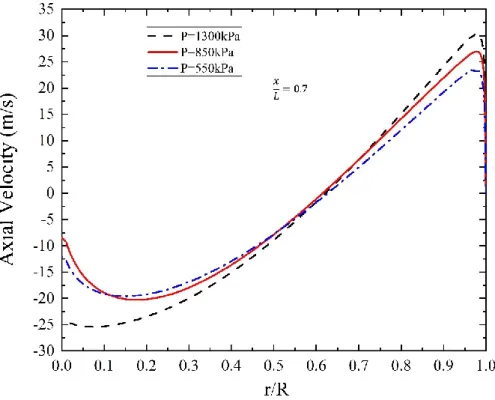
Figure 3-8. Radial profile of axial velocity for inlet pressure 550, 850 and 1300kPa and dimensionless axial locations (x/ L) .1, 0.4 and 0.7. ... 33
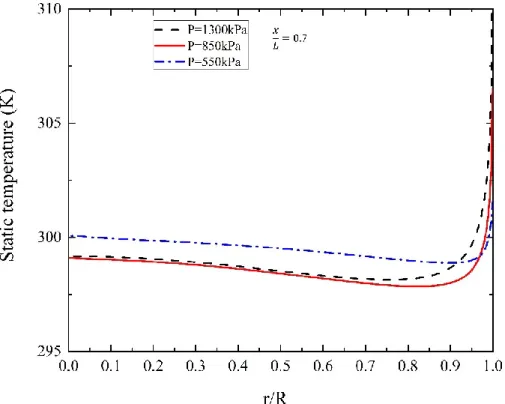
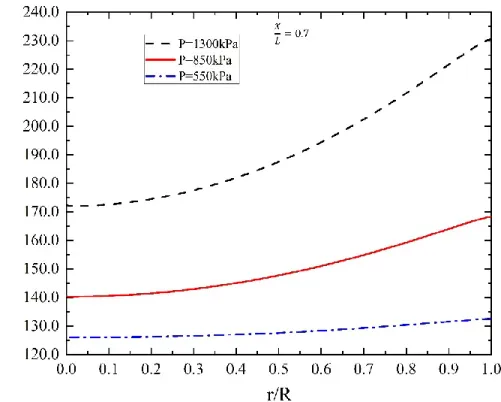
Figure 3-9. Radial profile of static temperature for inlet pressure 550, 850 and 1300kPa and dimensionless axial locations (x/ L) 0.1, 0.4 and 0.7. ... 35
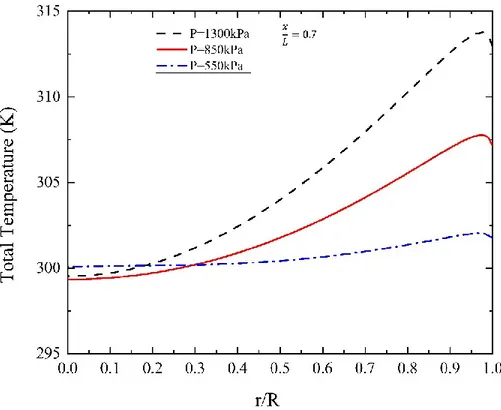
Figure 3-10. Radial profile of total temperature for inlet pressure 550, 850 and 1300kPa and dimensionless axial locations (x/ L) 0.1, 0.4 and 0.7. ... 38
xii
Figure 3-11. Radial profile of static pressure for inlet pressure 550, 850 and 1300kPa and dimensionless axial locations (x/ L) 0.1, 0.4 and 0.7. ... 40
Figure 3-12. Radial profile of total pressure for inlet pressure 550, 850 and 1300kPa and dimensionless axial locations (x/ L) 0.1, 0.4 and 0.7. ... 42
Figure 3-13. Radial profile of turbulence kinetic energy for inlet pressure 550, 850 and 1300kPa and dimensionless axial locations (x/ L) 0.1, 0.4 and 0.7. ... 44
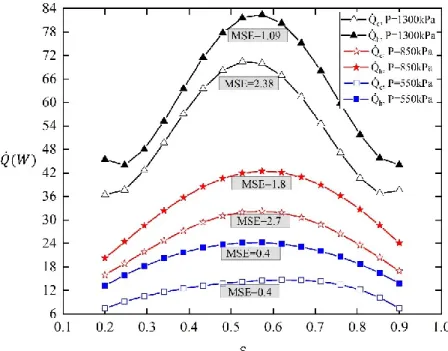
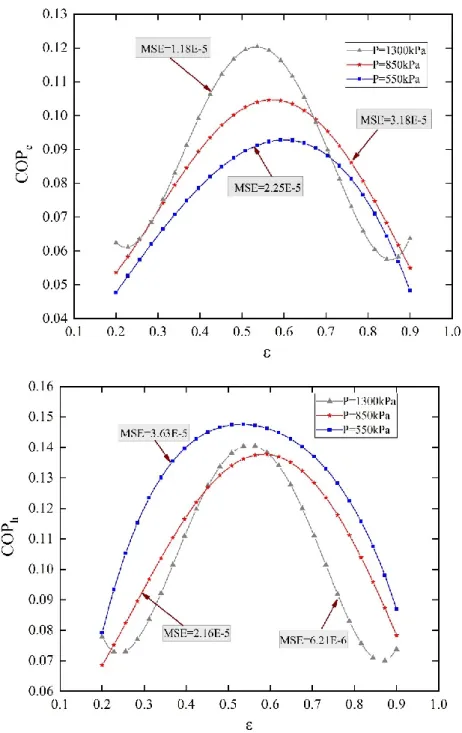
Figure 3-14. Effect of inlet pressure and cold mass fraction on cooling and heating powers. ... 45 Figure 3-15. The effect of inlet pressure and cold mass fraction on a: COPc, b: COPh. .. 46 Figure 3-16. Effect of inlet pressure and cold mass fraction on exergy efficiency. ... 48 Figure 4-1. Vortex tube geometry. ... 58 Figure 4-2. The isobaric specific heat of CO2 as a function of pressure and temperature.60
Figure 4-3. Structural mesh of the vortex tube. ... 61 Figure 4-4. Variation of the pressure along the vortex tube for different numbers of cells. ... 62 Figure 4-5. The radial profile of the axial and swirl velocities at different vortex tube locations and different inlet pressures (a) 9 MPa and (b) 11 MPa... 66
Figure 4-6. The radial profile of the temperature and pressure at three different inlet pressures at x/L = 0.9 and α = 0.9. ... 68
Figure 4-7. Outlet exergy and exergy loss of the vortex tube. ... 69 Figure 4-8. The transiting exergy efficiency and transiting exergy of the vortex tube. .... 70 Figure 4-9. The streamline of the high pressure CO2. ... 71
Figure 4-10. The Bejan number at different vortex tube length. ... 73 Figure 5-1. Schematic diagram of proposed CO2 vortex tube heat pump cycle. ... 80
Figure 5-2. The effect of the hot exit pressure on the COP of the vortex tube heat pump. ... 82 Figure 5-3. The effect of the hot exit pressure on the heat load of evaporator and gas cooler of the vortex tube heat pump. ... 83
xiii
Figure 6-1. Schematic (a) and temperature-entropy diagram (b) of the heat pump cycle
integrated with the Tesla turbine. ... 92
Figure 6-2. Specific heat at constant pressure for CO2 as a function of pressure and temperature. ... 95
Figure 6-3. P-T diagram for CO2. ... 96
Figure 6-4. The geometry of the Tesla turbine (Stator and Rotor). ... 99
Figure 6-5. The Tesla turbine structural mesh. ... 100
Figure 6-6. The flow chart of the heat pump analysis. ... 102
Figure 6-7. The Flow coefficient and isentropic efficiency. ... 103
Figure 6-8. The velocity triangle and H-s diagram of the Tesla turbine. ... 103
Figure 6-9. The effect of inlet and outlet pressures on exergy losses of the semi-ideal heat pump cycle at different rotor angular velocities. ... 104
Figure 6-10. The effect of inlet and outlet pressures on exergy losses of the real heat pump cycle at different rotor angular velocities. ... 105
Figure 6-11. Effect of inlet and outlet pressures on torque at different rotor angular velocities. ... 106
Figure 6-12. Mach number contours at the zone between disks 2 and 3 of Tesla turbine at (a)100 rad/s, (b)500 rad/s, (c)1000 rad/s, (d)1500 rad/s, and (e)2000 rad/s. ... 108
Figure 6-13. Effect of inlet and outlet pressures on Tesla turbine power at different rotor angular velocities. ... 108
Figure 6-14. Effect of inlet and outlet pressures on outlet vapor quality at different rotor angular velocities. ... 109
Figure 6-15. Effect of inlet and outlet pressures on Tesla turbine transiting exergy efficiency at different rotor angular velocities. ... 112
Figure 6-16. The effect of inlet and outlet pressures on COP of the semi-ideal heat pump cycle at different rotor angular velocities. ... 113
Figure 6-17. The effect of inlet and outlet pressures on COP of the real heat pump cycle at different rotor angular velocities. ... 114
xiv
LIST OF TABLES
Table 2-1. Environmental data of some refrigerants. ... 11
Table 4-1. Vortex tube dimensions. ... 58
Table 4-2. CFD validation against the experimental results. ... 61
Table 4-3. Variation in exergy metrics with the cold mass fraction for a vortex tube. ... 70
Table 5-1. Operating conditions for the vortex tube heat pump cycle. ... 81
Table 6-1. The relative error of the CO2 properties. ... 96
Table 6-2. The boundary condition of the Tesla turbine. ... 99
Table 6-3. The Tesla turbine design dimensions [116]. ... 99
Table 6-4. The Tesla turbine CFD validation. ... 101
Table 6-5. Vapor quality at the exits of the Tesla turbine and the expansion valve, and COP. ... 115
1
1
Chapter 1
INTRODUCTION
1-1 Motivation
The high energy consumption and serious pollution from the fuels burning for buildings heating have drawn increasing attention, with the goal of alleviating these problems. In addition, the Montreal Protocol is widely considered as the most successful environment protection agreement, banned the usage of the CFC (chlorofluorocarbon) and HCFC (hydrochlorofluorocarbon) refrigerants which are harmful to the environment. The global warming potential (GWP) of the HFC gases are high [1]. Typically, a release of one kilogram of an HFC gas contributes 1000–3000 times more to global warming, than the release of one kilogram CO2 [2]. Consequently, there has been a noticeable increase in interest in the
applications of the transcritical CO2 heat pump system.
In a transcritical heat pump, heat rejection is not limited by the critical temperature, which leads to higher performance. However, the most important cause of the thermodynamic imperfection of a transcritical heat pump cycle is the large exergy destruction within a throttling valve due to the refrigerant passing from the supercritical state (80–120 bar) to the subcritical state (30–40 bar). In other words, the greater pressure difference between the gas cooler and the evaporator causes important exergy losses due to expansion. One key approach to improve the performance of a heat pump cycle is to recover part of these throttling losses by producing useful work.
1-2 Objectives
So far, the ejector has been introduced as an expansion device for the heat pump system. However, due to presence of second phase inside the ejector, the performance of the ejector drops rapidly. The main objective of the project is to introduce a new expansion device to
2
replace an expansion valve in order to reduce the throttling loss within a heat pump system. This general objective includes the following specific points:
Find an alternative to partially recover the throttling losses Conduct CFD simulations of the expansion devices
Conduct of thermodynamic analysis of the expansion devices and their comparison in terms of exergy based metrics
Integrating the Tesla turbine and vortex tube into the heat pump system and analyzing the conditions to maximize the COP of a novel heat pump system
This study proposes a novel transcritical heat pump system which focuses on the exergy loss during the expansion process. The approach is accomplished with two steps: finding a new expansion device and analyzing the heat pump system with the integration of a new expansion device. In the first step, two new expansion devices are proposed which are the vortex tube and the Tesla turbine. The CFD simulation analysis was carried out based on the proper turbulence model. The boundary conditions of the proposed expansion devices were fixed based on the gas cooler and evaporator pressures. The second law of thermodynamics was applied to find the expansion device with lower exergy losses or higher exergy efficiency. Then the chosen expansion device was integrated with the heat pump system to evaluate the performance of the candidate expansion device of the heat pump system based on the exergy efficiency and COP. The approach is, first, applied to the vortex tube as a first candidate and the energy separation of the vortex tube is illustrated. Afterward, the approach is developed on the Tesla turbine. In this study, the performance of the expansion devices is evaluated based on the first and second laws of Thermodynamics.
1-3 Thesis outline
The present thesis contains seven chapters. In Chapter 2, an extensive literature review on the development of the heat pump system is provided. Chapter 3 is devoted to the CFD simulation of the low-pressure vortex using CO2 as a real gas. The effect of inlet pressure is
investigated on the temperature separation inside the vortex tube. Chapter 4 investigates the CFD simulation of the high-pressure vortex tube with two-phase CO2 where the inlet pressure
3
is chosen based on the gas cooler pressure. The effect of inlet pressure is investigated on the exergy loss of the vortex tube. Chapter 5 analyzes the heat pump system integrated with the vortex tube to partially recover the throttling losses. Moreover, the effect of gas cooler pressure on the COP of the transcritical vortex tube heat pump system is investigated. Chapter 6 illustrates the CFD simulation of the Tesla turbine, working with CO2 as real working fluid.
Moreover, the effect of inlet and outlet pressures are investigated on the transiting exergy efficiency of the Tesla turbine and COP of the heat pump system integrated with the Tesla turbine. Finally, conclusions are presented in Chapter 7.
4
2
Chapter 2
STATE OF THE ART
This chapter is devoted to an extensive review of studies conducted by previous researchers on the expansion device and heat pump system analysis.
2-1 Heat pump system
The increasing worldwide energy consumption, global warming effect, and the cost of fossil fuel at the forefront of world attention, the heat pump systems have gained much attention in the past decades [3,4]. The heat pump is able to reuse the waste heat back into a heat production process and the application of heat pump in domestic and commercial buildings are drastically popularized [1]. The schematic of the heat pump is illustrated in Figure 2-1.
Figure 2-1. The schematic of heat pump [5].
In a heat pump cycle either subcritical or transcritical cycle, the heat absorption takes place in the evaporator and the saturated vapor of refrigerant leaves the evaporator and enters the compressor. During the isentropic process in the compressor, the temperature and pressure of the refrigerant increase. In a traditional heat pump, the cycle works under the critical point of
5
the used refrigerant. The heat rejection occurs in the condenser and the refrigerant isobarically cools as it passes through the condenser when the hydraulic losses are neglected. However, in a transcritical heat pump, the heat rejection takes place in a gas cooler by single-phase sensible cooling and the refrigerant isobarically cools as it passes through the gas cooler [6]. Finally, during the isenthalpic process, the pressure and temperature of the cooled refrigerant decrease in the expansion valve. Figure 2-2 presents the P-h diagrams of the subcritical and transcritical heat pump system.
(a) (b)
Figure 2-2. P–h diagrams showing: (a) subcritical cycle and (b) transcritical cycle. The heat rejections in the gas cooler and condenser are by sensible cooling and condensing process so the temperature difference in the gas cooler is greater than the condenser. Hence, the transcritical heat pump is more efficient than the subcritical heat pump.
2-2 Heat pump system modification
The heat pump system has become the main energy-efficient system in many industrial and domicile applications so many researches have been carried out to improve the overall efficiency of the heat pump system. The throttling loss in the heat pump system during the isenthalpic process reduces the efficiency of the heat pump because no useful power can be produced in the expansion process. This loss is small in the subcritical heat pump due to lower pressure difference however, the pressure difference in the transcritical cycle is high which leads to higher loss .
6
Several types of expansion process modifications have been proposed to improve the heat pump system efficiency.
2-2-1 Ejector expansion device
The ejector, which is the heart of the jet refrigeration system was invented by Sir Charles Parsons around 1901 for removing air from a steam engine’s condenser [7]. The ejector has been used in different applications, such as expansion work recovery and utilization of low-grade energy. The ejector has received much attention as expansion due to its simple construction, low maintenance cost, and no moving parts. Figure 2-3 shows a schematic of an ejector that consists of a motive nozzle, suction nozzle, mixing section, and diffuser. High pressure working gas enters the primary nozzle of the ejector where its pressure decreases and the velocity increases. The secondary working fluid enters the suction nozzle and the primary and secondary fluids combine in the mixing chamber of the ejector. Finally, at the diffuser, the velocity of working gas reduces, and the pressure increases.
Figure 2-3. Schematic of an ejector.
The ejector was proposed to recover the expansion work in the vapor compression refrigeration system in 1931 [8] and since then it has gained increasing attention on the ejector transcritical CO2 heat pump cycle. The schematic and P-h diagram of the transcritical CO2
7
(a) (b)
Figure 2-4. (a) The schematic and (b) P-h diagram of transcritical CO2 ejector heat pump system. Li and Groll [10] studied the effect of the ejector on the COP of the transcritical heat pump system and compared it with the basic heat pump system at different operating conditions. Their results showed that the ejector can improve the COP of the heat pump up to 16%. Taslimi taleghani and et al. [11] analyzed the ejector geometrical parameters on the COP of the heat pump system. Their findings indicated that the primary nozzle throat diameter has a significant impact on the performance of the heat pump system. In addition, they concluded that the highest ejector efficiency occurred at a pressure lower than the optimum gas cooler pressure.
The ejector decreases the expansion losses and also increases the pressure at the inlet of the compressor, so the compressor required power decrease. However, the two-phase ejector cycles have not experienced large-scale commercialization [12]. In addition, due to presence of second phase inside the ejector, the performance of the ejector drops rapidly. Also, when the pressure of the primary flow is high, the ejector efficiency and entrainment ratio are lower.
2-2-2 Vortex tube expansion device
The vortex tube, also known as the Ranque-Hilsch vortex tube is a device that can produce both hot and cold streams, simultaneously. The schematic of the vortex tube is illustrated in Figure 2-5. The vortex tube was discovered in 1931 by a French physicist Georges J. Ranque. Even though there have been many studies regarding the understanding of the energy separation
8
inside the vortex tube but this phenomenon is still unknown. Vortex Tubes can be used in a variety of industrial processes such as the cooling system for a drill bit, air suit, gas separation, etc. [13]. Majority of studies focused on the energy separation in the vortex tube and attempted to raise the temperature difference numerically and experimentally [14–16]. Lagrandeur et al [17] analysed the exergy efficiency of the vortex tube using air as a working gas. Their results showed that the friction is the main cause of the exergy loss and by employing the second vortex tube, the exergy efficiency increases up to 4.4%. Moreover, it was introduced as an expansion device in a heat pump system to reduce expansion losses [18]. In contrast to the vortex tube, ejector-expansion devices have been successfully commercialized. In addition, all studies,regarding the integration of the vortex tube with the heat pump system, have been done based on one dimensional thermodynamic analysis of vortex tube which the energy separation hasn’t been analyzed. The schematic and P-h diagram of the transcritical CO2 vortex tube heat
pump system is shown in Figure 2-5.
9
Figure 2-6. (a) The schematic and (b) P-h diagram of transcritical CO2 vortex tube heat pump system.
2-2-3 Work Recovery Expansion device
The performance of the basic heat pump system can be improved by reducing the expansion losses of the transcritical heat pump system during the isenthalpic process. In a transcritical CO2 cycle, the higher pressure difference leads to higher expansion losses, thus
making work recovery beneficial. There are many devices that can potentially be used as a work recovery expansion device in a transcritical heat pump system such as piston expander, Scroll expander, etc. The researchers estimate the potential improvement of energy efficiency to be 20% to 50% [19,20]. Nevertheless, in recent years, many researchers have attempted to reduce the expansion losses of transcritical CO2 by using work recovery but none of these designs have
been commercialized due to the presence of two-phase flow and technically it is difficult and also costly to design the two-phase expander. Besides, the one dimensional thermodynamic analysis of the expander has been investigated which the effect of rotor speed on the torque production hasn’t been analysed.. Thus, the Tesla turbine which is known as a bladeless turbine could be an interesting expansion device. The schematic of the Tesla turbine is presented in Figure 2-7.
10
Figure 2-7. The schematic of Tesla turbine.
The Tesla turbine was patented in 1913 by Tesla [21] but due to its low efficiency in comparison with traditional turbine, it was abandoned. However, manufacturing the Tesla turbine is easier and production costs for disks are much lower than for blades. In addition, the Tesla turbine is capable to work with wide range of fluids such as two-phase, very viscous fluid or non-Newtonian fluid and etc. however it was abandoned due to its low efficiency and performance in comparison to traditional turbomachinery. Song et al. [22] introduced the Tesla turbine as a small expander due to its simplicity and low capital cost. There are few numerical and experimental studies which focused on the flow analysis in the Tesla turbine [23–25].
2-3 Refrigerant
Refrigerants play an important role in human life and they have been widely used in many industrial and residential applications such as refrigerator, air conditioner, etc. Since the invention of the vapor-compression in 1834 by Evans and Perkins, CO2 has been a candidate
for a refrigerant and due to its interesting future such as no flammability and low toxicity CO2
was widely used in marine systems in the twentieth century [6]. However, CO2 phased out due
to the arrival of synthetic refrigerants, high cost of the component, sealing difficulty due to high pressure [1,26] and the synthetic refrigerants such as R22 and R12 have unique properties such
11
as low critical pressure with no toxicity and no flammability but have adverse effects on the environment. The studies indicated that some refrigerants are harmful to the environment and have a great impact on damaging the Ozone layer. Therefore, in 1987, the Montreal Protocol was adopted to reduce and phase-out of ozone-depleting substances. As Table 2-1 indicates, taking into account the Global Warming potential (GWP), the Ozone Depletion potential (ODP) and other environmental data, CO2 could be an alternative [27].
Table 2-1. Environmental data of some refrigerants.
Refrigerant R12 R600a R410A R134a R22 CO2
Natural fluid No No No No No Yes
ODP 0.82 0 0 0 0.04 0 Critical temperature (°C) 112.0 134.7 71.4 101.2 96.2 31.1 GWP (100 years) 8100 ~20 2100 1300 1500 1 Flammability No Yes No No No No Toxicity No No No No No No
CO2 is a natural refrigerant that is non-toxic, non-flammable with an ozone depletion
potential of zero, and a GWP of 1. The critical temperature of CO2 is 31.1 °C which cannot be
used effectively in a subcritical cycle however, it can be effective in a transcritical cycle. In addition, due to the low viscosity of CO2, the Reynolds number is relatively high which means
the flow is turbulence and causes a good heat transfer rate.
So far, the ejector has been introduced as an expansion device for the heat pump system. However, due to presence of second phase inside the ejector, the performance of the ejector drops rapidly. Also, when the pressure of the primary flow is high, the ejector efficiency and entrainment ratio are lower. The main objective of this study is to find the proper expansion device in order to reduce the losses due to the expansion. Two expansion devices are chosen namely; vortex tube and Tesla turbine. The numerical simulation was carried out on both expansion machines and the data was extracted from the CFD simulation. For the next step, the device was implemented into the heat pump system to evaluate each device capability to reduce
12
the throttling losses. Finally, the performance of the heat pump system was evaluated in term of COP.
13
3
Chapter 3
Thermodynamic Performance of a CO
2Vortex tube
based on 3D CFD flow analysis
Avant-propos
Auteurs et affiliation:
Abbas Aghagoli: étudiant au doctorat, faculté de génie, département de génie mécanique, Université de Sherbrooke.
Mikhail Sorin: professeur, faculté de génie, département de génie mécanique, Université de Sherbrooke.
Date d’acception: 18 août 2019
État de l’acceptation: version finale publiée, Vol 108, pages 124-137 Revue: International Journal of Refrigeration
Titre français: Performance thermodynamique d'un tube vortex de CO2 basée sur l'analyse
de flux CFD 3D
Contribution au document:
Cet article contribue à la thèse en appliquant le CO2 basse pression dans le tube vortex.
Résumé français:
Le tube vortex (VT) est un dispositif mécanique qui peut fournir simultanément chauffage et refroidissement. Dans ce travail, un modèle CFD 3D a été tout d'abord développé pour simuler l’écoulement de CO2 dans un tube vortex, puis il est validé avec des données
14
expérimentales déjà publiées. Le modèle de turbulence supposé k-ε utilise des nœuds hexaédriques structurés générés dans le maillage ANSYS. Seulement 1/6 de la géométrie est nécessaire en raison de la symétrie du VT. Le modèle CFD validé est combiné à un modèle thermodynamique du VT pour compléter une étude paramétrique, où la pression d'entrée (550kPa à 1300kPa) et la fraction massique froide (0,2 à 0,9) sont les paramètres choisis. Les effets sur la séparation d'énergie et les performances du VT ont été présentés. La séparation de flux d’énergie est examinée en termes de différences de température de sortie chaude et de sortie froide, toutes deux en ce qui concerne la température d'entrée du VT. Les performances sont caractérisées par la puissance de refroidissement, la puissance de chauffage et les coefficients de performance énergétique et exergétique. Les résultats numériques montrent que la variation de la fraction massique froide de 0,2 à 0,9, pour une pression d'entrée fixe de 1300 kPa, fait passer la différence de température de sortie chaude de 10 ˚C à 78,9 ˚C, tandis que la différence de température de sortie froide diminue de 44,2 ˚C à 9,7 ˚C.
3-1 Abstract
The vortex tube (VT) is a mechanical device that can simultaneously provide heating and cooling. In this work, a 3D CFD model is first developed to simulate the flow of CO2 within a
vortex tube, and then it is validated with published experimental data. The assumed k-ε turbulence model uses Structured Hexahedral nodes generated in ANSYS Meshing. Only 1/6 of the geometry is required due to the symmetry of the VT. The validated CFD model is combined with a thermodynamic model of the VT to complete a parametric study, where the inlet pressure (550kPa to 1300kPa) and cold mass fraction (0.2 to 0.9) are the chosen parameters. The effects on the VT energy separation and performance are presented. Energy separation is discussed in terms of the hot exit and cold exit temperature differences, both with respect to the VT inlet temperature. Performance is characterized by cooling power, heating power, and both energy and exergy metrics. The numerical results show that the variation of the cold mass fraction from 0.2 to 0.9, for a fixed inlet pressure of 1300 kPa, causes the hot exit temperature difference to rise from 10 ˚C to 78.9 ˚C, while the cold exit temperature difference falls from 44.2 ˚C to 9.7 ˚C.
15
3-2 Introduction
Since the negative effects of chlorofluorocarbons (CFCs) on global warming and Ozone depletion have been recognized, the use of CFCs has been decreasing and scientists have been attempting to find promising substitute refrigerants in order to preserve the environment. Carbon dioxide is considered as a very attractive refrigerant due to its zero ozone depletion potential and low global warming potential [6]. Carbon dioxide has been a potential candidate for refrigeration since the invention of the vapor compression cycle.
Refrigeration plays an important role in industry, hence researchers are looking for new techniques to enhance the efficiency of the systems that require refrigeration. With the rise in global population, industrialisation, and growing worldwide energy consumption, there is a growing interest in the reuse of waste energy. Likewise, there is continuing interest in energy efficiency, as small change in efficiency can have a great impact on energy saving, particularly in devices that are not considered very efficient, such as the vortex tube (VT). The vortex tube was discovered by the French scientist Ranque in 1931 and since then there have been many research works on the performance of vortex tubes [28]. A vortex tube is a device, which simultaneously produces both hot and cold streams from highly compressed gas. Figure 3-1 shows the main parts of the vortex tube which are: a cylinder, inlet nozzle(s), cone valve and cold diaphragm [29]. Compressed air or other fluids is injected through the inlet nozzle(s) tangentially and starts to swirl along the vortex tube. Two streams separately exit the vortex tube. The hot stream, which has a temperature higher than the inlet fluid, swirls peripherally and exits through a cone valve. The cold stream, which has a temperature lower than the inlet fluid, swirls in the centre of the vortex tube and exits through a cold diaphragm.
16
Figure 3-1. Flow pattern and schematic diagram of vortex tube (Dutta et al. 2013).
Even though, it has been nine decades since the invention of the vortex tube, the concept of energy separation phenomena in the vortex tube is not well understood. Published papers in both experiment and numerical studies have considered a variety of parameters while investigating the energy separation in the vortex tube. Hilsch [30] observed that compressed air at 6 atm and 20 ˚C produce 82 ˚C a temperature difference between the cold and hot exits (∆𝑇ℎ𝑐 = ∆𝑇ℎ− ∆𝑇𝑐) due to internal friction between stream layers, and established a constant angular velocity between layers. Ahlborn and Groves [31] carried out an experiment to measure the axial and angular velocities in the vortex tube. They observed that the amount of mass flow rate, which escapes at the cold exit, is less than amount of mass flow rate, which moves back toward the cold exit, which suggested that there is a secondary flow inside the vortex tube. Later, Ahlborn et al. [32] proposed a new idea, whereby the secondary circulation acts as a heat pump which transfers energy from inner layer (near the core) to the outer layer (near the wall). Some numerical research [33] illustrated that the secondary circulation depends on the ratio of cold the part diameter to tube diameter (𝑑𝑐
𝐷). Hundreds of experimental papers used air as a
working gas and investigated different initial condition such as an inlet pressure, cold mass fraction and different vortex tube geometry. Hamdan et al. [34] evaluated the effect of inlet
17
pressure on the temperature difference of the vortex tube for different lengths and diameters. According to their results, with the increasing length of the vortex tube, as long as the stagnation point (a point where inner stream velocity becomes zero) occurs inside the tube, temperature difference increases. An increase in the tube diameter (D) has both an advantage and a disadvantage. On one hand, the angular velocity decreases and leads to lower centrifugal force and finally lower energy separation. On the other hand, the residence time inside the tube is higher, and as a result the energy transfer between layers is improved, what leads to higher energy separation. Gutak [35] carried out an experiment with high pressure air (78 and 88 bar). Based on their experiment, it was concluded that increasing the inlet pressure induces a higher velocity inside the tube, leading in turn to higher energy separation. Xue et al. [36] used a large vortex tube, with a 2000 mm length and 60 mm diameter. They observed the transferring the forced vortex (swirl velocity is directly proportional to the radius (𝑉 ∝ 𝑟)) near centerline to free vortex (swirl velocity is inversely proportional to the radius (𝑉 ∝1
𝑟)) at the hot exit near
the wall because of decreasing the swirling velocity.
Han et al. [37] used R728, R744, R32, R22, R161, R134a as working gases. The initial parameters were an inlet pressure from 0.2 MPa to 1.3 MPa and temperature was 12℃. They proposed that specific heat ratio, kinematic viscosity and thermal conductivity have an important influence on energy separation of the vortex tube; they also illustrated that the isentropic throttling effect on the cold exit of the working gas has a major impact on temperature difference between inlet and cold exit (∆𝑇𝑐). Agrawal et al. [38] experimentally studied the influence of three working fluids (air, nitrogen, and carbon dioxide) on a vortex tube under different inlet pressures (3, 4 and 5 bar) and different length to diameter ratios (12.5, 17.5 and 22.5). Their results showed that carbon dioxide has the highest temperature difference in compare to air and nitrogen. A disadvantage of the experimental approach is the fact that applying some tools, such as a pitot tube to measure the velocity and other turbulent flow characteristics, might interrupt the highly turbulent flow pattern inside the vortex tube. This is why computational fluid dynamic (CFD) modeling helps to understand the flow characteristics. Thakare and Parekh [39] employed the 2D CFD modeling with the standard k − ε turbulence model for a range of inlet pressures (2-5 bar) in both non-isolated and isolated vortex tube.
18
Their results showed that temperature difference is higher for isolated than non-isolated vortex tube. Also, they [40] analyzed the temperature difference for four different working gases (air, N2, CO2 and O2) and their results showed that N2has the highest and CO2 has the lowest energy separation. No validation with experimental data for N2, CO2 and O2 was presented. Rafiee and Sadeghiazad [41] used 3D modeling of a vortex tube with 6 inlet nozzles, using the standard k − ε turbulence model. Pourmahmoud et al [42], and Thakare and Parekh [40] studied the vortex tube with CO2 as the working gas, where the inlet temperature and total mass flow were fixed at 294.2 K and 8.35 𝑔. 𝑠−1. The achieved results, however, are in contrast with
each other for instance where 𝜀 = 0.3, with calculated cold exit temperatures of 246.48 K and 264.2 K, respectively. So far, the ideal gas equation of state has been assumed for the numerical simulation of the vortex tube which the Cp was considered as constant. However, for this study the NIST real gas models in an ANSYS FLUENT session.The REFPROP v7.0 database employs accurate pure-fluid equations of state that are available from NIST.
In the present study, a 3D simulation of the vortex tube is carried out using ANSYS FLUENT 19, and CO2 is chosen as a working gas. The modeling results are validated against
the experimental data of Han et al. [37]. Energy separation is discussed in terms of the hot exit and cold exit temperature differences, both with respect to the VT inlet temperature. Performance is characterized by cooling power, heating power, and both energy and exergy metrics.
3-3 Mathematical modeling
3-3-1 Governing equations of CFD modeling
In this study, a three-dimensional numerical model of the vortex tube has been developed using the standard k − ε turbulence model and flow pattern in the vortex tube can be regarded as in steady state. The mass, momentum and energy equations for compressible turbulent flow in the vortex tube are:
𝜕
19 𝜕 𝜕𝑥𝑗(𝜌𝑢𝑖𝑢𝑗) = − 𝜕𝑝 𝜕𝑥𝑖 + 𝜕 𝜕𝑥𝑗[𝜇 ( 𝜕𝑢𝑖 𝜕𝑥𝑗 + 𝜕𝑢𝑗 𝜕𝑥𝑖 − 2 3𝛿𝑖𝑗 𝜕𝑢𝑘 𝜕𝑥𝑘)] + 𝜕 𝜕𝑥𝑗(−𝜌𝑢́̅𝑖𝑢́̅𝑗) (3-2) 𝜕 𝜕𝑥𝑗[𝜌𝑢𝑖(ℎ + 1 2𝑢𝑖𝑢𝑗)] = 𝜕 𝜕𝑥𝑗[(𝜏𝑖𝑗)𝑒𝑓𝑓𝑢𝑖+ 𝑘𝑒𝑓𝑓 𝜕𝑇 𝜕𝑥𝑗] 𝑘𝑒𝑓𝑓 = 𝜇𝑡 𝑃𝑟𝑡+ 𝐾 (3-3)
Following the recommendations of [40], k − ε turbulence model is chosen for this study. The standard k − ε model falls into the two equation turbulence category, which is based on transport equations for the turbulence kinetic energy (k) and its dissipation rate (ε). Transport equations for the standard k − ε model are as follow:
𝜕 𝜕𝑡(𝜌𝑘) + 𝜕 𝜕𝑥𝑖(𝜌𝑘𝑢𝑖) = 𝜕 𝜕𝑥𝑗[(𝜇 + 𝜇𝑡 𝜎𝑘) 𝜕𝑘 𝜕𝑥𝑗] + 𝐺𝑘+ 𝐺𝑏− 𝜌𝜀 − 𝑌𝑀+ 𝑆𝑘 (3-4) 𝜕 𝜕𝑡(𝜌𝜀) + 𝜕 𝜕𝑥𝑖(𝜌𝜀𝑢𝑖) = 𝜕 𝜕𝑥𝑗[(𝜇 + 𝜇𝑡 𝜎𝜀) 𝜕𝜀 𝜕𝑥𝑗] + 𝐶1𝜀 𝜀 𝑘(𝐺𝑘+ 𝐶3𝜀𝐺𝑏) − 𝐶2𝜀𝜌 𝜀2 𝑘 + 𝑆𝜀 (3-5) Where;
𝐺𝑘: the generation of turbulence kinetic energy due to the mean velocity gradients 𝐺𝑏: the generation of turbulence kinetic energy because of buoyancy
𝑌𝑀: contribution of the fluctuating dilatation in compressible turbulence to the overall dissipation rate
𝜎𝑘 and 𝜎𝜀: the turbulent Prandtl numbers for 𝑘 and 𝜀 respectively 𝑆𝑘 and 𝑆𝜀: user-defined source terms
𝐶1𝜀, 𝐶2𝜀 and 𝐶3𝜀 are constants.
3-3-2 Boundary conditions
The geometry of the model is identical to the vortex tube used in [37] (the EXAIR model 3202), which is shown in Figure 3-2. In the experimental study, 𝐶𝑂2 passed through 6 nozzles with a hot length of 78mm, tube diameter of 9.5mm and cold diameter of 3.5mm which are inner dimensions. In the current CFD modeling the exact model is simulated. However, because vortex tube has a symmetric geometry with 6 inlet nozzles, a 60° sector is modeled for the sake
20
of computational efficiency [43]. The experimental pressures at the nozzle inlet, hot exit and cold exit are applied directly to the CFD model. The no slip condition is assumed for the vortex inner walls and the inlet temperature is constant at 285 K. The simulation is done using the Pressure based Solver with SIMPLE algorithm. The vortex tube model is designed in ANSYS Design Modeler; the structural mesh is generated using ANSYS Meshing; the simulation is carried out in FLUENT.
Figure 3-2. The geometry of EXAIR model 3202.
3-3-3 Mesh
The 3D CFD mesh grid around the nozzle inlet, cold exit, and hot exit is shown in Figure 3-3. In this model a regular organized mesh grid has been used. All radial lines of the meshing model are connected to the centerline and the circuit arcs are regularly constructed from the
21
wall to the centerline. This type of meshing model helps reduce computation time, and the computation procedure is more precise compared to irregular meshing [16].
22
Figure 3-3. 3D CFD model of vortex tube.
3-3-4 Grid independency
Grid independency is important to determine the optimum mesh number, meaning that the solution is independent of the mesh resolution. Therefore, 3D CFD analysis was carried out using different mesh sizes, with 1187994, 1765194, and 2352794 cells. It found that the percentage of cold temperature difference at 1765194 and 2352794 cells are less than 0.5%. Therefore, the 1765194 cell grid is chosen for the simulation. Increasing the number of cells more than 1765194 does not have a significant impact on the results.
3-3-5 Validation
Figure 3-4 shows a comparison of the CFD results with the experimental data [37]. The hot exit results are shown in the upper part of the figure, with solid markers, while the cold exit results are in the low part. As it is obvious for both cold and hot exits, the achieved results from
23
k − ε model are precise and close to experimental results what means that the proposed turbulence model is capable of predicting the precise results.
Figure 3-4. Comparison of CFD results with experimental results and hot exit results are shown in the upper part of the figure, with solid markers, while the cold exit results are in the low part.
3-4 Thermodynamic model of the vortex tube
The performance of the vortex tube relies on three main parameters: cold mass fraction, cold exit temperature difference, and hot exit temperature difference which are extracted from CFD modeling. The exergy efficiency will be applied to evaluate the vortex tube thermodynamic performance due to specific temperature differences, given some nominal information about the vortex tube. In the context of improving worldwide energy efficiency, it is important to analyze the performance of the vortex tube, which has not been considered in many research papers.
The cold mass fraction will be varied from 0 to 1 (0 ≤ 𝜀 ≤ 1) and defines as the ratio of the mass flow rate that is exhausted at the cold exit to the inlet mass flow rate.
24 𝜀 = 𝑚̇𝑐
𝑚̇𝑖𝑛 (3-6)
3-4-1 Cold and hot exit temperature difference
The cold exit temperature difference is defined as the difference between the average temperature at the cold exit and inlet temperature.
∆𝑇𝑐 = |𝑇𝑐 − 𝑇𝑖𝑛| (3-7)
The hot exit temperature difference is defined as the difference between the average temperature at the hot exit and inlet temperature.
∆𝑇ℎ = 𝑇ℎ− 𝑇𝑖𝑛 (3-8)
The first law of thermodynamics states that during an interaction between a system and its surroundings, the amount of energy that the system gains must be exactly equal to the amount of energy lost by the surroundings. The first law of thermodynamics can be written as:
𝐸̇ = ∑ 𝑄̇𝑘− ∑ 𝑊̇𝑘
𝑘 𝑘
(3-9) 𝐸̇ represents the sum of thermal energy, kinetic energy and etc.
Applying the first law on the vortex tube, it follows that
𝑚̇𝑖𝑛𝐶𝑝,𝑖𝑛𝑇𝑖𝑛 = 𝑚̇𝑐𝐶𝑝,𝑐𝑇𝑐 + 𝑚̇ℎ𝐶𝑝,ℎ𝑇ℎ (3-10)
Applying the second law of thermodynamics to the vortex tube with 𝑄̇ = 0, gives
𝑆̇𝑖𝑛− 𝑆̇𝑐− 𝑆̇ℎ− 𝑆̇𝑖𝑟𝑟 = 0 (3-11)
𝑆̇𝑖𝑟𝑟 = 𝑚̇𝑖𝑛𝑠𝑖𝑛− 𝑚̇𝑐𝑠𝑐 − 𝑚̇ℎ𝑠ℎ (3-12)
𝑆̇𝑖𝑟𝑟 = 𝑚̇𝑖𝑛[(1 − 𝜀)(𝑠ℎ− 𝑠𝑖𝑛) + 𝜀(𝑠𝑐− 𝑠𝑖𝑛)] (3-13)
3-4-2 Efficiencies of the vortex tube system based on the first thermodynamics
law
Thermal efficiencies are used to evaluate the cooling and heating power of the vortex tube. The vortex tube can not only be used as a cooler, but also as a heater, so the definition of the
25
efficiency should consider both effects. The cooling and heating powers of the vortex tube, when it acts as a refrigeration system and heat pump, are defined as:
𝑄̇𝑐 = 𝑚̇𝑐𝐶𝑝,𝑐(𝑇𝑖𝑛− 𝑇𝑐) (3-14)
𝑄̇ℎ = 𝑚̇ℎ𝐶𝑝,ℎ(𝑇ℎ− 𝑇𝑖𝑛) (3-15)
The input work power is defined as the work required to compress the gas from the exhaust pressure up to the inlet pressure, using a reversible isothermal compression process [44]:
𝑃 = 𝑚̇𝑖𝑛𝑅𝑇𝑖𝑛𝑙𝑛 (𝑃𝑖𝑛
𝑃𝑐) (3-16)
When the vortex tube acts as a refrigeration system, the coefficient of thermal performance is defined as the cooling power of the vortex tube divided by the input work power.
𝐶𝑂𝑃𝑟𝑒𝑓𝑟𝑖𝑔𝑒𝑟𝑎𝑡𝑖𝑜𝑛 =
𝑄̇𝑐
𝑃 (3-17)
When the vortex tube acts as a heat pump system, the coefficient of thermal performance is defined as the heating power of the vortex tube divided by the input work power.
𝐶𝑂𝑃ℎ𝑒𝑎𝑡 𝑝𝑢𝑚𝑝 = 𝑄̇ℎ
𝑃 (3-18)
3-4-3 Exergy efficiency
The thermomechanical specific exergy of the vortex tube inlet, cold and hot exits are given as [45]: 𝑒𝑖𝑛= [ℎ(𝑃𝑖𝑛, 𝑇𝑖𝑛) − ℎ(𝑃0, 𝑇0)] − 𝑇0. [𝑠(𝑃𝑖𝑛, 𝑇𝑖𝑛) − 𝑠(𝑃0, 𝑇0)] + 𝑉𝑖𝑛2 2 (3-19) 𝑒ℎ= [ℎ(𝑃ℎ, 𝑇ℎ) − ℎ(𝑃0, 𝑇0)] − 𝑇0. [𝑠(𝑃ℎ, 𝑇ℎ) − 𝑠(𝑃0, 𝑇0)] + 𝑉ℎ2 2 (3-20) 𝑒𝑐 = [ℎ(𝑃𝑐, 𝑇𝑐) − ℎ(𝑃0, 𝑇0)] − 𝑇0. [𝑠(𝑃𝑐, 𝑇𝑐) − 𝑠(𝑃0, 𝑇0)] + 𝑉𝑐2 2 (3-21)
26 𝐸̇𝑖𝑛 = 𝑚̇𝑖𝑛([ℎ(𝑃𝑖𝑛, 𝑇𝑖𝑛) − ℎ(𝑃0, 𝑇0)] − 𝑇0. [𝑠(𝑃𝑖𝑛, 𝑇𝑖𝑛) − 𝑠(𝑃0, 𝑇0)]) +𝑚̇𝑖𝑛𝑉𝑖𝑛 2 2 (3-22) 𝐸̇ℎ = 𝑚̇ℎ([ℎ(𝑃ℎ, 𝑇ℎ) − ℎ(𝑃0, 𝑇0)] − 𝑇0. [𝑠(𝑃ℎ, 𝑇ℎ) − 𝑠(𝑃0, 𝑇0)]) + 𝑚̇ℎ𝑉ℎ2 2 (3-23) 𝐸̇𝑐 = 𝑚̇𝑐([ℎ(𝑃𝑐, 𝑇𝑐) − ℎ(𝑃0, 𝑇0)] − 𝑇0. [𝑠(𝑃𝑐, 𝑇𝑐) − 𝑠(𝑃0, 𝑇0)]) + 𝑚̇𝑐𝑉𝑐2 2 (3-24)
The first definition of exergy efficiency for any process was proposed by Grassmann in 1950 as follows [46]:
𝜂𝐺𝑟 =𝐸̇𝑜𝑢𝑡
𝐸̇𝑖𝑛 (3-25)
Where, 𝐸̇𝑜𝑢𝑡 = 𝐸̇𝑐+ 𝐸̇ℎ.
However, Brodyansky et al. [47] proposed excluding the transiting exergy flow from the numerator and denominator of equation (3-25). The transiting exergy flow is the part of exergy that enters the system and leaves it without transformation. As a result, the exergy efficiency is defined as: 𝜂𝑡𝑟 = 𝐸̇𝑜𝑢𝑡− 𝐸̇𝑡𝑟 𝐸̇𝑖𝑛− 𝐸̇𝑡𝑟 = 𝛥𝐸̇ 𝛻𝐸̇ (3-26)
In both exergy efficiency definitions, exergy losses are the same but the useful effects presented in the numerator and the exergy expenses presented in the denominator are different. ΔĖ and ∇Ė are the produced and consumed exergies in the process, respectively.
Sorin and Khennich [48] applied the transiting exergy to evaluate the efficiency of the air vortex tube. As a result, ΔĖ and ∇Ė for the cold and hot streams were calculated as:
𝛥𝐸̇𝑐 = 𝑚̇𝑖𝑛. 𝜀. [𝑒(𝑃𝑐, 𝑇𝑐) − 𝑒(𝑃𝑚𝑖𝑛, 𝑇0)] (3-27)
27 𝛥𝐸̇ℎ= 𝑚̇𝑖𝑛. (1 − 𝜀). [𝑒(𝑃ℎ, 𝑇ℎ)
− 𝑒(𝑃𝑚𝑖𝑛, 𝑇𝑚𝑖𝑛)] (3-29)
𝛻𝐸̇ℎ = 𝑚̇𝑖𝑛. (1 − 𝜀). [𝑒(𝑃𝑖𝑛, 𝑇𝑖𝑛)
− 𝑒(𝑃𝑚𝑖𝑛, 𝑇0)] (3-30)
Where ΔĖ = ΔĖh+ ΔĖc and ∇Ė = ∇Ėh+ ∇Ėc.
Calculation of the transiting exergy (the second term in each of the four previous equations) depends on three different situations.
If (𝑇𝑖𝑛 > 𝑇0 and 𝑇𝑜𝑢𝑡 > 𝑇0): 𝐸̇𝑡𝑟 = 𝑚̇. 𝑒𝑡𝑟(𝑃𝑚𝑖𝑛, 𝑇𝑚𝑖𝑛) (3-31)
If (𝑇𝑖𝑛 < 𝑇0 and 𝑇𝑜𝑢𝑡 < 𝑇0): 𝐸̇𝑡𝑟 = 𝑚̇. 𝑒𝑡𝑟(𝑃𝑚𝑖𝑛, 𝑇𝑚𝑎𝑥) (3-32)
If (𝑇𝑖𝑛> 𝑇0 and 𝑇𝑜𝑢𝑡 < 𝑇0) OR (𝑇𝑖𝑛 < 𝑇0 and 𝑇𝑜𝑢𝑡 > 𝑇0) 𝐸̇𝑡𝑟 =
𝑚̇. 𝑒𝑡𝑟(𝑃𝑚𝑖𝑛, 𝑇0) (3-33)
Where, 𝑃𝑚𝑖𝑛 is the lowest pressure when comparing the inlet and outlet pressure values. Given that the considered CO2 vortex tube works across the environmental temperature T0 (280
K, 285 K and 290 K) and the environmental pressure 𝑃0 = 101.3 𝑘𝑃𝑎 equation (3-33) is used to evaluate the terms 𝛥𝐸̇ℎ, 𝛥𝐸̇𝑐, 𝛻𝐸̇ℎand 𝛻𝐸̇𝑐 given in equations (27)-(30).
3-5 Results and discussion
In the present study, the effect of inlet pressure and cold mass fraction, which is varied by changing the pressure at the hot exit, are investigated on different aspects of vortex tube. Energy separation is discussed in terms of the hot exit and cold exit temperature differences, both with respect to the VT inlet temperature. Performance is characterized by cooling power, heating power, and both energy and exergy efficiencies. To better understanding the flow inside the vortex tube temperature, pressure, velocity in different sections of vortex tube and, the effect of inlet pressure and cold mass fraction are investigated on cooling and heating power, COP and exergy efficiency.
28
Figure 3-5illustrates the effect of inlet pressure (𝑃𝑖𝑛) and the cold mass fraction (𝜀) on the cold exit temperature difference (∆𝑇𝑐). The cold exit temperature difference increases with higher inlet pressure, which could be due to increasing swirl velocity. When the cold mass fraction increases, it means that more fluid leaves the cold outlet so cold fluid mixes with hot fluid and the temperature difference decreases. For inlet pressures of 550 kPa, 850 kPa and 1300 kPa, the cold exit temperature difference is 23.7 ˚C, 30.86 ˚C and 44.2 ˚C for a cold mass fraction of 0.2; For the same three inlet pressures, the cold exit temperature difference trend decreases to 7.2 ˚C, 8.7 ˚C and 9.7 ˚C for a cold mass fraction of 0.9.
Figure 3-5. Effect of inlet pressure and cold mass fraction on cold exit temperature difference. As shown in Figure 3-6, as the cold mass fraction (𝜀) increases, the hot exit temperature difference (∆𝑇ℎ) increases. As mentioned, increasing the inlet pressure causes an increase in the swirl velocity, leading to an increase in the hot exit temperature difference. The hot exit temperature difference is 5.5 ˚C, 9.4 ˚C and 10 ˚C at 𝜀 = 0.2, and 59.4 ˚C, 70.6 ˚C and 78.9 ˚C at 𝜀 = 0.9, corresponding to inlet pressures of 550 kPa, 850 kPa and 1300 kPa respectively.
29
Figure 3-6. Effect of inlet pressure and cold mass fraction on hot exit temperature difference. In addition to the temperature difference, the flow pattern inside the vortex tube is vital to understand the mechanism of energy separation.
Figure 3-7 depicts the swirl velocity as a function of dimensionless radial position (𝑟
𝑅, 0 ≤
𝑟 ≤ 𝑅 ), for three dimensionless axial locations (x/L), and three inlet pressures. As CO2 is admitted into the vortex tube, it expands, causing the static pressure to drop and the swirl velocity magnitude to increase. Velocity increases owing to increase the inlet pressure from 550 kPa to 1300 kPa, which causes higher expansion. Due to friction between peripheral stream and the wall, and friction between the CO2 layers, the velocities of peripheral stream and inner core stream decrease as the streams move towards the hot exit of the vortex tube. The magnitude of the swirl velocity is very low near the core and increases with the increasing radius of the tube. Swirl velocity is zero at the wall because of the no-slip boundary condition. Therefore, the linear part of the swirl velocity diagram confirms the presence of a forced vortex (swirl velocity is directly proportional to the radius, V∝r) near the centerline and a free vortex near the wall (swirl velocity is inversely proportional to the radius, V∝1/r).
31
Figure 3-7. Radial profile of swirl velocity for inlet pressure 550, 850 and 1300kPa and dimensionless axial locations (x/ L) 0.1, 0.4 and 0.7.
Figure 3-8 illustrates the axial velocity as a function of dimensionless radial position (r/R), for three dimensionless axial locations (x/L), and three inlet pressures. According to the assumed sign convention for the axial velocity, positive values indicate movement toward the hot exit, while negative values indicate movement toward the cold exit. As the flow moves to the hot exit, it loses its kinetic energy and finally it cannot overcome the pressure difference between the hot and cold exits, hence it backs to the cold exit. As it is shown in Figure 3-8, as the cold mass fraction increases, the magnitude of the positive axial velocity decreases and the magnitude of the negative axial velocity increases, due to the increasing pressure gradient. The magnitude of swirl velocity is five times greater than the axial velocity in each x/L.
33
Figure 3-8. Radial profile of axial velocity for inlet pressure 550, 850 and 1300kPa and dimensionless axial locations (x/ L) .1, 0.4 and 0.7.
Figure 3-9 shows the profile of the static temperature as a function of dimensionless radial position (r/R), for three dimensionless axial locations (x/L), and three inlet pressures. The expansion process takes place in the inlet nozzle and leads to a drop in flow temperature and an increase in the tangential velocity. When inlet pressure increases, it causes higher expansion of the admitted gas into the vortex tube, which leads to lower static temperature. The inner flow has a higher static temperature than the peripheral flow and this static temperature difference between the two streams enhances heat transfer from the inner region to the peripheral region. The peripheral flow has the higher kinetic energy than core flow because of higher velocity so it has a lower static temperature with respect to the inner flow. The no-slip boundary condition at wall explains the sudden increase in static temperature. In addition, as the peripheral and flow the inner flows move toward the hot exit, its velocity decreases so the static temperature decreases owing to the conversion of kinetic energy to thermal energy.
35
Figure 3-9. Radial profile of static temperature for inlet pressure 550, 850 and 1300kPa and dimensionless axial locations (x/ L) 0.1, 0.4 and 0.7.
Figure 3-10 illustrates the total temperature profile as a function of dimensionless radial position (r/R), for three dimensionless axial locations (x/L), and three inlet pressures at 𝛼=0.5. It is obvious that as flow moves toward the hot exit, the total temperature increases owing to the gain in the kinetic energy and this value decreases at the radius because of low velocity magnitude, which leads to low kinetic energy. The total temperature is calculated by following expression:
Total enthalpy is expressed in terms of a static enthalpy and the flow kinetic energy:
ℎ𝑡𝑜𝑡 = ℎ𝑠𝑡𝑎𝑡 +1
2(𝑉. 𝑉)
(3-34) Static enthalpy is calculated based on static temperature and static pressure where:
ℎ𝑠𝑡𝑎𝑡 − ℎ𝑟𝑒𝑓 = ℎ(𝑇𝑠𝑡𝑎𝑡, 𝑃𝑠𝑡𝑎𝑡) − ℎ(𝑇𝑟𝑒𝑓, 𝑃𝑟𝑒𝑓) (3-35) The entropy can be evaluated by the following equation:
36 𝑠 − 𝑠𝑟𝑒𝑓= ∫ 1 𝑇𝑑ℎ − ∫ 1 𝜌𝑇𝑑𝑃 𝑃 𝑃𝑟𝑒𝑓 ℎ ℎ𝑟𝑒𝑓 (3-36) Also, ℎ𝑡𝑜𝑡− ℎ𝑟𝑒𝑓 = ℎ(𝑇𝑡𝑜𝑡, 𝑃𝑡𝑜𝑡) − ℎ(𝑇𝑟𝑒𝑓, 𝑃𝑟𝑒𝑓) (3-37)
Step 1: The Fluent solver calculates the total enthalpy and static pressure so the static enthalpy can be calculated by using the flow velocity (Eq. 3-34). Therefore, static temperature can be calculated by Eq. 3-35.
Step 2: Using the isentropic assumption 𝑠𝑡𝑜𝑡= 𝑠𝑠𝑡𝑎𝑡, total pressure will be evaluated by Eq. 3-36.
Step 3: Finally, by knowing the total enthalpy and total pressure, the total temperature can be calculated by Eq. 3-37.
The total temperature profile is similar to the velocity profile because from equation (3-34), total temperature depends on static temperature and velocity with an order one and two, respectively. Therefore, increasing the velocity leads to an increase in the total temperature. Maximum total temperature is near the radius and equals 289.2 K, 291.6 K, 293.1 K at x/L=0.1, 303.1 K, 308.3 K and 313.2 K at x/L=0.4 and 308.1 K, 313.2 K, 321.5 K at x/L=0.7 for inlet pressures of 550 kPa, 850 kPa and 1300 kPa.